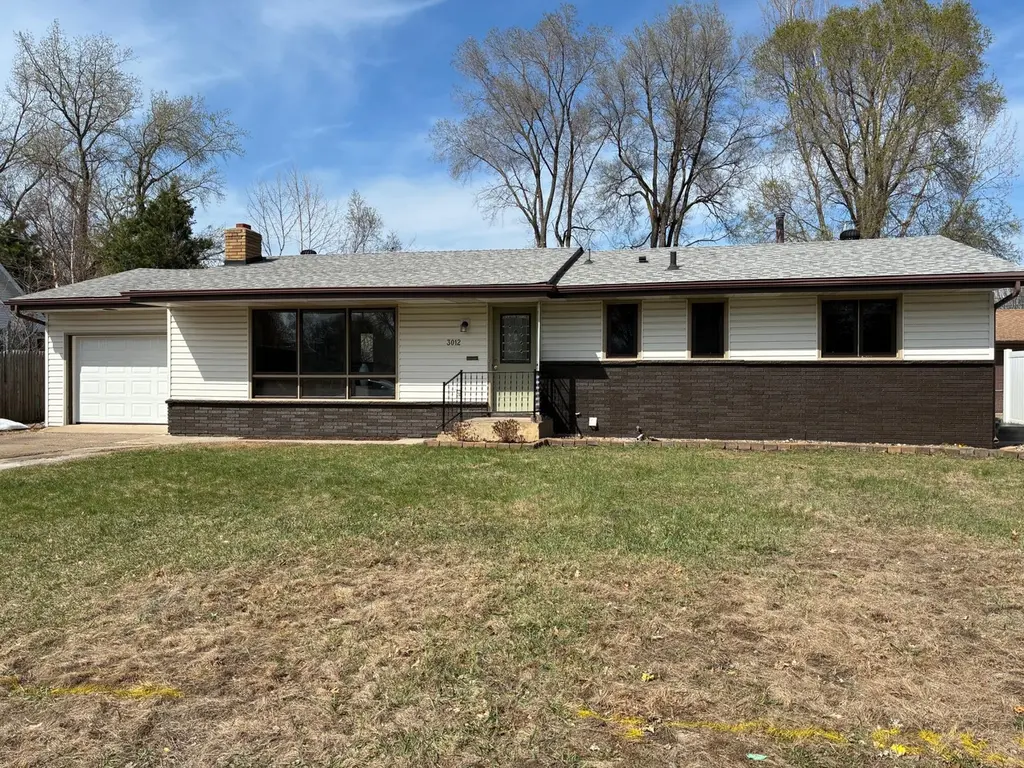
3012 68th Ave N · Brooklyn Center, MN
Flood risk 1/10 · Minimal
- FEMA flood zone
- X (unshaded)
- Chance of flooding over 30 yrs
- 0.0%
- Est. flood insurance / yr
- $473 – $860
Fire risk 1/10 · Minimal
- Est. fire insurance / yr
- $888 – $1,650
Heat risk 2/10 · Minimal
- Hot days now (above 100°F)
- 7 days/yr
- Hot days in 30 yrs
- 14 days/yr
Wind risk 2/10 · Minimal
- Chance of severe wind over 30 yrs
- —
Air-quality risk 2/10 · Minimal
- Unhealthy air days now
- 2 days/yr
- Unhealthy air days in 30 yrs
- 2 days/yr
Risk factors via First Street. Map © Google.
Why this score? — see what drove the D grade
The composite is a weighted blend of 9 inputs, each scored 0–100. Each bar is that input's sub-score; the figure is the points it added to the 100-point composite (weight × sub-score).
- Cash flow +12.2/30.0
- ARV discount +11.0/15.0
- Schools +4.2/10.0
- Livability +3.7/5.0
- DSCR +3.6/10.0
- 1% rule +3.2/10.0
- Rent growth +2.5/5.0
- Condition / age +2.5/5.0
- Appreciation +0.0/10.0
$349,900
🖨 Deal sheet (PDF) 📄 Offer letter ✓ Due diligence
Listing remarks
Fully renovated and move-in ready! This beauty offers modern comfort with stylish finishes throughout. Enjoy a new kitchen featuring new appliances, overlooking rear deck and big backyard- watch the kids play while you cook! Fresh paint and new carpet create a bright, inviting interior. The home also features an updated bathroom, a new garage door, and thoughtful upgrades that add both value and peace of mind. Prime location in Brooklyn Center with easy access to parks, shopping, and major highways, this home is perfect for buyers seeking a turnkey home with contemporary updates.
Key facts
- Big backyard
- New kitchen
- Rear deck
Tags
Property features AI
Finance
- Financial info: Conventional mortgage types indicated
Exterior
- Parking: Attached garage (1 car)
- Utilities: City water (connected / in street); City sewer (connected); Natural gas fuel; Electric service with circuit breakers
- Home design: Residential property; One level (with finished basement); Above- and below-grade finished living areas
- Construction: Brick and frame construction; Asphalt roof; Block foundation; Built areas include above-grade and below-grade finished space
- Exterior features: Deck; Metal, vinyl, and wood exterior accents; Chain link fencing; Storage shed on property
Interior
- Kitchen: Dishwasher; Microwave; Stainless steel appliances; Eat-in kitchen layout
- Bedrooms: 5 bedrooms total; Three main-level bedrooms (including two listed as Main); Bedroom sizes include 12x12 and multiple 10x11 rooms; one bedroom listed as 10x11 (Bedroom 5)
- Bathrooms: 2 full bathrooms; 1 half bathroom (main floor)
- Heating & cooling: Forced air heating; Fireplace(s) contribute to heating; Central air conditioning
- Interior features: Finished basement with egress window(s) and drainage system; Brick fireplace in amusement/rec room, wood-burning; Eat-in kitchen and a separate formal dining room; Stainless steel appliances; Exhaust fan; Gas water heater; Accessibility features (unspecified)
- Laundry & utility: Washer hookup; Dryer hookup (electric); Laundry sink; Laundry located on lower level/basement
Neighborhood map
What this means for you Summary
Snapshot
- This is a 4-bed/2.5-bath single-family listed at $350k.
Deal economics
- At list price, monthly cash flow is $-70 ($-842/yr) — negative.
- To cash-flow at today's rent, offer at most $338k (3.5% below list).
- To meet the 1% rule (rent ≥ 1% of price), the offer needs to be $288k (17.6% below list).
- Recommended offer: $288k (17.6% below list) — sets the bar for 1% rule.
- Cap rate 6.1% vs local median 5.0% in Brooklyn Center — meaningfully above typical; check what's discounted (condition, days-on-market, listing class) to confirm the premium yield is real.
Location & tenants
- Location reads 73/100 on livability (#253 in MN) — a middle-class / working-renter tenant base. Strengths: commute A+, housing A+, cost of living A-; Watch: crime F, amenities F.
- Osseo Public School District (suburban): math 42% / reading 51% proficiency, ranked #129 of 301 in MN (top 43%) — families likely to look elsewhere, expect single-tenant / working-renter base with shorter leases.
- Zoned schools: Garden City Elementary (math 12% / reading 17%, grade F, #790 of 857 statewide, top 93%, 335 students, 80% FRL); Brooklyn Middle Steam School (math 20% / reading 41%, grade F, #192 of 258 statewide, top 77%, 978 students, 70% FRL); Park Center Ib World School (math 12% / reading 42%, grade F, #369 of 471 statewide, top 79%, 1,908 students, 70% FRL) — zoned schools average 73% FRL vs 32% district-wide (42 pts higher); higher-poverty schools than district average — tighter screening recommended.
- Zoned-school proficiency averages 24% at this address vs 46% district-wide (-22 pts) — the specific schools serving this property underperform the Osseo Public School District average; the district grade overstates school quality for this exact location.
- Market conditions: 84 active listings in the ZIP; 6 comparable units currently listed for rent nearby; rentals at typical pace (median 18d on market — plan ~3-4 weeks tenant-placement turnaround); 4,651 units permitted in Hennepin County in 2024 (2,443 in 5+ unit buildings).
Forward outlook
- Local home prices are declining (-3.0%/yr); year-one equity from $2k of loan paydown is wiped out by about $10k of value loss. Plan a longer hold.
- Hennepin County population projected at +30% by 2050 — long-run rental-demand tailwind backs the buy-and-hold thesis.
Negotiation context
- It's been on market 18 days — a 2% lower offer ($345k) is reasonable based on typical stale-listing flexibility.
- 2 sale attempts since 27y ago with the ask held roughly flat each time — persistent listings suggest the price (not the market) is what's stuck; bring a comps-based counter.
- Current owner paid $125k; list at $350k implies a 180% gain — meaningful room to come down on a strong offer.
Risks & watch-outs
- Watch-outs: built in 1959 — expect roof / HVAC / electrical / plumbing capex.
Questions for the listing agent
- What do current leases actually rent for vs. the listed asking? Can we see a recent rent roll and the last 12 months of T-12 income?
- Built in 1959 — when were the roof, HVAC, electrical panel, plumbing, and water heater last replaced?
- Is there a deadline driving the sale (1031 exchange, divorce, estate, relocation)? That informs how much negotiation room exists.
- Schools are D-rated, which usually means shorter tenancies and higher turnover. Who's the typical renter profile here, and what's been the actual vacancy rate?
- Crime grade is F in this area — have there been break-ins, vandalism, or insurance claims at this property in the last 3 years? What carrier currently insures it and at what premium?
- The area grade is low — what's the realistic commute time and amenity access for the typical tenant pool here? Any planned neighborhood developments (good or bad) we should know about?
- What's the average days-on-market for RENTAL listings here right now (not sales)? A rising rental-DOM trend means longer vacancies and softer asking-rent achievability than the comps imply.
- What's the recent tenant-quality profile in this submarket — average credit score on applications, eviction rate, late-payment / NSF rate, and stable-employment percentage? A property-management company in the area should have these aggregated.
- How much new for-sale + rental construction is in the pipeline within 1–3 miles? Heavy new supply typically softens prices + rents 12–24 months out; constrained supply supports both.
Investment metrics
- 1% rule
- 0.82% ✗
- Cap rate
- 6.05%
- Cash-on-cash
- -0.86%
- DSCR
- 0.96
- GRM
- 10.1
CMA / ARV
- ARV (median comp)
- $379,400
- List price
- $349,900
- Delta
- -7.78%
- Verdict
- FAIR
- Comps
- 2 within 1.0 mi
Projected returns pro-forma
-3.0% appreciation · 3.0% rent growth · sell at horizon
- IRR
- -17.7%
- Equity multiple
- 0.38×
- Total profit
- $-61,166
- Equity at exit
- $52,171
- IRR
- -9.8%
- Equity multiple
- 0.40×
- Total profit
- $-59,012
- Equity at exit
- $30,253
Cash invested: $97,972 (down + closing). Projections, not guarantees.
Landlord ↔ Tenant lean methodology
- Overall (STATE)
- 46 Balanced
- State Minnesota
- 46 Balanced · D+2
- County
- — inherits STATE
- City
- — inherits STATE
ZIP-level market 55429
- Active inventory
- 84
- Price-to-rent
- 10.1×
Monthly cashflow live
- Estimated rent
- $2,884 high interval (Pro) →
- Mortgage (P&I)
- −$1,835
- Tax from tax record
- −$368 /mo · $4,414/yr
- Insurance
- −$146
- HOA
- −$0
- Vacancy / Maint / Mgmt
- −$606
- Net cashflow
- $-70
Break-even live
Sensitivity live
| Price | -10% $128 | -5% $29 | +0% $-70 | +5% $-169 | +10% $-268 |
|---|---|---|---|---|---|
| Rent | -10% $-298 | -5% $-184 | +0% $-70 | +5% $44 | +10% $158 |
| Rate | -1.0pp $106 | -0.5pp $19 | base $-70 | +0.5pp $-161 | +1.0pp $-253 |
UW: 25.0% down · 7.5% · 30yr · 1.5% tax · 5.0% vac · 8.0% maint · 8.0% mgmt
Financing live
Cash to close
- Down payment
- $87,475
- Closing costs
- $10,497
- Reserves months
- —
- Total cash needed
- —
Loan-product check · same deal, 3 products live
Conventional
25% down · 7.5% · 30yr
- Down + closing
- —
- Monthly P&I
- —
- Monthly cashflow
- —
- DSCR
- —
- Eligible?
- —
Personal DTI + credit; lowest rate.
DSCR
20% down · 8.5% · 30yr
- Down + closing
- —
- Monthly P&I
- —
- Monthly cashflow
- —
- DSCR
- —
- Eligible?
- —
No personal income docs; deal must DSCR.
Hard money
10% down · 12.0% · 12mo
- Down + closing
- —
- Monthly P&I
- —
- Monthly cashflow
- —
- DSCR
- —
- Eligible?
- —
Short-term bridge; refi at stabilization.
Rent comps 6 comps
| Address | Beds | Baths | Sqft | Rent | $/sqft | DOM | Units | Dist |
|---|---|---|---|---|---|---|---|---|
| 3119 67th Ave N Minneapolis, MN | 4.0 | 2.0 | 2056 | $3,000 | $1.46 | 45d | 1 | 0.16mi |
| 7212 Kyle Ave N Minneapolis, MN | 3.0 | 2.0 | 1700 | $2,400 | $1.41 | 45d | 1 | 0.94mi |
| 1506 71st Ave N Minneapolis, MN | 5.0 | 2.0 | 2109 | $2,999 | $1.42 | 18d | 1 | 1.06mi |
| 3401 75th Ave N Minneapolis, MN | 4.0 | 2.0 | 2088 | $2,729 | $1.31 | 4d | 1 | 1.07mi |
| 7441 Major Ave N Minneapolis, MN | 3.0 | 2.0 | 1800 | $2,600 | $1.44 | 18d | 1 | 1.28mi |
| 2717 78th Ave N Minneapolis, MN | 4.0 | 2.0 | 1900 | $2,779 | $1.46 | 12d | 1 | 1.41mi |
Listing history 9 events
-
2026-05-09status Pending 586-char remark
-
2026-05-06price $349,900 586-char remark
-
2026-05-02price $358,000 586-char remark
-
2026-04-28price $360,000 586-char remark
-
2026-04-20$367,000 Active 586-char remark
-
2000-07-25soldstatus $124,900
-
1999-10-18historical
-
1999-10-12$119,900
-
1997-07-16soldstatus $85,000
ⓘ Source: listings_history table (triggers on properties + properties_extension) + one-shot
backfill from property_details.listing_events for pre-trigger history.
Tax reassessment forecast MN · Partial reset (capped growth)
- Current annual tax
- $4,414 · $368/mo
- Projected year-2 tax
- $4,414 · $368/mo
- Expected delta
- $0/yr ($0/mo · 0.0%)
ⓘ Screening estimate from a state-policy table — verify with the county assessor before closing.
Climate risk First Street
- Flood 1/10 Low FEMA zone X (unshaded) · 0% chance over 30 yrs
- Wildfire 1/10 Low
- Heat 2/10 Low 7 d/yr ≥100°F today · 14 d/yr by 30 yrs out
- Wind 2/10 Low
- Air quality 2/10 Low 2 unhealthy d/yr today · 2 by 30 yrs out
Nearby sold comps map
Loading sold comps map…
Walkable amenities ~0.75 mi
Loading nearby amenities…
Taxation est. · year 1
- Rental income
- $34,608
- − Mortgage interest
- −$19,600
- − Property taxes
- −$4,414
- − Insurance
- −$1,750
- − Repairs & maintenance
- −$2,769
- − Management
- −$2,769
- − Depreciation
- −$10,179
- Taxable loss
- −$6,871
- Est. tax savings @ 24.0%
- +$1,649
- After-tax cash flow
- $807/yr
For passive investors: Depreciation is non-cash, so a rental often shows a tax loss while cash-flowing — sheltering income. Rental losses are passive: they offset passive income freely, and up to $25,000/yr can offset ordinary (W-2) income if you actively participate and your MAGI is under $100k (phasing out to $0 by $150k); unused losses carry forward. On sale, claimed depreciation is recaptured at up to 25%, and gains may owe capital-gains tax (a 1031 exchange can defer both). Figures are a year-1 estimate at your 24.0% rate — not tax advice; consult a CPA.
Schools (NCES district)
- District
- Osseo Public School District
- NCES district ID
- 2725200
- Math proficiency
- 42% ▼ -7.00%
- Reading proficiency
- 51% ▼ -4.00%
- Median HH income
- $76,168
- Composite
- 42.35/100
- National rank
- #3250
- State rank
- #129 of 301 in MN
Livability — Brooklyn Center
- Score
- 73/100
- State rank
- #253
- US rank
- #5422
Category grades
Schools grade is shown separately in the Schools card above.
Census & demographics
- Census place
- Brooklyn Center, MN
- City population
- 22,749
- Population (ZIP)
- 27,570
Population outlook (Hennepin County) Hauer SSP2
- Today (2025)
- 1,405,227 people
- By 2030
- 1,492,650 · +6.2%
- By 2040
- 1,660,157 · +18.1%
- By 2050
- 1,823,498 · +29.8%
- By 2075
- 2,221,283 · +58.1%
- By 2100
- 2,509,976 · +78.6%
Race, ethnicity, and origin ACS 2023
- Neighborhood character
- Highly diverse neighborhood (Simpson 0.73)
- Race & ethnicity
- Black 34% White 34% Asian 15% Hispanic / Latino 11% Two or more races 8% Native American 1%
- Hispanic origin (detail)
- Mexican 7%
- Common ancestry
- Swiss 9% Portuguese 5% Romanian 2%
- Foreign-born
- 24% · Canada, Vietnam
- Languages at home
- 70% English-only · Spanish 10% Other Asian/Pacific 9% French/Haitian/Cajun 1%
Political lean MEDSL · Hennepin
- 2024 margin
- Solid D (+42.6) · D 70.2% · R 27.5% · Other 2.3%
- 2008→2024 swing
- +14.0pp toward D · 2008: 28.6pp · 2024: 42.6pp
- All cycles
- 2024: D+42.6 2020: D+43.2 2016: D+35.3 2012: D+27.1 2008: D+28.6
Not yet ingested
- Civics
- —
Market trends
- HPI YoY
- ▼ -228.09%
- Current HPI
- 266.119
- Rent YoY
- —
- Metro
- —
- State GDP YoY
- ▲ 2.41%
- F500 in state
- 34
Industry mix (Fortune 500 HQ in MN)
| Industry | F500 HQs | Revenue |
|---|---|---|
| Healthcare | 2 | $407B |
|
||
| Retail | 2 | $150B |
|
||
| Consumer Goods | 2 | $32B |
|
||
| Industrial Machinery | 2 | $6B |
|
||
| Agriculture | 1 | $40B |
|
||
| Healthcare / Medical Devices | 1 | $32B |
|
||
Price history
+311.6% since first listed9 events — show timeline
- 2026-05-09 Pending — NORTHSTARMLS as Distributed by MLS Grid
- 2026-05-06 Price Changed $349,900 NORTHSTARMLS as Distributed by MLS Grid
- 2026-05-02 Price Changed $358,000 NORTHSTARMLS as Distributed by MLS Grid
- 2026-04-28 Price Changed $360,000 NORTHSTARMLS as Distributed by MLS Grid
- 2026-04-20 Listed $367,000 NORTHSTARMLS as Distributed by MLS Grid
- 2000-07-25 Sold (MLS) $124,900 NORTHSTARMLS as Distributed by MLS Grid
- 1999-10-18 Listing Removed — NORTHSTARMLS as Distributed by MLS Grid
- 1999-10-12 Listed $119,900 NORTHSTARMLS as Distributed by MLS Grid
- 1997-07-16 Sold (Public Records) $85,000 Public Records
Property tax history
+5.1%/yrLatest (2025): $4,414 · +2.2% YoY. Source: county tax records.
Cash-flow waterfall
monthlySold comps — $/sqft
last 12 mo · ≤1 miLoading sold comps…