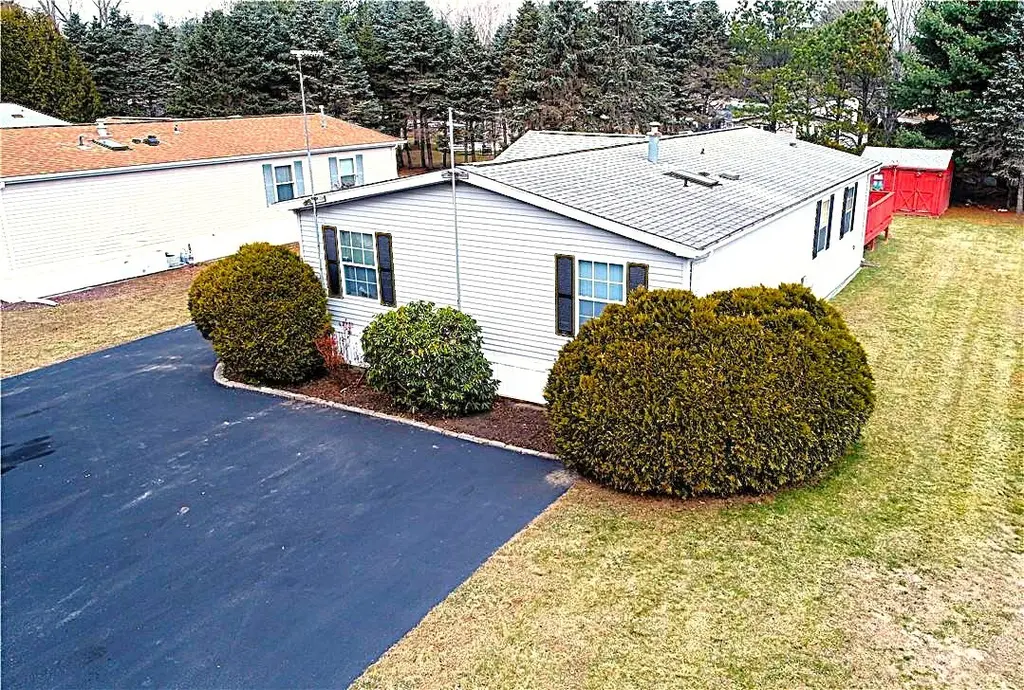
26 Kelly Ln · Cranston, RI
Flood risk No data
- FEMA flood zone
- —
- Chance of flooding over 30 yrs
- —
- Est. flood insurance / yr
- —
Fire risk No data
- Est. fire insurance / yr
- —
Heat risk No data
- Hot days now (above threshold)
- —
- Hot days in 30 yrs
- —
Wind risk No data
- Chance of severe wind over 30 yrs
- —
Air-quality risk No data
- Unhealthy air days now
- —
- Unhealthy air days in 30 yrs
- —
Risk factors via First Street. Map © Google.
Why this score? — see what drove the B- grade
The composite is a weighted blend of 9 inputs, each scored 0–100. Each bar is that input's sub-score; the figure is the points it added to the 100-point composite (weight × sub-score).
- Cash flow +25.5/30.0
- ARV discount +13.1/15.0
- DSCR +8.5/10.0
- 1% rule +6.5/10.0
- Livability +4.4/5.0
- Schools +3.0/10.0
- Rent growth +2.5/5.0
- Condition / age +2.5/5.0
- Appreciation +0.0/10.0
$199,000
🖨 Deal sheet (PDF) 📄 Offer letter ✓ Due diligence
Listing remarks
Welcome home to this "EXCELLENT" well-maintained modular Ranch. This home boasts an inviting open layout plus offers comfort, convenience to anyone seeking single-level living. Featuring a Master suite, spacious bedroom and a nice office/den, 2 full bathrooms, Vaulted ceilings throughout, granite counters and connected to all utilities! Step outside to enjoy the "HUGE" rear deck that is set-up for a hot-tub and ideal for relaxing, grilling, or hosting gatherings. Large shed, paved driveway and more! Placed in a quiet area with easy access to local amenities. this home is Perfect for downsizing. Don't miss this opportunity!
Key facts
- Master suite
- Hot-tub setup
- Paved driveway
Tags
Property features AI
Finance
- Financial info: Property has a land lease
- HOA & community: Community amenities include pool, tennis courts, recreation area, nearby shopping and restaurants, public transportation, highway access, and proximity to schools
Exterior
- Parking: No garage; Parking for 5 vehicles
- Utilities: Sewer connected; Water connected; 100 amp electrical service
- Home design: Single-story home; Vinyl siding; Drywall interior; Slab foundation
- Construction: Vinyl siding; Drywall; Slab foundation
- Exterior features: Deck; Outbuilding; Wooded lot
Interior
- Kitchen: Oven; Range; Range hood; Dishwasher; Refrigerator
- Bedrooms: Total rooms: 5
- Flooring: Ceramic tile; Vinyl
- Bathrooms: 2 full bathrooms
- Heating & cooling: Forced air heating (gas); Central air conditioning
- Interior features: Cathedral and vaulted ceilings; High ceilings; Skylights; Tub with shower; Cable TV; Storm doors; Thermal windows
- Laundry & utility: Washer; Dryer; Water heater
Neighborhood map
What this means for you Summary
Snapshot
- This is a 2-bed/3.0-bath manufactured listed at $199k.
Deal economics
- At list price, monthly cash flow is $466 ($6k/yr) — positive.
- The deal already cash-flows at list — no discount required.
- Meets the 1% rule at list price ($2k rent vs $199k).
- Recommended offer: $196k (1.5% below list) — sets the bar for market timing.
- Cap rate 9.1% vs local median 3.2% in Cranston — top-decile yield for the area; either an underpriced asset or a hidden risk that comps aren't pricing in. Stress-test before assuming the spread holds.
Location & tenants
- Location reads 87/100 on livability (#1 in RI, #323 nationally) — a professional / high-income tenant draw. Strengths: crime A+, employment A+, housing A+.
- Coventry (suburban): math 25% / reading 41% proficiency, ranked #19 of 39 in RI (top 49%) — families likely to look elsewhere, expect single-tenant / working-renter base with shorter leases.
- Zoned schools: Alan Shawn Feinstein Ms of Cov (math 18% / reading 31%, grade F, #28 of 57 statewide, top 48%, 974 students, 29% FRL).
- Market conditions: 177 active listings in the ZIP; 1 comparable units currently listed for rent nearby; solid renter incomes; 471 units permitted in Kent County in 2024 (240 in 5+ unit buildings).
Forward outlook
- Local home prices are declining (-3.0%/yr); year-one equity from $1k of loan paydown is wiped out by about $6k of value loss. Plan a longer hold.
- Kent County population projected at -14% by 2050 — secular population decline; favor cash flow + early exit over multi-decade hold.
Negotiation context
- It's been on market 29 days — a 2% lower offer ($196k) is reasonable based on typical stale-listing flexibility.
- 5 sale attempts since 25y ago with the ask held roughly flat each time — persistent listings suggest the price (not the market) is what's stuck; bring a comps-based counter.
- Current owner paid $82k; list at $199k implies a 143% gain — meaningful room to come down on a strong offer.
Questions for the listing agent
- Is there a deadline driving the sale (1031 exchange, divorce, estate, relocation)? That informs how much negotiation room exists.
- What's the average days-on-market for RENTAL listings here right now (not sales)? A rising rental-DOM trend means longer vacancies and softer asking-rent achievability than the comps imply.
- What's the recent tenant-quality profile in this submarket — average credit score on applications, eviction rate, late-payment / NSF rate, and stable-employment percentage? A property-management company in the area should have these aggregated.
- How much new for-sale + rental construction is in the pipeline within 1–3 miles? Heavy new supply typically softens prices + rents 12–24 months out; constrained supply supports both.
Investment metrics
- 1% rule
- 1.15% ✓
- Cap rate
- 9.10%
- Cash-on-cash
- 10.04%
- DSCR
- 1.45
- GRM
- 7.3
CMA / ARV
- ARV (on-the-fly)
- $227,136
- Comps found
- 1
Show comp detail 1 sale within ~0.75 mi
| Address | Dist | Beds/Ba | Sqft | Sold | Price | $/sf | Match |
|---|---|---|---|---|---|---|---|
| 10 Liena Rose Way | 0.18mi | 3/2.0 (+1) | 1,448 (+8%) | 22mo | $245,000 | $169 | 51 |
Match score weights: distance 35% · size 25% · config 20% · recency 20%. Top-matched comps best support the ARV.
Projected returns pro-forma
-3.0% appreciation · 3.0% rent growth · sell at horizon
- IRR
- -1.2%
- Equity multiple
- 0.95×
- Total profit
- $-2,549
- Equity at exit
- $29,672
- IRR
- 8.5%
- Equity multiple
- 1.65×
- Total profit
- $36,056
- Equity at exit
- $17,206
Cash invested: $55,720 (down + closing). Projections, not guarantees.
Landlord ↔ Tenant lean methodology
- Overall (STATE)
- 31 Tenant-Leaning
- State Rhode Island
- 31 Tenant-Leaning · D+8
- County
- — inherits STATE
- City
- — inherits STATE
ZIP-level market 02816
- Active inventory
- 177
- Price-to-rent
- 7.3×
Monthly cashflow live
- Estimated rent
- $2,285 medium interval (Pro) →
- Mortgage (P&I)
- −$1,044
- Tax from tax record
- −$213 /mo · $2,555/yr
- Insurance
- −$83
- HOA
- −$0
- Vacancy / Maint / Mgmt
- −$480
- Net cashflow
- $466
Break-even live
Sensitivity live
| Price | -10% $579 | -5% $522 | +0% $466 | +5% $410 | +10% $353 |
|---|---|---|---|---|---|
| Rent | -10% $286 | -5% $376 | +0% $466 | +5% $556 | +10% $647 |
| Rate | -1.0pp $566 | -0.5pp $517 | base $466 | +0.5pp $415 | +1.0pp $362 |
UW: 25.0% down · 7.5% · 30yr · 1.5% tax · 5.0% vac · 8.0% maint · 8.0% mgmt
Financing live
Cash to close
- Down payment
- $49,750
- Closing costs
- $5,970
- Reserves months
- —
- Total cash needed
- —
Loan-product check · same deal, 3 products live
Conventional
25% down · 7.5% · 30yr
- Down + closing
- —
- Monthly P&I
- —
- Monthly cashflow
- —
- DSCR
- —
- Eligible?
- —
Personal DTI + credit; lowest rate.
DSCR
20% down · 8.5% · 30yr
- Down + closing
- —
- Monthly P&I
- —
- Monthly cashflow
- —
- DSCR
- —
- Eligible?
- —
No personal income docs; deal must DSCR.
Hard money
10% down · 12.0% · 12mo
- Down + closing
- —
- Monthly P&I
- —
- Monthly cashflow
- —
- DSCR
- —
- Eligible?
- —
Short-term bridge; refi at stabilization.
Rent comps 1 comps
| Address | Beds | Baths | Sqft | Rent | $/sqft | DOM | Units | Dist |
|---|---|---|---|---|---|---|---|---|
| 5 Whitman St Coventry, RI | 3.0 | 1.0 | 1200 | $2,850 | $2.38 | 3d | 1 | 1.24mi |
Listing history 21 events
-
2026-06-13statusdays on market $199,000 Pending 29 DOM
-
2026-06-09days on market $199,000 Active Under Contract 28 DOM
-
2026-06-08days on market $199,000 Active Under Contract 27 DOM
-
2026-06-07days on market $199,000 Active Under Contract 26 DOM
-
2026-06-03days on market $199,000 Active Under Contract 22 DOM
-
2026-06-02days on market $199,000 Active Under Contract 21 DOM
-
2026-06-01days on market $199,000 Active Under Contract 20 DOM
-
2026-05-31days on market $199,000 Active Under Contract 19 DOM
-
2026-05-22historical Active Under Contract
-
2026-05-10$199,000 Active
-
2026-04-29historical
-
2025-12-09$239,977 Active
-
2016-11-08price $159,500
-
2016-11-08price $154,900
-
2006-09-29historical
-
2006-07-25$159,900
-
2006-07-12historical
-
2006-04-13$164,900
-
2001-05-30soldstatus $82,000
-
2001-04-05historical
-
2001-02-28$88,000
ⓘ Source: listings_history table (triggers on properties + properties_extension) + one-shot
backfill from property_details.listing_events for pre-trigger history.
Tax reassessment forecast RI · Partial reset (capped growth)
- Current annual tax
- $2,555 · $213/mo
- Projected year-2 tax
- $2,899 · $242/mo
- Expected delta
- +$344/yr (+$29/mo · 13.5%)
ⓘ Screening estimate from a state-policy table — verify with the county assessor before closing.
Nearby sold comps map
Loading sold comps map…
Walkable amenities ~0.75 mi
Loading nearby amenities…
Taxation est. · year 1
- Rental income
- $27,425
- − Mortgage interest
- −$11,147
- − Property taxes
- −$2,555
- − Insurance
- −$995
- − Repairs & maintenance
- −$2,194
- − Management
- −$2,194
- − Depreciation
- −$5,789
- Taxable income
- $2,551
- Est. tax owed @ 24.0%
- −$612
- After-tax cash flow
- $4,981/yr
For passive investors: Depreciation is non-cash, so a rental often shows a tax loss while cash-flowing — sheltering income. Rental losses are passive: they offset passive income freely, and up to $25,000/yr can offset ordinary (W-2) income if you actively participate and your MAGI is under $100k (phasing out to $0 by $150k); unused losses carry forward. On sale, claimed depreciation is recaptured at up to 25%, and gains may owe capital-gains tax (a 1031 exchange can defer both). Figures are a year-1 estimate at your 24.0% rate — not tax advice; consult a CPA.
Schools (NCES district)
- District
- Coventry
- NCES district ID
- 4400210
- Math proficiency
- 25% ▼ -10.00%
- Reading proficiency
- 41% ▼ -10.00%
- Median HH income
- $66,277
- Composite
- 30.18/100
- National rank
- #6317
- State rank
- #19 of 39 in RI
Livability — Cranston
- Score
- 87/100
- State rank
- #1
- US rank
- #323
Category grades
Schools grade is shown separately in the Schools card above.
Census & demographics
- County
- Kent County · 90,904 people
- City population
- 72,803
- Metro
- Providence-Warwick, RI-MA
- Population (ZIP)
- 33,298
- Household income
- $101,431
- Rent vs Own
- Severe rent burden
- 667.0
Population outlook (Kent County) Hauer SSP2
- Today (2025)
- 160,994 people
- By 2030
- 157,428 · -2.2%
- By 2040
- 148,389 · -7.8%
- By 2050
- 137,995 · -14.3%
- By 2075
- 118,536 · -26.4%
- By 2100
- 102,266 · -36.5%
Race, ethnicity, and origin ACS 2023
- Neighborhood character
- Predominantly White (90%)
- Race & ethnicity
- White 90% Two or more races 6% Hispanic / Latino 5% Asian 1%
- Common ancestry
- Lithuanian 13% Russian 8% Romanian 4%
- Foreign-born
- 3% · Canada, China
- Languages at home
- 94% English-only · Spanish 3% Other Indo-European 1% French/Haitian/Cajun 1%
Political lean MEDSL · Kent
- 2024 margin
- Toss-up / Even · D 49.9% · R 48.1% · Other 2.0%
- 2008→2024 swing
- -15.6pp toward R · 2008: 17.5pp · 2024: 1.9pp
- All cycles
- 2024: D+1.9 2020: D+7.6 2016: R+0.7 2012: D+18.4 2008: D+17.5
Not yet ingested
- Civics
- —
Market trends
- HPI YoY
- ▼ -362.74%
- Current HPI
- 336.2662
- Rent YoY
- —
- Metro
- Providence-Warwick, RI-MA
- State GDP YoY
- ▲ 2.25%
- F500 in state
- 10
Industry mix (Fortune 500 HQ in RI)
| Industry | F500 HQs | Revenue |
|---|---|---|
| Healthcare | 1 | $373B |
|
||
| Food Distribution | 1 | $31B |
|
||
| Aerospace / Defense | 1 | $14B |
|
||
| Financial Services | 1 | $8B |
|
||
| Consumer Goods | 1 | $4B |
|
||
Price history
+126.1% since first listed13 events — show timeline
- 2026-05-22 Contingent — RIS
- 2026-05-10 Listed $199,000 RIS
- 2026-04-29 Listing Removed — RIS
- 2025-12-09 Listed $239,977 RIS
- 2016-11-08 Price Changed $154,900 RIS
- 2016-11-08 Price Changed $159,500 RIS
- 2006-09-29 Listing Removed — RIS
- 2006-07-25 Listed $159,900 RIS
- 2006-07-12 Listing Removed — RIS
- 2006-04-13 Listed $164,900 RIS
- 2001-05-30 Sold (MLS) $82,000 RIS
- 2001-04-05 Listing Removed — RIS
- 2001-02-28 Listed $88,000 RIS
Property tax history
+2.6%/yrLatest (2025): $2,555 · -3.4% YoY. Source: county tax records.
Cash-flow waterfall
monthlySold comps — $/sqft
last 12 mo · ≤1 miLoading sold comps…