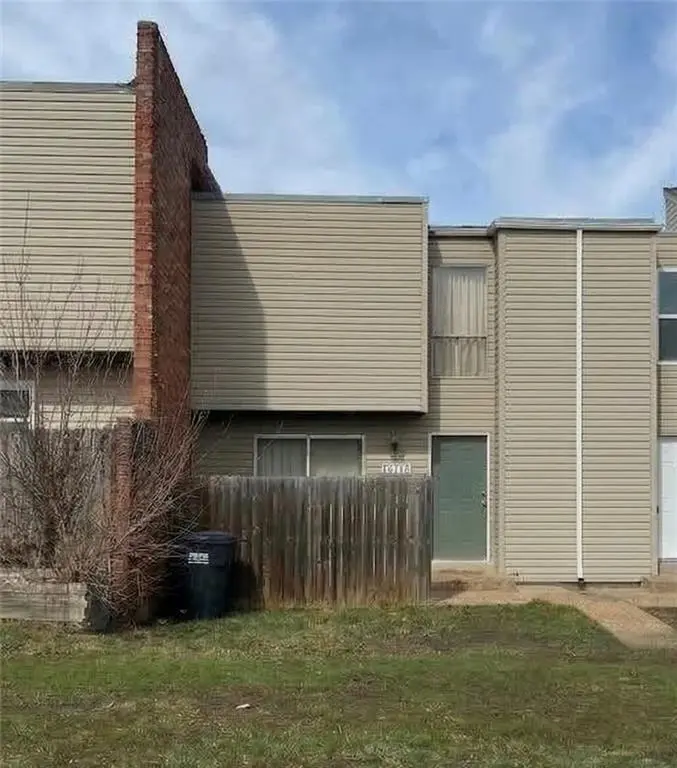
11239 Calico Dr · Kansas City, MO
Flood risk 1/10 · Minimal
- FEMA flood zone
- X (unshaded)
- Chance of flooding over 30 yrs
- 0.0%
- Est. flood insurance / yr
- $473 – $860
Fire risk 3/10 · Minor
- Est. fire insurance / yr
- $1,054 – $1,958
Heat risk 4/10 · Minor
- Hot days now (above 106°F)
- 7 days/yr
- Hot days in 30 yrs
- 17 days/yr
Wind risk 2/10 · Minimal
- Chance of severe wind over 30 yrs
- —
Air-quality risk 3/10 · Minor
- Unhealthy air days now
- 3 days/yr
- Unhealthy air days in 30 yrs
- 3 days/yr
Risk factors via First Street. Map © Google.
Why this score? — see what drove the B grade
The composite is a weighted blend of 9 inputs, each scored 0–100. Each bar is that input's sub-score; the figure is the points it added to the 100-point composite (weight × sub-score).
- Cash flow +28.6/30.0
- ARV discount +13.6/15.0
- DSCR +10.0/10.0
- 1% rule +9.7/10.0
- Rent growth +4.3/5.0
- Livability +3.9/5.0
- Condition / age +2.5/5.0
- Schools +1.1/10.0
- Appreciation +0.0/10.0
$105,000
🖨 Deal sheet (PDF) 📄 Offer letter ✓ Due diligence
Listing remarks MLS
Turnkey investment opportunity in Kansas City! This townhouse features 3 generous bedrooms and 1 full and 2 half bathrooms. It sits on a quiet street with a tenant already in place — no waiting for cash flow from day one. It features a full unfinished basement which could be finished for even more space! This property is being sold as part of a 6 home package. Please see MLS#'s
Key facts
- Quiet street
- $150 HOA
- Built 1970
Tags
Neighborhood map
What this means for you Summary
Snapshot
- This is a 3-bed/2.5-bath townhouse listed at $105k.
Deal economics
- At list price, monthly cash flow is $346 ($4k/yr) — positive.
- The deal already cash-flows at list — no discount required.
- Meets the 1% rule at list price ($2k rent vs $105k).
- Recommended offer: $99k (6.0% below list) — sets the bar for market timing.
- Cap rate 10.2% vs local median 3.9% in Kansas City — top-decile yield for the area; either an underpriced asset or a hidden risk that comps aren't pricing in. Stress-test before assuming the spread holds.
Location & tenants
- Location reads 78/100 on livability (#28 in MO, #2,671 nationally) — a middle-class / working-renter tenant base. Strengths: amenities A+, commute A+, cost of living A+; Watch: crime F.
- Hickman Mills C-1 (urban): math 8% / reading 18% proficiency, ranked #314 of 324 in MO (top 97%) — low school quality limits family demand, transient renter base, plan for 1-2y turnover; 78% free/reduced lunch — lower-income household profile, screen leases tightly.
- Zoned schools: Ervin Elementary School (math 8% / reading 12%, grade F, #1,037 of 1,115 statewide, top 94%, 629 students, 100% FRL); Smith-Hale Middle (math 7% / reading 19%, grade F, #368 of 391 statewide, top 94%, 770 students, 100% FRL); Ruskin High School (math 8% / reading 47%, grade F, #416 of 521 statewide, top 80%, 1,273 students, 100% FRL) — zoned schools average 100% FRL vs 78% district-wide (22 pts higher); higher-poverty schools than district average — tighter screening recommended.
- Market conditions: Rents rising fast (+7.3%/yr); 58 active listings in the ZIP; 10 comparable units currently listed for rent nearby; rentals at typical pace (median 26d on market — plan ~3-4 weeks tenant-placement turnaround); 4,002 units permitted in Jackson County in 2024 (2,271 in 5+ unit buildings).
Forward outlook
- Local home prices are declining (-3.0%/yr); year-one equity from $726 of loan paydown is wiped out by about $3k of value loss. Plan a longer hold.
- Jackson County population projected at +4% by 2050 — modest demand growth; plan on rents tracking national, not racing it.
- At projected returns (-3.0% appreciation + 7.3% rent growth), your $29k cash investment doubles in ~7 years — after that, you're playing with house money.
Negotiation context
- It's been on market 63 days — a 6% lower offer ($99k) is reasonable based on typical stale-listing flexibility.
- 3 sale attempts since 7y ago with the ask held roughly flat each time — persistent listings suggest the price (not the market) is what's stuck; bring a comps-based counter.
Questions for the listing agent
- It's been on market 63 days. Have you received any prior offers? Is the seller open to a 6% concession, seller financing, or rate buy-down credit?
- Built in 1970 — when were the roof, HVAC, electrical panel, plumbing, and water heater last replaced?
- What does the HOA fee cover, when was the last increase, and are there any pending special assessments or reserve-fund shortfalls?
- Why hasn't it sold? Are there any deal-killer items the seller is aware of (foundation, flood, title, zoning, code violations)?
- Is there a deadline driving the sale (1031 exchange, divorce, estate, relocation)? That informs how much negotiation room exists.
- Crime grade is F in this area — have there been break-ins, vandalism, or insurance claims at this property in the last 3 years? What carrier currently insures it and at what premium?
- What's the average days-on-market for RENTAL listings here right now (not sales)? A rising rental-DOM trend means longer vacancies and softer asking-rent achievability than the comps imply.
- What's the recent tenant-quality profile in this submarket — average credit score on applications, eviction rate, late-payment / NSF rate, and stable-employment percentage? A property-management company in the area should have these aggregated.
- How much new for-sale + rental construction is in the pipeline within 1–3 miles? Heavy new supply typically softens prices + rents 12–24 months out; constrained supply supports both.
Investment metrics
- 1% rule
- 1.47% ✓
- Cap rate
- 10.25%
- Cash-on-cash
- 14.12%
- DSCR
- 1.63
- GRM
- 5.7
CMA / ARV
- ARV (median comp)
- $121,348
- List price
- $105,000
- Delta
- -13.47%
- Verdict
- UNDERPRICED
- Comps
- 20 within 1.0 mi
Show comp detail 7 sales within ~0.75 mi
| Address | Dist | Beds/Ba | Sqft | Sold | Price | $/sf | Match |
|---|---|---|---|---|---|---|---|
| 11253 Calico Dr | 0.03mi | 3/2.0 | 1,340 (-1%) | 3mo | $133,000 | $99 | 92 |
| 11303 Calico Dr | 0.15mi | 2/2.0 (-1) | 1,344 (-1%) | 1mo | $95,000 | $71 | 84 |
| 11232 College Ave | 0.03mi | 3/2.0 | 1,286 (-5%) | 15mo | $180,000 | $140 | 75 |
| 11247 Calico Dr | 0.03mi | 3/2.5 | 1,424 (+5%) | 19mo | $135,000 | $95 | 74 |
| 3321 Bridge Manor Dr | 0.11mi | 3/2.0 | 1,356 (0%) | 23mo | $124,900 | $92 | 74 |
| 11231 Calico Dr | 0.02mi | 3/2.0 | 1,404 (+4%) | 23mo | $129,000 | $92 | 72 |
| 11260 College Ave | 0.06mi | 3/2.5 | 1,424 (+5%) | 22mo | $85,000 | $60 | 71 |
Match score weights: distance 35% · size 25% · config 20% · recency 20%. Top-matched comps best support the ARV.
Projected returns pro-forma
-3.0% appreciation · 7.33% rent growth · sell at horizon
- IRR
- 9.9%
- Equity multiple
- 1.41×
- Total profit
- $12,149
- Equity at exit
- $15,656
- IRR
- 22.7%
- Equity multiple
- 3.41×
- Total profit
- $70,903
- Equity at exit
- $9,078
Cash invested: $29,400 (down + closing). Projections, not guarantees.
Landlord ↔ Tenant lean methodology
- Overall (STATE)
- 81 Strongly Landlord-Friendly
- State Missouri
- 81 Strongly Landlord-Friendly · R+10
- County
- — inherits STATE
- City
- — inherits STATE
ZIP-level market 64137
- Rents YoY
- 7.3%
- Active inventory
- 58
- Price-to-rent
- 5.7×
Monthly cashflow live
- Estimated rent
- $1,543 high interval (Pro) →
- Mortgage (P&I)
- −$551
- Tax from tax record
- −$129 /mo · $1,548/yr
- Insurance
- −$44
- HOA
- −$150
- Vacancy / Maint / Mgmt
- −$324
- Net cashflow
- $346
Break-even live
Sensitivity live
| Price | -10% $405 | -5% $376 | +0% $346 | +5% $316 | +10% $286 |
|---|---|---|---|---|---|
| Rent | -10% $224 | -5% $285 | +0% $346 | +5% $407 | +10% $468 |
| Rate | -1.0pp $399 | -0.5pp $373 | base $346 | +0.5pp $319 | +1.0pp $291 |
UW: 25.0% down · 7.5% · 30yr · 1.5% tax · 5.0% vac · 8.0% maint · 8.0% mgmt
Financing live
Cash to close
- Down payment
- $26,250
- Closing costs
- $3,150
- Reserves months
- —
- Total cash needed
- —
Loan-product check · same deal, 3 products live
Conventional
25% down · 7.5% · 30yr
- Down + closing
- —
- Monthly P&I
- —
- Monthly cashflow
- —
- DSCR
- —
- Eligible?
- —
Personal DTI + credit; lowest rate.
DSCR
20% down · 8.5% · 30yr
- Down + closing
- —
- Monthly P&I
- —
- Monthly cashflow
- —
- DSCR
- —
- Eligible?
- —
No personal income docs; deal must DSCR.
Hard money
10% down · 12.0% · 12mo
- Down + closing
- —
- Monthly P&I
- —
- Monthly cashflow
- —
- DSCR
- —
- Eligible?
- —
Short-term bridge; refi at stabilization.
Rent comps 10 comps
| Address | Beds | Baths | Sqft | Rent | $/sqft | DOM | Units | Dist |
|---|---|---|---|---|---|---|---|---|
| 11247 Calico Dr Kansas City, MO | 3.0 | 2.5 | 1424 | $1,625 | $1.14 | 45d | 1 | 0.07mi |
| 11255 Calico Dr Kansas City, MO | 3.0 | 1.5 | 1424 | $1,675 | $1.18 | 45d | 1 | 0.09mi |
| 11314 Indiana Ave Kansas City, MO | 3.0 | 1.5 | 988 | $1,500 | $1.52 | 45d | 1 | 0.18mi |
| 3311 E Red Bridge Rd Kansas City, MO | 1.0–2.0 | 1.0–2.0 | 975 | $1,295 | $1.33 | 4d | 19 | 0.18mi |
| 3333 E 113 Ter Unit A Kansas City, MO | 2.0 | 1.0 | 891 | $1,050 | $1.18 | 25d | 1 | 0.20mi |
| 3341 E 113 Ter Unit A Kansas City, MO | 2.0 | 1.0 | 891 | $1,050 | $1.18 | 25d | 1 | 0.22mi |
| 3347 E 113 Ter Unit A Kansas City, MO | 2.0 | 1.0 | 891 | $1,050 | $1.18 | 25d | 1 | 0.23mi |
| 11311 Bales Ave Kansas City, MO | 3.0 | 2.0 | 1150 | $1,400 | $1.22 | 25d | 1 | 0.23mi |
| 11026 College Ln Kansas City, MO | 1.0–2.0 | 1.0–1.5 | 754 | $1,235 | $1.64 | 4d | 7 | 0.25mi |
| 11206 Norby Rd Kansas City, MO | 3.0 | 1.0 | 1025 | $1,375 | $1.34 | 25d | 1 | 0.95mi |
HOA detail
- Monthly dues
- $150 · $1,800/yr
Listing history 11 events
-
2026-03-24$105,000 Active 386-char remark
Show marketing remark (386 chars)
Turnkey investment opportunity in Kansas City! This townhouse features 3 generous bedrooms and 1 full and 2 half bathrooms. It sits on a quiet street with a tenant already in place — no waiting for cash flow from day one. It features a full unfinished basement which could be finished for even more space! This property is being sold as part of a 6 home package. Please see MLS#'s
-
2021-12-15soldstatus
-
2021-11-22soldstatus Closed 176-char remark
Show marketing remark (176 chars)
Nice 3-bedroom town-home, like new paint, flooring and appliances. Full basement could be finished for even more space! Walk to IHOP. Close to I-435, 49-Hwy (formally 71-hwy).
-
2021-10-12status Pending 176-char remark
Show marketing remark (176 chars)
Nice 3-bedroom town-home, like new paint, flooring and appliances. Full basement could be finished for even more space! Walk to IHOP. Close to I-435, 49-Hwy (formally 71-hwy).
-
2021-10-02$89,500 Active 176-char remark
Show marketing remark (176 chars)
Nice 3-bedroom town-home, like new paint, flooring and appliances. Full basement could be finished for even more space! Walk to IHOP. Close to I-435, 49-Hwy (formally 71-hwy).
-
2019-06-07soldstatus
-
2019-05-28soldstatus Sold
-
2019-03-10status Pending
-
2019-02-26$69,500 Active
-
2008-02-20soldstatus
-
1995-06-13soldstatus
ⓘ Source: listings_history table (triggers on properties + properties_extension) + one-shot
backfill from property_details.listing_events for pre-trigger history.
Tax reassessment forecast MO · Resets to sale price
- Current annual tax
- $1,548 · $129/mo
- Projected year-2 tax
- $1,548 · $129/mo
- Expected delta
- $0/yr ($0/mo · 0.0%)
ⓘ Screening estimate from a state-policy table — verify with the county assessor before closing.
Climate risk First Street
- Flood 1/10 Low FEMA zone X (unshaded) · 0% chance over 30 yrs
- Wildfire 3/10 Moderate
- Heat 4/10 Moderate 7 d/yr ≥106°F today · 17 d/yr by 30 yrs out
- Wind 2/10 Low
- Air quality 3/10 Moderate 3 unhealthy d/yr today · 3 by 30 yrs out
Nearby sold comps map
Loading sold comps map…
Walkable amenities ~0.75 mi
Loading nearby amenities…
Taxation est. · year 1
- Rental income
- $18,522
- − Mortgage interest
- −$5,882
- − Property taxes
- −$1,548
- − Insurance
- −$525
- − Repairs & maintenance
- −$1,482
- − Management
- −$1,482
- − HOA
- −$1,800
- − Depreciation
- −$3,055
- Taxable income
- $2,749
- Est. tax owed @ 24.0%
- −$660
- After-tax cash flow
- $3,491/yr
For passive investors: Depreciation is non-cash, so a rental often shows a tax loss while cash-flowing — sheltering income. Rental losses are passive: they offset passive income freely, and up to $25,000/yr can offset ordinary (W-2) income if you actively participate and your MAGI is under $100k (phasing out to $0 by $150k); unused losses carry forward. On sale, claimed depreciation is recaptured at up to 25%, and gains may owe capital-gains tax (a 1031 exchange can defer both). Figures are a year-1 estimate at your 24.0% rate — not tax advice; consult a CPA.
Schools (NCES district)
- District
- Hickman Mills C-1
- NCES district ID
- 2914340
- Math proficiency
- 8% ▼ -8.00%
- Reading proficiency
- 18% ▼ -4.00%
- Median HH income
- $40,908
- Composite
- 11.2/100
- National rank
- #9725
- State rank
- #314 of 324 in MO
Livability — Kansas City
- Score
- 78/100
- State rank
- #28
- US rank
- #2671
Category grades
Schools grade is shown separately in the Schools card above.
Census & demographics
- Census place
- Kansas City, MO
- County
- Jackson County · 687,798 people
- City population
- 439,467
- Metro
- Kansas City, MO-KS
- Population (ZIP)
- 9,422
- Household income
- $66,036
- Rent vs Own
- Severe rent burden
- 356.0
Population outlook (Jackson County) Hauer SSP2
- Today (2025)
- 719,589 people
- By 2030
- 731,456 · +1.6%
- By 2040
- 746,689 · +3.8%
- By 2050
- 749,289 · +4.1%
- By 2075
- 736,227 · +2.3%
- By 2100
- 668,210 · -7.1%
Race, ethnicity, and origin ACS 2023
- Neighborhood character
- Majority White (64%)
- Race & ethnicity
- White 64% Black 23% Two or more races 7% Hispanic / Latino 5% Asian 3%
- Hispanic origin (detail)
- Mexican 3%
- Common ancestry
- Portuguese 5% Italian 3% Romanian 2%
- Foreign-born
- 9% · Canada, South Korea
- Languages at home
- 88% English-only · Spanish 3% Arabic 3% French/Haitian/Cajun 1%
Political lean MEDSL · Jackson
- 2024 margin
- D (+19.3) · D 58.9% · R 39.5% · Other 1.6%
- 2008→2024 swing
- -6.1pp toward R · 2008: 25.4pp · 2024: 19.3pp
- All cycles
- 2024: D+19.3 2020: D+22.0 2016: D+16.6 2012: D+19.0 2008: D+25.4
Not yet ingested
- Civics
- —
Market trends
- HPI YoY
- ▼ -145.45%
- Current HPI
- 255.0556
- Rent YoY
- ▲ 7.33%
- Metro
- Kansas City, MO-KS
- State GDP YoY
- ▲ 1.84%
- F500 in state
- 20
Industry mix (Fortune 500 HQ in MO)
| Industry | F500 HQs | Revenue |
|---|---|---|
| Healthcare | 1 | $163B |
|
||
| Insurance | 1 | $21B |
|
||
| Industrial Technology | 1 | $17B |
|
||
| Retail | 1 | $16B |
|
||
| Industrial Distribution | 1 | $10B |
|
||
| Utilities | 1 | $9B |
|
||
Price history
+51.1% since first listed11 events — show timeline
- 2026-03-24 Listed $105,000 Heartland MLS as Distributed by MLS Grid
- 2021-12-15 Sold (Public Records) — Public Records
- 2021-11-22 Sold (MLS) — Heartland MLS as Distributed by MLS Grid
- 2021-10-12 Pending — Heartland MLS as Distributed by MLS Grid
- 2021-10-02 Listed $89,500 Heartland MLS as Distributed by MLS Grid
- 2019-06-07 Sold (Public Records) — Public Records
- 2019-05-28 Sold (MLS) — Heartland MLS as Distributed by MLS Grid
- 2019-03-10 Pending — Heartland MLS as Distributed by MLS Grid
- 2019-02-26 Listed $69,500 Heartland MLS as Distributed by MLS Grid
- 2008-02-20 Sold (Public Records) — Public Records
- 1995-06-13 Sold (Public Records) — Public Records
Property tax history
+4.7%/yrLatest (2025): $1,548 · +18.3% YoY. Source: county tax records.
Cash-flow waterfall
monthlySold comps — $/sqft
last 12 mo · ≤1 miLoading sold comps…