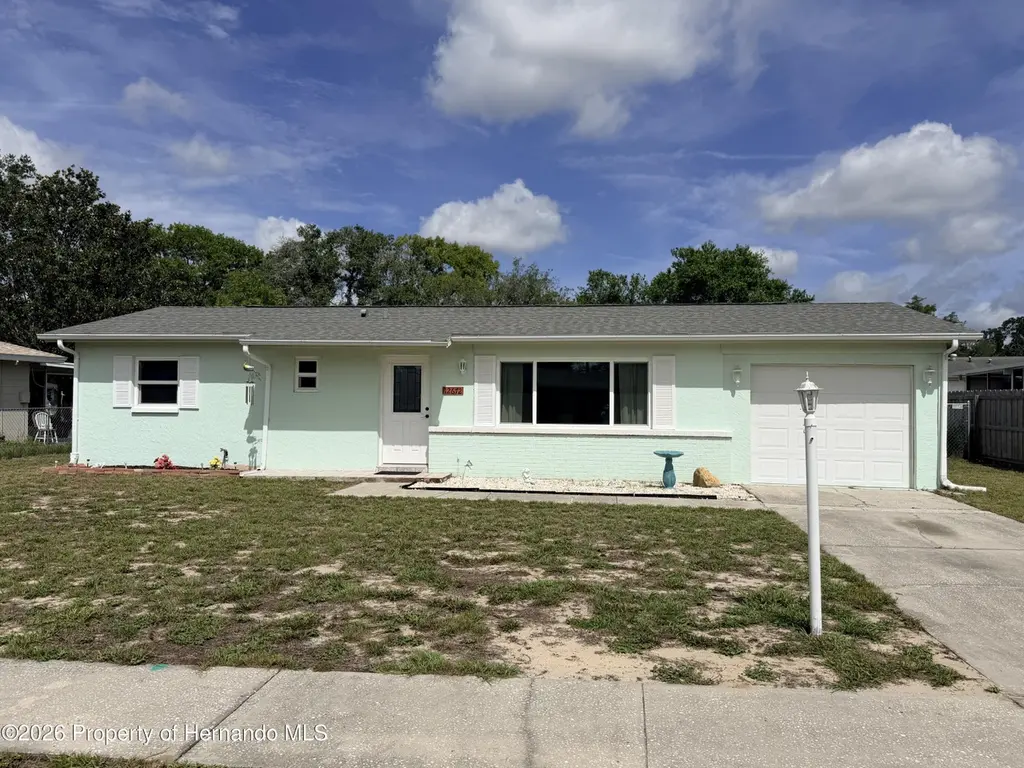
12672 Eddington Rd · Spring Hill, FL
Flood risk 6/10 · Moderate
- FEMA flood zone
- X (unshaded)
- Chance of flooding over 30 yrs
- 0.74%
- Est. flood insurance / yr
- $507 – $1,088
Fire risk 4/10 · Minor
- Est. fire insurance / yr
- $947 – $1,759
Heat risk 9/10 · Severe
- Hot days now (above 110°F)
- 5 days/yr
- Hot days in 30 yrs
- 16 days/yr
Wind risk 9/10 · Severe
- Chance of severe wind over 30 yrs
- 99.0%
Air-quality risk 2/10 · Minimal
- Unhealthy air days now
- 2 days/yr
- Unhealthy air days in 30 yrs
- 2 days/yr
Risk factors via First Street. Map © Google.
Why this score? — see what drove the D grade
The composite is a weighted blend of 9 inputs, each scored 0–100. Each bar is that input's sub-score; the figure is the points it added to the 100-point composite (weight × sub-score).
- Cash flow +13.5/30.0
- ARV discount +10.1/15.0
- Schools +4.2/10.0
- DSCR +4.1/10.0
- 1% rule +3.5/10.0
- Livability +3.2/5.0
- Condition / age +2.5/5.0
- Rent growth +1.3/5.0
- Appreciation +0.0/10.0
$199,900
🖨 Deal sheet (PDF) 📄 Offer letter ✓ Due diligence
Listing remarks MLS
This 2 Bedroom 1 and half Bath Home is the PERFECT STARTER OR RETIREMENT HOME ALSO FOR INVESTSMENT. Ceramic Tile Floors in Living Room, Dining Room and Kitchen. Screened in Porch with Ceramic Tile Floor. Large Fully Fenced in Back Yard. A BONUS ROOM for a Den or Office. Storage Shed. Needs TLC.
Key facts
- Updated kitchen
- Upgraded windows
- New roof
Tags
Property features AI
Exterior
- Parking: Attached garage; Garage door opener; 1 garage space
- Utilities: Public water; Public sewer; Electricity connected; Cable available; Water connected; Sewer connected
- Home design: Single family residence; One story
- Construction: Block construction; Shingle roof
- Exterior features: Screened porch/patio; Chain link fence; Shed(s); Few trees; Asphalt road frontage on a county road
Interior
- Kitchen: Dishwasher; Electric range; Microwave; Refrigerator
- Flooring: Tile
- Bathrooms: 1 full bathroom; 1 half bathroom
- Heating & cooling: Central heating; Central air; Ceiling fan(s)
- Interior features: Ceiling fan(s)
- Laundry & utility: In-unit laundry; Washer; Dryer
Neighborhood map
What this means for you Summary
Snapshot
- This is a 2-bed/2.0-bath single-family listed at $200k.
Deal economics
- At list price, monthly cash flow is $8 ($101/yr) — positive.
- The deal already cash-flows at list — no discount required.
- To meet the 1% rule (rent ≥ 1% of price), the offer needs to be $170k (15.0% below list).
- Recommended offer: $170k (15.0% below list) — sets the bar for 1% rule.
- Cap rate 6.3% vs local median 4.4% in Spring Hill — top-decile yield for the area; either an underpriced asset or a hidden risk that comps aren't pricing in. Stress-test before assuming the spread holds.
Location & tenants
- Location reads 63/100 on livability (#738 in FL) — a middle-class / working-renter tenant base. Strengths: cost of living A+, housing A+; Watch: health & safety C-, employment D+, amenities F.
- Hernando (suburban): math 50% / reading 50% proficiency, ranked #38 of 73 in FL (top 52%) — acceptable for families but not a draw, mixed tenant base, ~2y average lease.
- Zoned schools: Spring Hill Elementary School (math 50% / reading 51%, grade D+, #1,055 of 2,144 statewide, top 50%, 893 students, 68% FRL); West Hernando Middle School (math 36% / reading 37%, grade F, #405 of 571 statewide, top 72%, 695 students, 58% FRL); Central High School (math 34% / reading 44%, grade F, #312 of 667 statewide, top 48%, 1,426 students, 53% FRL) — zoned schools at 60% FRL track the district average.
- Market conditions: Rents falling (-4.8%/yr); 741 active listings in the ZIP; 4 comparable units currently listed for rent nearby; rentals at typical pace (median 26d on market — plan ~3-4 weeks tenant-placement turnaround); solid renter incomes; 2,505 units permitted in Hernando County in 2024 (318 in 5+ unit buildings).
Forward outlook
- Local home prices are declining (-3.0%/yr); year-one equity from $1k of loan paydown is wiped out by about $6k of value loss. Plan a longer hold.
- Hernando County population projected at +11% by 2050 — modest demand growth; plan on rents tracking national, not racing it.
Negotiation context
- It's been on market 21 days — a 2% lower offer ($197k) is reasonable based on typical stale-listing flexibility.
- 8 sale attempts since 23y ago with the ask held roughly flat each time — persistent listings suggest the price (not the market) is what's stuck; bring a comps-based counter.
- Current owner paid $82k; list at $200k implies a 145% gain — meaningful room to come down on a strong offer.
Risks & watch-outs
- Climate carrying-cost: major flood risk; severe wind risk, 99% chance of damaging wind over 30y; extreme-heat days projected 5→16/yr by 2055 (HVAC capex compounding) — expect insurance premiums to compound above CPI over the hold.
Questions for the listing agent
- Built in 1979 — when were the roof, HVAC, electrical panel, plumbing, and water heater last replaced?
- Is there a deadline driving the sale (1031 exchange, divorce, estate, relocation)? That informs how much negotiation room exists.
- The area grade is low — what's the realistic commute time and amenity access for the typical tenant pool here? Any planned neighborhood developments (good or bad) we should know about?
- What's the average days-on-market for RENTAL listings here right now (not sales)? A rising rental-DOM trend means longer vacancies and softer asking-rent achievability than the comps imply.
- What's the recent tenant-quality profile in this submarket — average credit score on applications, eviction rate, late-payment / NSF rate, and stable-employment percentage? A property-management company in the area should have these aggregated.
- How much new for-sale + rental construction is in the pipeline within 1–3 miles? Heavy new supply typically softens prices + rents 12–24 months out; constrained supply supports both.
Investment metrics
- 1% rule
- 0.85% ✗
- Cap rate
- 6.34%
- Cash-on-cash
- 0.18%
- DSCR
- 1.01
- GRM
- 9.8
CMA / ARV
- ARV (on-the-fly)
- $212,080
- Comps found
- 12
Show comp detail 12 sales within ~0.75 mi
| Address | Dist | Beds/Ba | Sqft | Sold | Price | $/sf | Match |
|---|---|---|---|---|---|---|---|
| 12468 Eddington Rd | 0.08mi | 2/1.5 | 850 (-3%) | 8mo | $209,000 | $246 | 82 |
| 12663 Eddington Rd | 0.03mi | 2/1.5 | 943 (+7%) | 10mo | $195,000 | $207 | 76 |
| 4451 Higate Rd | 0.29mi | 2/2.0 | 924 (+5%) | 14mo | $197,900 | $214 | 66 |
| 4505 Gondolier Rd | 0.45mi | 2/2.0 | 888 (+1%) | 23mo | $150,000 | $169 | 58 |
| 12349 Corrine Ave | 0.67mi | 2/1.5 | 943 (+7%) | 4mo | $227,500 | $241 | 51 |
| 5400 Mariner Blvd | 0.63mi | 2/1.0 | 966 (+10%) | 2mo | $195,000 | $202 | 48 |
| 5269 Mariner Blvd | 0.56mi | 3/2.0 (+1) | 1,008 (+14%) | 1mo | $245,000 | $243 | 43 |
| 5405 Mariner Blvd | 0.66mi | 3/1.5 (+1) | 943 (+7%) | 11mo | $202,000 | $214 | 41 |
| 5342 Landover Blvd | 0.48mi | 3/2.0 (+1) | 1,008 (+14%) | 17mo | $255,000 | $253 | 35 |
| 5346 Mariner Blvd | 0.59mi | 2/2.0 | 1,003 (+14%) | 18mo | $205,000 | $204 | 34 |
| 5247 Landover Blvd | 0.41mi | 3/2.0 (+1) | 1,008 (+14%) | 23mo | $259,900 | $258 | 32 |
| 5358 Landover Blvd | 0.49mi | 3/2.0 (+1) | 1,008 (+14%) | 22mo | $257,000 | $255 | 30 |
Match score weights: distance 35% · size 25% · config 20% · recency 20%. Top-matched comps best support the ARV.
Projected returns pro-forma
-3.0% appreciation · 0.0% rent growth · sell at horizon
- IRR
- -19.3%
- Equity multiple
- 0.34×
- Total profit
- $-36,838
- Equity at exit
- $29,806
- IRR
- -19.6%
- Equity multiple
- 0.10×
- Total profit
- $-50,640
- Equity at exit
- $17,284
Cash invested: $55,972 (down + closing). Projections, not guarantees.
Landlord ↔ Tenant lean methodology
- Overall (STATE)
- 87 Strongly Landlord-Friendly
- State Florida
- 87 Strongly Landlord-Friendly · R+3
- County
- — inherits STATE
- City
- — inherits STATE
ZIP-level market 34609
- Home prices YoY
- -23.2%
- Rents YoY
- -4.8%
- Active inventory
- 741
- Price-to-rent
- 9.8×
Monthly cashflow live
- Estimated rent
- $1,698 medium interval (Pro) →
- Mortgage (P&I)
- −$1,048
- Tax from tax record
- −$202 /mo · $2,420/yr
- Insurance
- −$83
- HOA
- −$0
- Vacancy / Maint / Mgmt
- −$357
- Net cashflow
- $8
Break-even live
Sensitivity live
| Price | -10% $122 | -5% $65 | +0% $8 | +5% $-48 | +10% $-105 |
|---|---|---|---|---|---|
| Rent | -10% $-126 | -5% $-59 | +0% $8 | +5% $75 | +10% $143 |
| Rate | -1.0pp $109 | -0.5pp $59 | base $8 | +0.5pp $-43 | +1.0pp $-96 |
UW: 25.0% down · 7.5% · 30yr · 1.5% tax · 5.0% vac · 8.0% maint · 8.0% mgmt
Financing live
Cash to close
- Down payment
- $49,975
- Closing costs
- $5,997
- Reserves months
- —
- Total cash needed
- —
Loan-product check · same deal, 3 products live
Conventional
25% down · 7.5% · 30yr
- Down + closing
- —
- Monthly P&I
- —
- Monthly cashflow
- —
- DSCR
- —
- Eligible?
- —
Personal DTI + credit; lowest rate.
DSCR
20% down · 8.5% · 30yr
- Down + closing
- —
- Monthly P&I
- —
- Monthly cashflow
- —
- DSCR
- —
- Eligible?
- —
No personal income docs; deal must DSCR.
Hard money
10% down · 12.0% · 12mo
- Down + closing
- —
- Monthly P&I
- —
- Monthly cashflow
- —
- DSCR
- —
- Eligible?
- —
Short-term bridge; refi at stabilization.
Rent comps 4 comps
| Address | Beds | Baths | Sqft | Rent | $/sqft | DOM | Units | Dist |
|---|---|---|---|---|---|---|---|---|
| 4503 Higate Rd Spring Hill, FL | 2.0 | 2.0 | 1025 | $1,495 | $1.46 | 25d | 1 | 0.24mi |
| 4518 Yorkshire Ave Spring Hill, FL | 2.0 | 1.5 | 1119 | $1,600 | $1.43 | 25d | 1 | 0.26mi |
| 12454 Seagate St Spring Hill, FL | 3.0 | 2.0 | 1114 | $1,735 | $1.56 | 25d | 1 | 0.78mi |
| 5294 Fairhaven Ave Spring Hill, FL | 2.0 | 2.0 | 1105 | $1,600 | $1.45 | 25d | 1 | 1.06mi |
Listing history 15 events
-
2026-06-21statusdays on market $199,900 Pending 21 DOM
-
2026-06-18days on market $199,900 Active 20 DOM
-
2026-06-17days on market $199,900 Active 19 DOM
-
2026-06-16days on market $199,900 Active 18 DOM
-
2026-06-15days on market $199,900 Active 17 DOM
-
2026-06-13days on market $199,900 Active 15 DOM
-
2026-06-13pricedays on market $199,900 Active 14 DOM
-
2026-06-09days on market $202,900 Active 11 DOM
-
2026-06-08days on market $202,900 Active 10 DOM
-
2026-06-07days on market $202,900 Active 9 DOM
-
2026-06-04days on market $202,900 Active 6 DOM
-
2026-06-03days on market $202,900 Active 5 DOM
-
2026-06-02days on market $202,900 Active 4 DOM
-
2026-06-01days on market $202,900 Active 3 DOM
-
2026-05-31days on market $202,900 Active 2 DOM
ⓘ Source: listings_history table (triggers on properties + properties_extension) + one-shot
backfill from property_details.listing_events for pre-trigger history.
Tax reassessment forecast FL · Resets to sale price
- Current annual tax
- $2,420 · $202/mo
- Projected year-2 tax
- $2,420 · $202/mo
- Expected delta
- $0/yr ($0/mo · 0.0%)
ⓘ Screening estimate from a state-policy table — verify with the county assessor before closing.
Climate risk First Street
- Flood 6/10 Major FEMA zone X (unshaded) · 74% chance over 30 yrs
- Wildfire 4/10 Moderate
- Heat 9/10 Extreme 5 d/yr ≥110°F today · 16 d/yr by 30 yrs out
- Wind 9/10 Extreme 99% chance of damaging wind over 30 yrs
- Air quality 2/10 Low 2 unhealthy d/yr today · 2 by 30 yrs out
Nearby sold comps map
Loading sold comps map…
Walkable amenities ~0.75 mi
Loading nearby amenities…
Taxation est. · year 1
- Rental income
- $20,380
- − Mortgage interest
- −$11,198
- − Property taxes
- −$2,420
- − Insurance
- −$1,000
- − Repairs & maintenance
- −$1,630
- − Management
- −$1,630
- − Depreciation
- −$5,815
- Taxable loss
- −$3,313
- Est. tax savings @ 24.0%
- +$795
- After-tax cash flow
- $896/yr
For passive investors: Depreciation is non-cash, so a rental often shows a tax loss while cash-flowing — sheltering income. Rental losses are passive: they offset passive income freely, and up to $25,000/yr can offset ordinary (W-2) income if you actively participate and your MAGI is under $100k (phasing out to $0 by $150k); unused losses carry forward. On sale, claimed depreciation is recaptured at up to 25%, and gains may owe capital-gains tax (a 1031 exchange can defer both). Figures are a year-1 estimate at your 24.0% rate — not tax advice; consult a CPA.
Schools (NCES district)
- District
- Hernando
- NCES district ID
- 1200810
- Math proficiency
- 50% ▼ -8.00%
- Reading proficiency
- 50% ▼ -4.00%
- Median HH income
- $41,985
- Composite
- 42.03/100
- National rank
- #3329
- State rank
- #38 of 73 in FL
Livability — Spring Hill
- Score
- 63/100
- State rank
- #738
- US rank
- #15937
Category grades
Schools grade is shown separately in the Schools card above.
Census & demographics
- Census place
- Spring Hill, FL
- County
- Hernando County · 169,677 people
- City population
- 83,915
- Metro
- Tampa-St. Petersburg-Clearwater, FL
- Population (ZIP)
- 47,257
- Household income
- $79,442
- Rent vs Own
- Severe rent burden
- 663.0
Population outlook (Hernando County) Hauer SSP2
- Today (2025)
- 189,218 people
- By 2030
- 194,367 · +2.7%
- By 2040
- 203,398 · +7.5%
- By 2050
- 209,589 · +10.8%
- By 2075
- 218,452 · +15.4%
- By 2100
- 205,923 · +8.8%
Race, ethnicity, and origin ACS 2023
- Neighborhood character
- Predominantly White (65%)
- Race & ethnicity
- White 65% Hispanic / Latino 22% Two or more races 13% Black 6% Asian 3%
- Hispanic origin (detail)
- Mexican 2% Puerto Rican 12% Cuban 3%
- Common ancestry
- Romanian 4% Lithuanian 2% Slovak 1%
- Foreign-born
- 11% · Canada, Jamaica, Philippines
- Languages at home
- 81% English-only · Spanish 15% Other Asian/Pacific 1% Other Indo-European 1%
Political lean MEDSL · Hernando
- 2024 margin
- Solid R (+37.0) · D 31.1% · R 68.2%
- 2008→2024 swing
- -33.5pp toward R · 2008: -3.6pp · 2024: -37.0pp
- All cycles
- 2024: R+37.0 2020: R+30.2 2016: R+29.0 2012: R+8.5 2008: R+3.6
Not yet ingested
- Civics
- —
Market trends
- HPI YoY
- ▼ -86.49%
- Current HPI
- 286.5885
- Rent YoY
- ▼ -4.82%
- Metro
- Tampa-St. Petersburg-Clearwater, FL
- State GDP YoY
- ▲ 3.28%
- F500 in state
- 36
Industry mix (Fortune 500 HQ in FL)
| Industry | F500 HQs | Revenue |
|---|---|---|
| Industrial Technology | 2 | $29B |
|
||
| Insurance | 2 | $17B |
|
||
| Retail | 1 | $60B |
|
||
| Technology Distribution | 1 | $58B |
|
||
| Homebuilding | 1 | $35B |
|
||
| Technology Manufacturing | 1 | $35B |
|
||
Price history
+427.0% since first listed20 events — show timeline
- 2026-05-29 Listed $202,900 HCAR
- 2019-04-02 Sold (Public Records) $81,500 Public Records
- 2019-03-29 Sold (MLS) $81,500 St. Augustine and St. Johns County Board of REALTORS®
- 2019-03-29 Sold (MLS) $81,500 HCAR
- 2018-12-03 Listed $85,900 St. Augustine and St. Johns County Board of REALTORS®
- 2018-12-03 Listed $85,900 HCAR
- 2013-07-12 Sold (MLS) $33,000 HCAR
- 2013-07-12 Sold (MLS) $33,000 St. Augustine and St. Johns County Board of REALTORS®
- 2011-05-02 Listed $34,900 HCAR
- 2011-05-02 Listed $34,900 St. Augustine and St. Johns County Board of REALTORS®
- 2007-06-15 Sold (Public Records) $112,000 Public Records
- 2007-06-13 Sold (MLS) $112,000 HCAR
- 2006-11-01 Listed $110,000 HCAR
- 2004-04-14 Sold (Public Records) $80,000 Public Records
- 2004-03-31 Sold (MLS) $80,000 HCAR
- 2004-02-10 Listed $78,500 HCAR
- 2003-05-23 Sold (Public Records) $54,000 Public Records
- 2003-03-21 Listed $58,900 HCAR
- 1999-04-20 Sold (Public Records) $43,100 Public Records
- 1996-08-07 Sold (Public Records) $38,500 Public Records
Property tax history
+10.5%/yrLatest (2025): $2,420 · +2.7% YoY. Source: county tax records.
Cash-flow waterfall
monthlySold comps — $/sqft
last 12 mo · ≤1 miLoading sold comps…