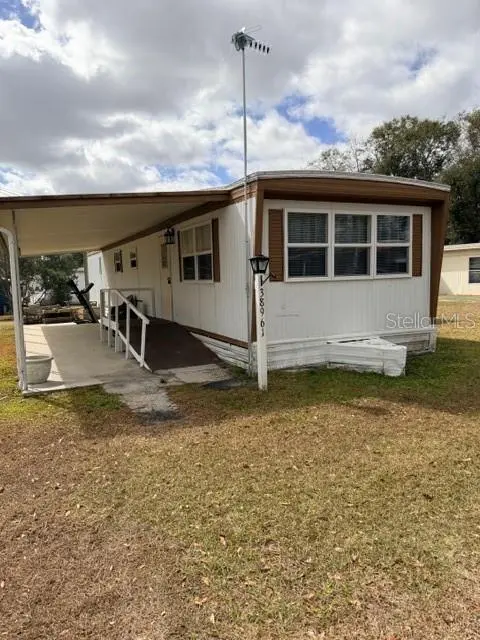
38961 Stapley Cir · Zephyrhills, FL
Flood risk 1/10 · Minimal
- FEMA flood zone
- X (unshaded)
- Chance of flooding over 30 yrs
- 0.0%
- Est. flood insurance / yr
- $507 – $1,088
Fire risk 2/10 · Minimal
- Est. fire insurance / yr
- $947 – $1,759
Heat risk 9/10 · Severe
- Hot days now (above 108°F)
- 7 days/yr
- Hot days in 30 yrs
- 23 days/yr
Wind risk 9/10 · Severe
- Chance of severe wind over 30 yrs
- 99.0%
Air-quality risk 2/10 · Minimal
- Unhealthy air days now
- 1 days/yr
- Unhealthy air days in 30 yrs
- 1 days/yr
Risk factors via First Street. Map © Google.
Why this score? — see what drove the B- grade
The composite is a weighted blend of 9 inputs, each scored 0–100. Each bar is that input's sub-score; the figure is the points it added to the 100-point composite (weight × sub-score).
- Cash flow +29.5/30.0
- DSCR +10.0/10.0
- 1% rule +8.4/10.0
- ARV discount +8.2/15.0
- Schools +4.3/10.0
- Livability +3.6/5.0
- Rent growth +2.5/5.0
- Condition / age +2.5/5.0
- Appreciation +0.0/10.0
$78,000
🖨 Deal sheet 📄 Offer letter ✓ Due diligence
Listing remarks
Affordability is on all of our minds, and this home is perfect to call your new home. This is close to all the restaurants, shopping, and medical resources in the area. This 2 bedroom 1 bath is in solid condition. It is part of an HOA, but a very low annual fee. There is a carport for parking out of the elements. Schedule an appointment today!!
Key facts
- Close to restaurants
- Carport for parking
- Close to shopping
Tags
Property features AI
Finance
- Other: Furnished; No lease restrictions indicated
- HOA & community: Has HOA (annual fee $425; $35.42 monthly); Association approval not required; Pets allowed; Senior community
Exterior
- Parking: Carport (1 space)
- Utilities: Public sewer; Water connected; Cable available; Broadband/high-speed internet available
- Home design: Residential mobile home (single wide); One story; Faces north; Entry level: One
- Construction: Other construction materials; Other roof; Other foundation
- Exterior features: Other exterior features; Asphalt road access
Interior
- Kitchen: Microwave; Range; Refrigerator
- Bedrooms: 2 bedrooms
- Flooring: Carpet
- Bathrooms: 1 full bathroom
- Heating & cooling: Central heating; Central air conditioning
- Interior features: Thermostat; 4 total rooms
- Laundry & utility: No laundry features listed
Neighborhood map
What this means for you Summary
Snapshot
- This is a 2-bed/2.0-bath manufactured listed at $78k.
Deal economics
- At list price, monthly cash flow is $280 ($3k/yr) — positive.
- The deal already cash-flows at list — no discount required.
- Meets the 1% rule at list price ($1k rent vs $78k).
- Recommended offer: $73k (6.0% below list) — sets the bar for market timing.
- Cap rate 10.6% vs local median 3.7% in Zephyrhills — top-decile yield for the area; either an underpriced asset or a hidden risk that comps aren't pricing in. Stress-test before assuming the spread holds.
Location & tenants
- Location reads 72/100 on livability (#330 in FL) — a middle-class / working-renter tenant base. Strengths: cost of living A+, housing A+, health & safety A; Watch: schools C-, crime C-, amenities F.
- Pasco (suburban): math 50% / reading 52% proficiency, ranked #32 of 73 in FL (top 44%) — acceptable for families but not a draw, mixed tenant base, ~2y average lease.
- Market conditions: 235 active listings in the ZIP; 6 comparable units currently listed for rent nearby; rentals at typical pace (median 24d on market — plan ~3-4 weeks tenant-placement turnaround); 6,765 units permitted in Pasco County in 2024 (1,250 in 5+ unit buildings).
Forward outlook
- Local home prices are declining (-3.0%/yr); year-one equity from $539 of loan paydown is wiped out by about $2k of value loss. Plan a longer hold.
- Pasco County population projected at +29% by 2050 — long-run rental-demand tailwind backs the buy-and-hold thesis.
- At projected returns (-3.0% appreciation + 3.0% rent growth), your $22k cash investment doubles in ~8 years — after that, you're playing with house money.
Negotiation context
- It's been on market 80 days — a 6% lower offer ($73k) is reasonable based on typical stale-listing flexibility.
- 3 sale attempts since 17y ago with the ask held roughly flat each time — persistent listings suggest the price (not the market) is what's stuck; bring a comps-based counter.
- Current owner paid $45k; list at $78k implies a 73% gain — meaningful room to come down on a strong offer.
Risks & watch-outs
- Climate carrying-cost: severe wind risk, 99% chance of damaging wind over 30y; extreme-heat days projected 7→23/yr by 2055 (HVAC capex compounding) — expect insurance premiums to compound above CPI over the hold.
Questions for the listing agent
- It's been on market 80 days. Have you received any prior offers? Is the seller open to a 6% concession, seller financing, or rate buy-down credit?
- Built in 1972 — when were the roof, HVAC, electrical panel, plumbing, and water heater last replaced?
- What does the HOA fee cover, when was the last increase, and are there any pending special assessments or reserve-fund shortfalls?
- Why hasn't it sold? Are there any deal-killer items the seller is aware of (foundation, flood, title, zoning, code violations)?
- Is there a deadline driving the sale (1031 exchange, divorce, estate, relocation)? That informs how much negotiation room exists.
- What's the average days-on-market for RENTAL listings here right now (not sales)? A rising rental-DOM trend means longer vacancies and softer asking-rent achievability than the comps imply.
- What's the recent tenant-quality profile in this submarket — average credit score on applications, eviction rate, late-payment / NSF rate, and stable-employment percentage? A property-management company in the area should have these aggregated.
- How much new for-sale + rental construction is in the pipeline within 1–3 miles? Heavy new supply typically softens prices + rents 12–24 months out; constrained supply supports both.
Investment metrics
- 1% rule
- 1.34% ✓
- Cap rate
- 10.59%
- Cash-on-cash
- 15.36%
- DSCR
- 1.68
- GRM
- 6.2
CMA / ARV
- ARV (on-the-fly)
- $79,200
- Comps found
- 12
Show comp detail 12 sales within ~0.75 mi
| Address | Dist | Beds/Ba | Sqft | Sold | Price | $/sf | Match |
|---|---|---|---|---|---|---|---|
| 38988 Stapley Cir | 0.08mi | 2/1.5 | 672 (-7%) | 5mo | $50,000 | $74 | 79 |
| 38533 Ethel Ave | 0.40mi | 2/1.0 | 720 (0%) | 1mo | $69,900 | $97 | 76 |
| 39136 Flora Ave | 0.61mi | 2/2.0 | 720 (0%) | 2mo | $66,500 | $92 | 70 |
| 38721 Granger Ln | 0.49mi | 2/2.0 | 736 (+2%) | 11mo | $145,000 | $197 | 64 |
| 39239 Longview Ave | 0.61mi | 2/1.0 | 756 (+5%) | 1mo | $127,000 | $168 | 58 |
| 39053 Flora Ave | 0.56mi | 2/1.0 | 768 (+7%) | 1mo | $142,500 | $186 | 58 |
| 39045 Sabal Ave | 0.52mi | 2/1.5 | 744 (+3%) | 14mo | $85,000 | $114 | 56 |
| 38641 Lansing Ave | 0.65mi | 2/1.0 | 672 (-7%) | 2mo | $50,000 | $74 | 53 |
| 39253 Longview Ave | 0.63mi | 2/2.0 | 684 (-5%) | 13mo | $70,000 | $102 | 52 |
| 6423 Ohio St | 0.72mi | 2/1.5 | 684 (-5%) | 7mo | $75,000 | $110 | 50 |
| 38825 Inez Ave | 0.24mi | 2/1.0 | 616 (-14%) | 15mo | $145,000 | $235 | 48 |
| 38541 Windflower Ave | 0.64mi | 2/1.0 | 825 (+15%) | 4mo | $65,000 | $79 | 39 |
Match score weights: distance 35% · size 25% · config 20% · recency 20%. Top-matched comps best support the ARV.
Projected returns pro-forma
-3.0% appreciation · 3.0% rent growth · sell at horizon
- IRR
- 6.1%
- Equity multiple
- 1.24×
- Total profit
- $5,184
- Equity at exit
- $11,630
- IRR
- 15.5%
- Equity multiple
- 2.26×
- Total profit
- $27,523
- Equity at exit
- $6,744
Cash invested: $21,840 (down + closing). Projections, not guarantees.
Landlord ↔ Tenant lean methodology
- Overall (STATE)
- 87 Strongly Landlord-Friendly
- State Florida
- 87 Strongly Landlord-Friendly · R+3
- County
- — inherits STATE
- City
- — inherits STATE
ZIP-level market 33540
- Home prices YoY
- -3.0%
- Active inventory
- 235
- Price-to-rent
- 6.2×
Monthly cashflow live
- Estimated rent
- $1,048 high interval (Pro) →
- Mortgage (P&I)
- −$409
- Tax from tax record
- −$72 /mo · $859/yr
- Insurance
- −$32
- HOA
- −$35
- Vacancy / Maint / Mgmt
- −$220
- Net cashflow
- $280
Break-even live
UW: 25.0% down · 7.5% · 30yr · 1.5% tax · 5.0% vac · 8.0% maint · 8.0% mgmt
Financing live
Cash to close
- Down payment
- $19,500
- Closing costs
- $2,340
- Reserves months
- —
- Total cash needed
- —
Loan-product check · same deal, 3 products live
Conventional
25% down · 7.5% · 30yr
- Down + closing
- —
- Monthly P&I
- —
- Monthly cashflow
- —
- DSCR
- —
- Eligible?
- —
Personal DTI + credit; lowest rate.
DSCR
20% down · 8.5% · 30yr
- Down + closing
- —
- Monthly P&I
- —
- Monthly cashflow
- —
- DSCR
- —
- Eligible?
- —
No personal income docs; deal must DSCR.
Hard money
10% down · 12.0% · 12mo
- Down + closing
- —
- Monthly P&I
- —
- Monthly cashflow
- —
- DSCR
- —
- Eligible?
- —
Short-term bridge; refi at stabilization.
Rent comps 6 comps
| Address | Beds | Baths | Sqft | Rent | $/sqft | DOM | Units | Dist |
|---|---|---|---|---|---|---|---|---|
| 38706 Daughtery Rd Zephyrhills, FL | 1.0 | 1.0 | 445 | $974 | $2.19 | 16d | 2 | 0.23mi |
| 38748 Calumet Ave Zephyrhills, FL | 2.0 | 1.0 | 750 | $1,100 | $1.47 | 4d | 1 | 0.78mi |
| 39029 Kirkland Dr Zephyrhills, FL | 1.0 | 1.0 | 500 | $950 | $1.90 | 24d | 1 | 0.78mi |
| 38112 Townview Ave Zephyrhills, FL | 1.0 | 1.0 | 700 | $1,100 | $1.57 | 24d | 1 | 0.83mi |
| 8129 Cass Rd Zephyrhills, FL | 1.0 | 1.0 | 540 | $1,100 | $2.04 | 24d | 1 | 1.04mi |
| 6052 10th St Zephyrhills, FL | 2.0 | 1.0 | 644 | $1,200 | $1.86 | 24d | 1 | 1.15mi |
HOA detail
- Monthly dues
- $35 · $420/yr
Listing history 17 events
-
2026-06-18days on market $78,000 Active 80 DOM
-
2026-06-17days on market $78,000 Active 79 DOM
-
2026-06-16days on market $78,000 Active 78 DOM
-
2026-06-15days on market $78,000 Active 77 DOM
-
2026-06-13days on market $78,000 Active 75 DOM
-
2026-06-09days on market $78,000 Active 71 DOM
-
2026-06-08days on market $78,000 Active 70 DOM
-
2026-06-07days on market $78,000 Active 69 DOM
-
2026-06-04days on market $78,000 Active 66 DOM
-
2026-06-03days on market $78,000 Active 65 DOM
-
2026-06-02days on market $78,000 Active 64 DOM
-
2026-06-01days on market $78,000 Active 63 DOM
-
2026-05-31days on market $78,000 Active 62 DOM
-
2026-03-30$78,000 Active
-
2024-01-22soldstatus $45,000
-
2010-09-20$21,500
-
2009-06-09$25,900
ⓘ Source: listings_history table (triggers on properties + properties_extension) + one-shot
backfill from property_details.listing_events for pre-trigger history.
Tax reassessment forecast FL · Resets to sale price
- Current annual tax
- $859 · $72/mo
- Projected year-2 tax
- $859 · $72/mo
- Expected delta
- $0/yr ($0/mo · 0.0%)
ⓘ Screening estimate from a state-policy table — verify with the county assessor before closing.
Climate risk First Street
- Flood 1/10 Low FEMA zone X (unshaded) · 0% chance over 30 yrs
- Wildfire 2/10 Low
- Heat 9/10 Extreme 7 d/yr ≥108°F today · 23 d/yr by 30 yrs out
- Wind 9/10 Extreme 99% chance of damaging wind over 30 yrs
- Air quality 2/10 Low 1 unhealthy d/yr today · 1 by 30 yrs out
Nearby sold comps map
Loading sold comps map…
Walkable amenities ~0.75 mi
Loading nearby amenities…
Taxation est. · year 1
- Rental income
- $12,572
- − Mortgage interest
- −$4,369
- − Property taxes
- −$859
- − Insurance
- −$390
- − Repairs & maintenance
- −$1,006
- − Management
- −$1,006
- − HOA
- −$420
- − Depreciation
- −$2,269
- Taxable income
- $2,253
- Est. tax owed @ 24.0%
- −$541
- After-tax cash flow
- $2,813/yr
For passive investors: Depreciation is non-cash, so a rental often shows a tax loss while cash-flowing — sheltering income. Rental losses are passive: they offset passive income freely, and up to $25,000/yr can offset ordinary (W-2) income if you actively participate and your MAGI is under $100k (phasing out to $0 by $150k); unused losses carry forward. On sale, claimed depreciation is recaptured at up to 25%, and gains may owe capital-gains tax (a 1031 exchange can defer both). Figures are a year-1 estimate at your 24.0% rate — not tax advice; consult a CPA.
Schools (NCES district)
- District
- Pasco
- NCES district ID
- 1201530
- Math proficiency
- 50% ▼ -10.00%
- Reading proficiency
- 52% ▼ -5.00%
- Median HH income
- $45,039
- Composite
- 43.14/100
- National rank
- #3074
- State rank
- #32 of 73 in FL
Livability — Zephyrhills
- Score
- 72/100
- State rank
- #330
- US rank
- #5760
Category grades
Schools grade is shown separately in the Schools card above.
Census & demographics
- City population
- 48,266
- Population (ZIP)
- 11,098
Population outlook (Pasco County) Hauer SSP2
- Today (2025)
- 570,045 people
- By 2030
- 605,844 · +6.3%
- By 2040
- 674,806 · +18.4%
- By 2050
- 736,022 · +29.1%
- By 2075
- 862,900 · +51.4%
- By 2100
- 906,364 · +59.0%
Race, ethnicity, and origin ACS 2023
- Neighborhood character
- Predominantly White (77%)
- Race & ethnicity
- White 77% Hispanic / Latino 14% Two or more races 10% Black 3% Asian 1%
- Hispanic origin (detail)
- Mexican 2% Puerto Rican 8% Cuban 2%
- Common ancestry
- Lithuanian 4% Romanian 3% Italian 2%
- Foreign-born
- 11% · Canada, Vietnam
- Languages at home
- 87% English-only · Spanish 9% French/Haitian/Cajun 2% Other Indo-European 1%
Political lean MEDSL · Pasco
- 2024 margin
- Strong R (+25.2) · D 36.9% · R 62.1% · Other 1.0%
- 2008→2024 swing
- -21.6pp toward R · 2008: -3.6pp · 2024: -25.2pp
- All cycles
- 2024: R+25.2 2020: R+20.1 2016: R+21.6 2012: R+6.7 2008: R+3.6
Not yet ingested
- Civics
- —
Market trends
- HPI YoY
- ▼ -11.57%
- Current HPI
- 370.8747
- Rent YoY
- —
- Metro
- —
- State GDP YoY
- ▲ 3.28%
- F500 in state
- 36
Industry mix (Fortune 500 HQ in FL)
| Industry | F500 HQs | Revenue |
|---|---|---|
| Industrial Technology | 2 | $29B |
|
||
| Insurance | 2 | $17B |
|
||
| Retail | 1 | $60B |
|
||
| Technology Distribution | 1 | $58B |
|
||
| Homebuilding | 1 | $35B |
|
||
| Technology Manufacturing | 1 | $35B |
|
||
Price history
+201.2% since first listed4 events — show timeline
- 2026-03-30 Listed $78,000 Stellar MLS as Distributed by MLS Grid
- 2024-01-22 Sold (Public Records) $45,000 Public Records
- 2010-09-20 Listed $21,500 Stellar MLS as Distributed by MLS Grid
- 2009-06-09 Listed $25,900 Stellar MLS as Distributed by MLS Grid
Property tax history
+7.1%/yrLatest (2025): $859 · +24.9% YoY. Source: county tax records.
Cash-flow waterfall
monthlySold comps — $/sqft
last 12 mo · ≤1 miLoading sold comps…