1192 Wedgewood Dr NW · Atlanta, GA
Flood risk 1/10 · Minimal
- FEMA flood zone
- X (unshaded)
- Chance of flooding over 30 yrs
- 0.0%
- Est. flood insurance / yr
- $473 – $860
Fire risk 1/10 · Minimal
- Est. fire insurance / yr
- $963 – $1,789
Heat risk 5/10 · Moderate
- Hot days now (above 104°F)
- 7 days/yr
- Hot days in 30 yrs
- 16 days/yr
Wind risk 4/10 · Minor
- Chance of severe wind over 30 yrs
- 21.0%
Air-quality risk 4/10 · Minor
- Unhealthy air days now
- 3 days/yr
- Unhealthy air days in 30 yrs
- 5 days/yr
Risk factors via First Street. Map © Google.
Why this score? — see what drove the B+ grade
The composite is a weighted blend of 9 inputs, each scored 0–100. Each bar is that input's sub-score; the figure is the points it added to the 100-point composite (weight × sub-score).
- Cash flow +30.0/30.0
- ARV discount +15.0/15.0
- DSCR +10.0/10.0
- 1% rule +9.8/10.0
- Livability +4.2/5.0
- Rent growth +3.3/5.0
- Schools +2.7/10.0
- Condition / age +2.5/5.0
- Appreciation +0.0/10.0
$132,500
🖨 Deal sheet (PDF) 📄 Offer letter ✓ Due diligence
Listing remarks MLS
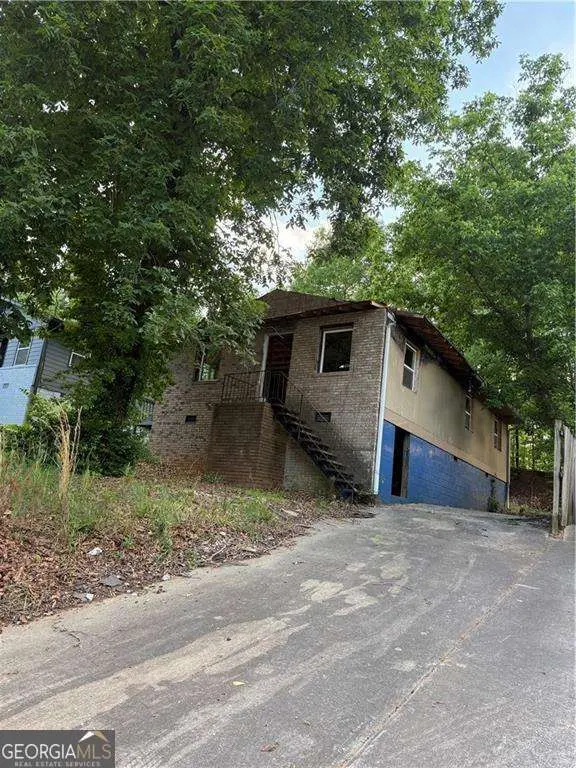
This house had a fire so it is being sold as a fixer upper. After the fire the owner replaced the roof and started to stud out the rooms. This is 3 Bedroom, 2 Bathroom, 1,100 square foot house that was originally built in 1971 with brick and cinder block construction. It has good bones.
Key facts
- Stud out the rooms
- Replaced the roof
- Good bones
Tags
Property features AI
Exterior
- Parking: Driveway with space for 2 vehicles; Open parking available
- Utilities: Public water; Public sewer; Electricity available; Natural gas available; Cable available; Phone service available
- Home design: One-level property
- Construction: Brick and other exterior construction materials; Composition roof; Block foundation; Property listed in fixer condition; Above-grade finished area approximately 1,050
- Exterior features: City street frontage; Asphalt road access; Near public transportation; Near schools
Interior
- Kitchen: Kitchen features not specified
- Bedrooms: Three main-level bedrooms
- Flooring: Flooring type not specified
- Bathrooms: Two full bathrooms (both on the main level); Master bathroom: none specified
- Heating & cooling: Heating type not specified; Cooling type not specified
- Interior features: No shared/common walls; Crawl space basement
- Laundry & utility: Laundry located on the main level
Neighborhood map
What this means for you Summary
Snapshot
- This is a 3-bed/1.0-bath single-family listed at $132k.
Deal economics
- At list price, monthly cash flow is $647 ($8k/yr) — positive.
- The deal already cash-flows at list — no discount required.
- Meets the 1% rule at list price ($2k rent vs $132k).
- Cap rate 12.2% vs local median 3.1% in Atlanta — top-decile yield for the area; either an underpriced asset or a hidden risk that comps aren't pricing in. Stress-test before assuming the spread holds.
Location & tenants
- Location reads 83/100 on livability (#6 in GA, #919 nationally) — a professional / high-income tenant draw. Strengths: amenities A+, commute A+, housing A+; Watch: cost of living C-.
- Atlanta Public Schools (urban): math 28% / reading 35% proficiency, ranked #80 of 174 in GA (top 46%) — families likely to look elsewhere, expect single-tenant / working-renter base with shorter leases; 71% free/reduced lunch — lower-income household profile, screen leases tightly.
- Zoned schools: William M.Boyd Elementary School (math 2% / reading 2%, grade F, #1,204 of 1,228 statewide, top 100%, 503 students, 100% FRL); John Lewis Invictus Academy (math 2% / reading 2%, grade F, #470 of 470 statewide, top 100%, 825 students, 100% FRL); Frederick Douglass High School (math 24%, 1,112 students, 100% FRL) — zoned schools average 100% FRL vs 71% district-wide (29 pts higher); higher-poverty schools than district average — tighter screening recommended.
- Zoned-school proficiency averages 2% at this address vs 32% district-wide (-29 pts) — the specific schools serving this property underperform the Atlanta Public Schools average; the district grade overstates school quality for this exact location.
- Market conditions: Rents rising (+3.3%/yr); 732 active listings in the ZIP; 40 comparable units currently listed for rent nearby; rentals at typical pace (median 18d on market — plan ~3-4 weeks tenant-placement turnaround); solid renter incomes; 11,565 units permitted in Fulton County in 2024 (8,159 in 5+ unit buildings).
Forward outlook
- Local home prices are declining (-3.0%/yr); year-one equity from $916 of loan paydown is wiped out by about $4k of value loss. Plan a longer hold.
- Fulton County population projected at +38% by 2050 — long-run rental-demand tailwind backs the buy-and-hold thesis.
- At projected returns (-3.0% appreciation + 3.3% rent growth), your $37k cash investment doubles in ~6 years — after that, you're playing with house money.
Negotiation context
- Only 9 days on market — expect competitive offers; lowballing is unlikely to land.
- 11 sale attempts since 11y ago with the ask held roughly flat each time — persistent listings suggest the price (not the market) is what's stuck; bring a comps-based counter.
- Current owner paid $25k; list at $132k implies a 432% gain — meaningful room to come down on a strong offer.
Risks & watch-outs
- Climate carrying-cost: extreme-heat days projected 7→16/yr by 2055 (HVAC capex compounding) — expect insurance premiums to compound above CPI over the hold.
Questions for the listing agent
- Built in 1971 — when were the roof, HVAC, electrical panel, plumbing, and water heater last replaced?
- Is there a deadline driving the sale (1031 exchange, divorce, estate, relocation)? That informs how much negotiation room exists.
- What's the average days-on-market for RENTAL listings here right now (not sales)? A rising rental-DOM trend means longer vacancies and softer asking-rent achievability than the comps imply.
- What's the recent tenant-quality profile in this submarket — average credit score on applications, eviction rate, late-payment / NSF rate, and stable-employment percentage? A property-management company in the area should have these aggregated.
- How much new for-sale + rental construction is in the pipeline within 1–3 miles? Heavy new supply typically softens prices + rents 12–24 months out; constrained supply supports both.
Investment metrics
- 1% rule
- 1.48% ✓
- Cap rate
- 12.15%
- Cash-on-cash
- 20.93%
- DSCR
- 1.93
- GRM
- 5.6
CMA / ARV
- ARV (on-the-fly)
- $238,350
- Comps found
- 8
Show comp detail 8 sales within ~0.75 mi
| Address | Dist | Beds/Ba | Sqft | Sold | Price | $/sf | Match |
|---|---|---|---|---|---|---|---|
| 2680 Brown St NW | 0.37mi | 2/2.5 (-1) | 1,085 (+3%) | 2mo | $246,720 | $227 | 65 |
| 1061 5th St NW | 0.38mi | 3/1.0 | 980 (-7%) | 9mo | $179,900 | $184 | 64 |
| 2598 Elliott St NW | 0.44mi | 3/1.5 | 960 (-9%) | 5mo | $225,000 | $234 | 60 |
| 1096 3rd St NW | 0.42mi | 2/1.0 (-1) | 1,148 (+9%) | 2mo | $105,000 | $91 | 58 |
| 1023 Hightower Rd NW | 0.38mi | 4/2.0 (+1) | 1,175 (+12%) | 1mo | $157,500 | $134 | 52 |
| 1096 Wedgewood Dr NW | 0.18mi | 2/1.5 (-1) | 932 (-11%) | 19mo | $275,000 | $295 | 50 |
| 2668 Brown St NW | 0.37mi | 2/1.5 (-1) | 910 (-13%) | 7mo | $246,720 | $271 | 48 |
| 2900 Eleanor Ter NW | 0.70mi | 3/2.0 | 1,194 (+14%) | 12mo | $130,000 | $109 | 30 |
Match score weights: distance 35% · size 25% · config 20% · recency 20%. Top-matched comps best support the ARV.
Projected returns pro-forma
-3.0% appreciation · 3.26% rent growth · sell at horizon
- IRR
- 13.6%
- Equity multiple
- 1.55×
- Total profit
- $20,267
- Equity at exit
- $19,756
- IRR
- 22.7%
- Equity multiple
- 2.97×
- Total profit
- $72,906
- Equity at exit
- $11,456
Cash invested: $37,100 (down + closing). Projections, not guarantees.
Landlord ↔ Tenant lean methodology
- Overall (STATE)
- 90 Strongly Landlord-Friendly
- State Georgia
- 90 Strongly Landlord-Friendly · R+3
- County
- — inherits STATE
- City
- — inherits STATE
ZIP-level market 30318
- Rents YoY
- 3.3%
- Active inventory
- 732
- Price-to-rent
- 5.6×
Monthly cashflow live
- Estimated rent
- $1,958 high interval (Pro) →
- Mortgage (P&I)
- −$695
- Tax from tax record
- −$150 /mo · $1,800/yr
- Insurance
- −$55
- HOA
- −$0
- Vacancy / Maint / Mgmt
- −$411
- Net cashflow
- $647
Break-even live
Sensitivity live
| Price | -10% $722 | -5% $684 | +0% $647 | +5% $609 | +10% $572 |
|---|---|---|---|---|---|
| Rent | -10% $492 | -5% $570 | +0% $647 | +5% $724 | +10% $802 |
| Rate | -1.0pp $714 | -0.5pp $681 | base $647 | +0.5pp $613 | +1.0pp $578 |
UW: 25.0% down · 7.5% · 30yr · 1.5% tax · 5.0% vac · 8.0% maint · 8.0% mgmt
Financing live
Cash to close
- Down payment
- $33,125
- Closing costs
- $3,975
- Reserves months
- —
- Total cash needed
- —
Loan-product check · same deal, 3 products live
Conventional
25% down · 7.5% · 30yr
- Down + closing
- —
- Monthly P&I
- —
- Monthly cashflow
- —
- DSCR
- —
- Eligible?
- —
Personal DTI + credit; lowest rate.
DSCR
20% down · 8.5% · 30yr
- Down + closing
- —
- Monthly P&I
- —
- Monthly cashflow
- —
- DSCR
- —
- Eligible?
- —
No personal income docs; deal must DSCR.
Hard money
10% down · 12.0% · 12mo
- Down + closing
- —
- Monthly P&I
- —
- Monthly cashflow
- —
- DSCR
- —
- Eligible?
- —
Short-term bridge; refi at stabilization.
Rent comps 40 comps
| Address | Beds | Baths | Sqft | Rent | $/sqft | DOM | Units | Dist |
|---|---|---|---|---|---|---|---|---|
| 1212 James Jackson Pkwy NW Atlanta, GA | 3.0 | 2.0 | 1211 | $1,782 | $1.47 | 15d | 1 | 0.08mi |
| 1006 Hightower Rd NW Atlanta, GA | 3.0 | 2.0 | 1320 | $2,065 | $1.56 | 14d | 1 | 0.39mi |
| 1315 Northwest Dr NW Atlanta, GA | 3.0 | 1.0–2.0 | 908 | $2,415 | $2.66 | 0d | 34 | 0.39mi |
| 2595 Elliott St NW Atlanta, GA | 4.0 | 2.0 | 1101 | $1,900 | $1.73 | 11d | 1 | 0.44mi |
| 2431 Saint Paul Ave NW Atlanta, GA | 3.0 | 2.0 | 1134 | $2,045 | $1.80 | 3d | 1 | 0.49mi |
| 1400 Northwest Dr NW Unit A Atlanta, GA | 3.0 | 2.0 | 1228 | $2,600 | $2.12 | 25d | 1 | 0.62mi |
| 2284 Alvin Dr NW Unit B 1 Atlanta, GA | 3.0 | 1.0 | 875 | $1,025 | $1.17 | 4d | 1 | 0.76mi |
| 2284 Alvin Dr NW Unit B 1 Atlanta, GA | 3.0 | 1.0 | 875 | $1,025 | $1.17 | 0d | 1 | 0.76mi |
| 2284 Alvin Dr NW Unit D Atlanta, GA | 2.0 | 1.0 | 868 | $995 | $1.15 | 0d | 1 | 0.76mi |
| 2284 Alvin Dr NW Unit D Atlanta, GA | 2.0 | 1.0 | 868 | $995 | $1.15 | 4d | 1 | 0.76mi |
| 991 Ada Ave NW Atlanta, GA | 4.0 | 2.0 | 1458 | $2,450 | $1.68 | 25d | 1 | 0.77mi |
| 848 Ridge Ave NW Unit A Atlanta, GA | 3.0 | 2.5 | 1410 | $1,875 | $1.33 | 25d | 1 | 0.81mi |
| 1647 Bridgeport Dr NW Atlanta, GA | 4.0 | 2.0 | 1250 | $2,100 | $1.68 | 5d | 1 | 0.83mi |
| 2355 Hill St NW Atlanta, GA | 3.0 | 3.0 | 1320 | $1,700 | $1.29 | 25d | 1 | 0.84mi |
| 2862 Argyle Dr NW Atlanta, GA | 3.0 | 1.0 | 816 | $1,700 | $2.08 | 6d | 1 | 0.84mi |
| 1620 Hollywood Rd NW Atlanta, GA | 3.0 | 1.0 | 937 | $1,199 | $1.28 | 4d | 1 | 0.85mi |
| 838 Ridge Ave NW Atlanta, GA | 3.0 | 2.5 | 1452 | $1,953 | $1.35 | 25d | 1 | 0.86mi |
| 874 Center Hill Ave NW Atlanta, GA | 3.0 | 2.0 | 1176 | $1,695 | $1.44 | 25d | 1 | 0.91mi |
| 929 N Grand Ave NW Atlanta, GA | 3.0 | 2.0 | 1100 | $2,500 | $2.27 | 25d | 1 | 0.96mi |
| 854 N Grand Ave NW Atlanta, GA | 4.0 | 2.5 | 1436 | $1,824 | $1.27 | 25d | 1 | 1.02mi |
| 717 Church St NW Atlanta, GA | 4.0 | 2.0 | 1328 | $2,000 | $1.51 | 25d | 1 | 1.04mi |
| 1021 Harwell Rd NW Atlanta, GA | 1.0–2.0 | 1.0–1.5 | 1002 | $1,534 | $1.53 | 8d | 15 | 1.05mi |
| 646 Robert St NW Atlanta, GA | 3.0 | 2.0 | 1374 | $2,400 | $1.75 | 19d | 1 | 1.07mi |
| 624 Robert St NW Atlanta, GA | 3.0 | 2.0 | 1221 | $3,000 | $2.46 | 25d | 1 | 1.09mi |
| 38 Hollywood Dr NW Atlanta, GA | 4.0 | 2.0 | 1400 | $2,200 | $1.57 | 25d | 1 | 1.12mi |
| 1725 Church St NW Atlanta, GA | 4.0 | 2.0 | 1274 | $2,013 | $1.58 | 0d | 1 | 1.12mi |
| 2740 Oldknow Dr NW Unit A Atlanta, GA | 2.0 | 2.0 | 1100 | $2,050 | $1.86 | 25d | 1 | 1.14mi |
| 2762 Oldknow Dr NW Atlanta, GA | 2.0 | 1.0 | 880 | $1,600 | $1.82 | 25d | 1 | 1.14mi |
| 1648 Mary George Ave NW Atlanta, GA | 3.0 | 2.0 | 1056 | $1,950 | $1.85 | 11d | 1 | 1.16mi |
| 1110 Cato St NW Atlanta, GA | 3.0 | 1.0 | 1050 | $1,400 | $1.33 | 25d | 1 | 1.16mi |
| 1071 Bolton Rd NW Atlanta, GA | 3.0 | 2.0–2.5 | 1358 | $2,388 | $1.76 | 6d | 2 | 1.17mi |
| 1040 Summerfield Way Atlanta, GA | 3.0 | 2.5 | 1378 | $2,000 | $1.45 | 0d | 1 | 1.22mi |
| 2364 Cross St NW Atlanta, GA | 3.0 | 1.0 | 1168 | $1,500 | $1.28 | 17d | 1 | 1.23mi |
| 2430 Perry Blvd NW Atlanta, GA | 2.0 | 1.0 | 800 | $1,500 | $1.88 | 25d | 1 | 1.24mi |
| 1015 Hayden St Atlanta, GA | 3.0 | 2.5 | 1339 | $2,400 | $1.79 | 0d | 1 | 1.27mi |
| 1070 Bolton Rd NW Atlanta, GA | 1.0–3.0 | 1.0–3.0 | 1094 | $2,196 | $2.01 | 3d | 12 | 1.27mi |
| 556 Church St NW Atlanta, GA | 2.0 | 2.0 | 1432 | $2,200 | $1.54 | 8d | 1 | 1.33mi |
| 2662 Hood Ave NW Atlanta, GA | 3.0 | 2.0 | 1450 | $2,000 | $1.38 | 25d | 1 | 1.36mi |
| 2732 Baker Ridge Dr NW Atlanta, GA | 3.0 | 1.5 | 1322 | $1,750 | $1.32 | 25d | 1 | 1.39mi |
| 1026 Sims Ave NW Unit B Atlanta, GA | 4.0 | 3.0 | 1492 | $2,842 | $1.90 | 25d | 1 | 1.39mi |
Listing history 7 events
-
2026-06-21days on market $132,500 Active 9 DOM
-
2026-06-18days on market $132,500 Active 6 DOM
-
2026-06-17days on market $132,500 Active 5 DOM
-
2026-06-16days on market $132,500 Active 4 DOM
-
2026-06-15days on market $132,500 Active 3 DOM
-
2026-06-13remarks 287-char remark
-
2026-06-13$132,500 Active 1 DOM
ⓘ Source: listings_history table (triggers on properties + properties_extension) + one-shot
backfill from property_details.listing_events for pre-trigger history.
Tax reassessment forecast GA · Resets to sale price
- Current annual tax
- $1,800 · $150/mo
- Projected year-2 tax
- $1,800 · $150/mo
- Expected delta
- $0/yr ($0/mo · 0.0%)
ⓘ Screening estimate from a state-policy table — verify with the county assessor before closing.
Climate risk First Street
- Flood 1/10 Low FEMA zone X (unshaded) · 0% chance over 30 yrs
- Wildfire 1/10 Low
- Heat 5/10 Major 7 d/yr ≥104°F today · 16 d/yr by 30 yrs out
- Wind 4/10 Moderate 21% chance of damaging wind over 30 yrs
- Air quality 4/10 Moderate 3 unhealthy d/yr today · 5 by 30 yrs out
Nearby sold comps map
Loading sold comps map…
Walkable amenities ~0.75 mi
Loading nearby amenities…
Taxation est. · year 1
- Rental income
- $23,499
- − Mortgage interest
- −$7,422
- − Property taxes
- −$1,800
- − Insurance
- −$662
- − Repairs & maintenance
- −$1,880
- − Management
- −$1,880
- − Depreciation
- −$3,855
- Taxable income
- $6,000
- Est. tax owed @ 24.0%
- −$1,440
- After-tax cash flow
- $6,323/yr
For passive investors: Depreciation is non-cash, so a rental often shows a tax loss while cash-flowing — sheltering income. Rental losses are passive: they offset passive income freely, and up to $25,000/yr can offset ordinary (W-2) income if you actively participate and your MAGI is under $100k (phasing out to $0 by $150k); unused losses carry forward. On sale, claimed depreciation is recaptured at up to 25%, and gains may owe capital-gains tax (a 1031 exchange can defer both). Figures are a year-1 estimate at your 24.0% rate — not tax advice; consult a CPA.
Schools (NCES district)
- District
- Atlanta Public Schools
- NCES district ID
- 1300120
- Math proficiency
- 28% ▼ -6.00%
- Reading proficiency
- 35% ▼ -2.00%
- Median HH income
- $48,306
- Composite
- 27.27/100
- National rank
- #7006
- State rank
- #80 of 174 in GA
Livability — Atlanta
- Score
- 83/100
- State rank
- #6
- US rank
- #919
Category grades
Schools grade is shown separately in the Schools card above.
Census & demographics
- Census place
- Atlanta, GA
- County
- Fulton County · 1,094,430 people
- City population
- 629,525
- Metro
- Atlanta-Sandy Springs-Alpharetta, GA
- Population (ZIP)
- 59,609
- Household income
- $83,116
- Rent vs Own
- Severe rent burden
- 4182.0
Population outlook (Fulton County) Hauer SSP2
- Today (2025)
- 1,203,707 people
- By 2030
- 1,299,706 · +8.0%
- By 2040
- 1,488,256 · +23.6%
- By 2050
- 1,664,580 · +38.3%
- By 2075
- 2,036,072 · +69.2%
- By 2100
- 2,222,402 · +84.6%
Race, ethnicity, and origin ACS 2023
- Neighborhood character
- Diverse neighborhood (Simpson 0.63)
- Race & ethnicity
- Black 49% White 35% Hispanic / Latino 7% Two or more races 6% Asian 5%
- Hispanic origin (detail)
- Mexican 2% Puerto Rican 1%
- Common ancestry
- Lithuanian 2% Slovak 2% Romanian 1%
- Foreign-born
- 8% · Canada, China, South Korea
- Languages at home
- 88% English-only · Spanish 4% Other Indo-European 2% Other Asian/Pacific 1%
Political lean MEDSL · Fulton
- 2024 margin
- Solid D (+44.9) · D 71.9% · R 27.0% · Other 1.1%
- 2008→2024 swing
- +9.8pp toward D · 2008: 35.0pp · 2024: 44.9pp
- All cycles
- 2024: D+44.9 2020: D+46.4 2016: D+42.1 2012: D+29.6 2008: D+35.0
Not yet ingested
- Civics
- —
Market trends
- HPI YoY
- ▼ -470.82%
- Current HPI
- 224.1493
- Rent YoY
- ▲ 3.26%
- Metro
- Atlanta-Sandy Springs-Alpharetta, GA
- State GDP YoY
- ▲ 2.66%
- F500 in state
- 28
Industry mix (Fortune 500 HQ in GA)
| Industry | F500 HQs | Revenue |
|---|---|---|
| Paper / Packaging | 2 | $29B |
|
||
| Retail | 1 | $160B |
|
||
| Transportation / Logistics | 1 | $91B |
|
||
| Airlines | 1 | $62B |
|
||
| Consumer Goods | 1 | $47B |
|
||
| Utilities | 1 | $25B |
|
||
Price history
+113.7% since first listed27 events — show timeline
- 2026-06-12 Listed $132,500 FMLS
- 2026-06-12 Listed $132,500 GAMLS
- 2018-01-11 Listing Removed — GAMLS
- 2017-10-16 Relisted — GAMLS
- 2017-10-11 Pending — GAMLS
- 2017-09-05 Relisted — GAMLS
- 2017-08-07 Pending — GAMLS
- 2017-07-14 Listed $79,900 GAMLS
- 2017-05-26 Listing Removed — GAMLS
- 2017-05-23 Relisted — GAMLS
- 2017-05-10 Pending — GAMLS
- 2017-05-01 Listing Removed — GAMLS
- 2017-04-28 Relisted — GAMLS
- 2017-03-17 Pending — GAMLS
- 2017-01-06 Relisted — GAMLS
- 2016-12-20 Pending — GAMLS
- 2016-11-01 Listed $75,000 GAMLS
- 2016-10-25 Listing Removed — GAMLS
- 2016-07-14 Price Changed $71,900 GAMLS
- 2016-04-27 Listed $69,900 GAMLS
- 2015-11-03 Sold (MLS) $24,900 GAMLS
- 2015-08-25 Pending — GAMLS
- 2015-08-14 Price Changed $24,900 GAMLS
- 2015-08-01 Price Changed $29,900 GAMLS
- 2015-07-16 Listed $34,900 GAMLS
- 2006-09-18 Sold (Public Records) $148,000 Public Records
- 2005-10-24 Sold (Public Records) $62,000 Public Records
Property tax history
+2.2%/yrLatest (2025): $1,800 · +33.9% YoY. Source: county tax records.
Cash-flow waterfall
monthlySold comps — $/sqft
last 12 mo · ≤1 miLoading sold comps…