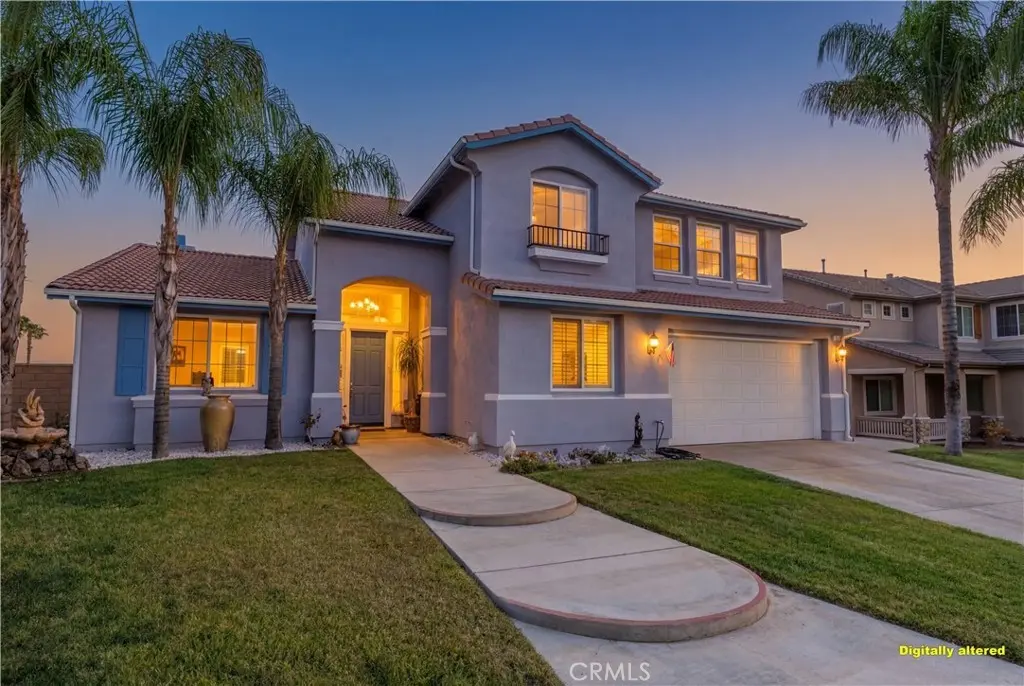
28195 Juniper Tree · Menifee, CA
Flood risk 1/10 · Minimal
- FEMA flood zone
- X (unshaded)
- Chance of flooding over 30 yrs
- 0.0%
- Est. flood insurance / yr
- $507 – $1,088
Fire risk 7/10 · Major
- Est. fire insurance / yr
- $659 – $1,223
Heat risk 7/10 · Major
- Hot days now (above 105°F)
- 5 days/yr
- Hot days in 30 yrs
- 14 days/yr
Wind risk 1/10 · Minimal
- Chance of severe wind over 30 yrs
- —
Air-quality risk 5/10 · Moderate
- Unhealthy air days now
- 9 days/yr
- Unhealthy air days in 30 yrs
- 11 days/yr
Risk factors via First Street. Map © Google.
Why this score? — see what drove the D grade
The composite is a weighted blend of 9 inputs, each scored 0–100. Each bar is that input's sub-score; the figure is the points it added to the 100-point composite (weight × sub-score).
- ARV discount +11.1/15.0
- Cash flow +10.9/30.0
- Rent growth +5.0/5.0
- Schools +4.5/10.0
- DSCR +3.2/10.0
- Livability +3.2/5.0
- 1% rule +2.7/10.0
- Condition / age +2.5/5.0
- Appreciation +0.0/10.0
$689,999
🖨 Deal sheet 📄 Offer letter ✓ Due diligence
Listing remarks
Perched in one of Menifee's most desirable locations, this expansive 6-bedroom home offers some of the most breathtaking views in the neighborhood. From sunrise to sunset, you'll enjoy panoramic vistas that create the perfect backdrop for everyday living. Inside, the recently renovated kitchen serves as the heart of the home, featuring modern updates and plenty of space for gathering, entertaining, and making memories. With six generously sized bedrooms, there's room for everyone—whether you need space for a large family, guests, a home office, or multi-generational living. The home has been thoughtfully refreshed with both interior and exterior paint completed within the last year, p
Key facts
- 0.24 acre lot
- 2 garage spots
- Built 2004
Property features AI
Finance
- Other: Single-family dwelling (1 unit); Lot features: 0-1 unit/acre
- HOA & community: Curbs; Biking; Foothills
Exterior
- Parking: Attached garage; 2 garage spaces; 2 total parking spaces
- Utilities: Public sewer; District/public water
- Home design: House; Two stories; Entry level is ground floor
- Construction: No common walls; Year built: public records
- Exterior features: Back yard; Yard; No pool
Interior
- Kitchen: Walk-in pantry
- Bedrooms: Main floor bedroom(s): 2
- Bathrooms: 3 full bathrooms; 1 half bathroom; 2 main-level bathrooms
- Heating & cooling: Central furnace heating; Central cooling
- Interior features: Formal entry; Walk-in closet; Walk-in pantry; Bonus room; Family room; Front door entry; Two levels; Has view
- Laundry & utility: Laundry in an individual room
Neighborhood map
What this means for you Summary
Snapshot
- This is a 6-bed/3.5-bath single-family listed at $690k.
Deal economics
- At list price, monthly cash flow is $-307 ($-4k/yr) — negative.
- To cash-flow at today's rent, offer at most $636k (7.9% below list).
- To meet the 1% rule (rent ≥ 1% of price), the offer needs to be $531k (23.0% below list).
- Recommended offer: $531k (23.0% below list) — sets the bar for 1% rule.
- Cap rate 5.8% vs local median 3.6% in Menifee — top-decile yield for the area; either an underpriced asset or a hidden risk that comps aren't pricing in. Stress-test before assuming the spread holds.
Location & tenants
- Location reads 64/100 on livability (#407 in CA) — a middle-class / working-renter tenant base. Strengths: housing A+, crime A, employment A-; Watch: schools D+, health & safety D+, amenities D.
- Menifee Union Elementary (suburban): math 43% / reading 56% proficiency, ranked #434 of 1,400 in CA (top 31%) — families likely to look elsewhere, expect single-tenant / working-renter base with shorter leases.
- Market conditions: Rents rising fast (+10.4%/yr); 179 active listings in the ZIP; 2 comparable units currently listed for rent nearby; solid renter incomes; 9,195 units permitted in Riverside County in 2024 (1,512 in 5+ unit buildings).
- At $5,311/mo this rent would consume 60% of the median local household income ($107k/yr) (locally 531% of renters already pay >50% of income on rent) — very limited rent-growth headroom before tenants either downsize or default.
Forward outlook
- Local home prices are declining (-3.0%/yr); year-one equity from $5k of loan paydown is wiped out by about $21k of value loss. Plan a longer hold.
- Riverside County population projected at +22% by 2050 — long-run rental-demand tailwind backs the buy-and-hold thesis.
Negotiation context
- It's been on market 15 days — a 2% lower offer ($680k) is reasonable based on typical stale-listing flexibility.
- 15 sale attempts since 20y ago with the ask held roughly flat each time — persistent listings suggest the price (not the market) is what's stuck; bring a comps-based counter.
- Current owner paid $252k; list at $690k implies a 174% gain — meaningful room to come down on a strong offer.
Risks & watch-outs
- Climate carrying-cost: major wildfire risk; extreme-heat days projected 5→14/yr by 2055 (HVAC capex compounding) — expect insurance premiums to compound above CPI over the hold.
Questions for the listing agent
- What do current leases actually rent for vs. the listed asking? Can we see a recent rent roll and the last 12 months of T-12 income?
- Is there a deadline driving the sale (1031 exchange, divorce, estate, relocation)? That informs how much negotiation room exists.
- Schools are D-rated, which usually means shorter tenancies and higher turnover. Who's the typical renter profile here, and what's been the actual vacancy rate?
- The area grade is low — what's the realistic commute time and amenity access for the typical tenant pool here? Any planned neighborhood developments (good or bad) we should know about?
- What's the average days-on-market for RENTAL listings here right now (not sales)? A rising rental-DOM trend means longer vacancies and softer asking-rent achievability than the comps imply.
- What's the recent tenant-quality profile in this submarket — average credit score on applications, eviction rate, late-payment / NSF rate, and stable-employment percentage? A property-management company in the area should have these aggregated.
- How much new for-sale + rental construction is in the pipeline within 1–3 miles? Heavy new supply typically softens prices + rents 12–24 months out; constrained supply supports both.
Investment metrics
- 1% rule
- 0.77% ✗
- Cap rate
- 5.76%
- Cash-on-cash
- -1.91%
- DSCR
- 0.92
- GRM
- 10.8
CMA / ARV
- ARV (on-the-fly)
- $749,736
- Comps found
- 6
Show comp detail 6 sales within ~0.75 mi
| Address | Dist | Beds/Ba | Sqft | Sold | Price | $/sf | Match |
|---|---|---|---|---|---|---|---|
| 27979 Merbie Cir | 0.08mi | 6/3.5 | 3,459 (-0%) | 24mo | $720,000 | $208 | 76 |
| 27894 Tate Rd | 0.30mi | 6/3.5 | 3,255 (-6%) | 15mo | $850,000 | $261 | 63 |
| 27852 Whittington Rd | 0.35mi | 5/3.5 (-1) | 3,356 (-3%) | 18mo | $700,000 | $209 | 58 |
| 27948 Whittington Rd | 0.36mi | 5/3.5 (-1) | 3,356 (-3%) | 18mo | $720,000 | $215 | 58 |
| 28652 Pensthorpe Cir | 0.45mi | 5/3.0 (-1) | 3,356 (-3%) | 12mo | $865,000 | $258 | 56 |
| 27780 Whittington Rd | 0.37mi | 5/3.5 (-1) | 3,356 (-3%) | 23mo | $725,000 | $216 | 53 |
Match score weights: distance 35% · size 25% · config 20% · recency 20%. Top-matched comps best support the ARV.
Projected returns pro-forma
-3.0% appreciation · 8.0% rent growth · sell at horizon
- IRR
- -14.3%
- Equity multiple
- 0.46×
- Total profit
- $-103,409
- Equity at exit
- $102,881
- IRR
- 0.7%
- Equity multiple
- 1.06×
- Total profit
- $12,145
- Equity at exit
- $59,659
Cash invested: $193,200 (down + closing). Projections, not guarantees.
Landlord ↔ Tenant lean methodology
- Overall (STATE)
- 18 Strongly Tenant-Friendly
- State California
- 18 Strongly Tenant-Friendly · D+13
- County
- — inherits STATE
- City
- — inherits STATE
ZIP-level market 92585
- Home prices YoY
- -30.0%
- Rents YoY
- 10.4%
- Active inventory
- 179
- Price-to-rent
- 10.8×
Monthly cashflow live
- Estimated rent
- $5,311 medium interval (Pro) →
- Mortgage (P&I)
- −$3,618
- Tax from tax record
- −$597 /mo · $7,167/yr
- Insurance
- −$287
- HOA
- −$0
- Vacancy / Maint / Mgmt
- −$1,115
- Net cashflow
- $-307
Break-even live
UW: 25.0% down · 7.5% · 30yr · 1.5% tax · 5.0% vac · 8.0% maint · 8.0% mgmt
Financing live
Cash to close
- Down payment
- $172,500
- Closing costs
- $20,700
- Reserves months
- —
- Total cash needed
- —
Loan-product check · same deal, 3 products live
Conventional
25% down · 7.5% · 30yr
- Down + closing
- —
- Monthly P&I
- —
- Monthly cashflow
- —
- DSCR
- —
- Eligible?
- —
Personal DTI + credit; lowest rate.
DSCR
20% down · 8.5% · 30yr
- Down + closing
- —
- Monthly P&I
- —
- Monthly cashflow
- —
- DSCR
- —
- Eligible?
- —
No personal income docs; deal must DSCR.
Hard money
10% down · 12.0% · 12mo
- Down + closing
- —
- Monthly P&I
- —
- Monthly cashflow
- —
- DSCR
- —
- Eligible?
- —
Short-term bridge; refi at stabilization.
Rent comps 2 comps
| Address | Beds | Baths | Sqft | Rent | $/sqft | DOM | Units | Dist |
|---|---|---|---|---|---|---|---|---|
| 28448 Ripple Brook Ln Menifee, CA | 5.0 | 3.5 | 3840 | $4,500 | $1.17 | 24d | 1 | 1.37mi |
| 26877 Chance Dr Menifee, CA | 5.0 | 3.5 | 2800 | $7,500 | $2.68 | 24d | 1 | 1.44mi |
Listing history 10 events
-
2026-06-18days on market $689,999 Active 15 DOM
-
2026-06-17days on market $689,999 Active 14 DOM
-
2026-06-16days on market $689,999 Active 13 DOM
-
2026-06-15days on market $689,999 Active 12 DOM
-
2026-06-13days on market $689,999 Active 10 DOM
-
2026-06-09days on market $689,999 Active 6 DOM
-
2026-06-08days on market $689,999 Active 5 DOM
-
2026-06-07days on market $689,999 Active 4 DOM
-
2026-06-03remarks 693-char remark
-
2026-06-03$689,999 Active 1 DOM
ⓘ Source: listings_history table (triggers on properties + properties_extension) + one-shot
backfill from property_details.listing_events for pre-trigger history.
Tax reassessment forecast CA · Resets to sale price
- Current annual tax
- $7,167 · $597/mo
- Projected year-2 tax
- $7,167 · $597/mo
- Expected delta
- $0/yr ($0/mo · -0.0%)
ⓘ Screening estimate from a state-policy table — verify with the county assessor before closing.
Climate risk First Street
- Flood 1/10 Low FEMA zone X (unshaded) · 0% chance over 30 yrs
- Wildfire 7/10 Severe
- Heat 7/10 Severe 5 d/yr ≥105°F today · 14 d/yr by 30 yrs out
- Wind 1/10 Low
- Air quality 5/10 Major 9 unhealthy d/yr today · 11 by 30 yrs out
Nearby sold comps map
Loading sold comps map…
Walkable amenities ~0.75 mi
Loading nearby amenities…
Taxation est. · year 1
- Rental income
- $63,732
- − Mortgage interest
- −$38,651
- − Property taxes
- −$7,167
- − Insurance
- −$3,450
- − Repairs & maintenance
- −$5,099
- − Management
- −$5,099
- − Depreciation
- −$20,073
- Taxable loss
- −$15,806
- Est. tax savings @ 24.0%
- +$3,793
- After-tax cash flow
- $103/yr
For passive investors: Depreciation is non-cash, so a rental often shows a tax loss while cash-flowing — sheltering income. Rental losses are passive: they offset passive income freely, and up to $25,000/yr can offset ordinary (W-2) income if you actively participate and your MAGI is under $100k (phasing out to $0 by $150k); unused losses carry forward. On sale, claimed depreciation is recaptured at up to 25%, and gains may owe capital-gains tax (a 1031 exchange can defer both). Figures are a year-1 estimate at your 24.0% rate — not tax advice; consult a CPA.
Schools (NCES district)
- District
- Menifee Union Elementary
- NCES district ID
- 0624540
- Math proficiency
- 43% ▬ 0.00%
- Reading proficiency
- 56% ▲ 3.00%
- Median HH income
- $58,228
- Composite
- 45.17/100
- National rank
- #5790
- State rank
- #434 of 1400 in CA
Livability — Menifee
- Score
- 64/100
- State rank
- #407
- US rank
- #13882
Category grades
Schools grade is shown separately in the Schools card above.
Census & demographics
- Census place
- Menifee, CA
- County
- Riverside County · 2,287,001 people
- City population
- 111,667
- Metro
- Riverside-San Bernardino-Ontario, CA
- Population (ZIP)
- 29,534
- Household income
- $106,667
- Rent vs Own
- Severe rent burden
- 531.0
Population outlook (Riverside County) Hauer SSP2
- Today (2025)
- 2,664,475 people
- By 2030
- 2,802,692 · +5.2%
- By 2040
- 3,050,904 · +14.5%
- By 2050
- 3,256,783 · +22.2%
- By 2075
- 3,655,058 · +37.2%
- By 2100
- 3,766,594 · +41.4%
Race, ethnicity, and origin ACS 2023
- Neighborhood character
- Diverse neighborhood (Simpson 0.64)
- Race & ethnicity
- Hispanic / Latino 53% White 27% Two or more races 24% Black 7% Asian 6% Native American 2%
- Hispanic origin (detail)
- Mexican 46%
- Common ancestry
- Slovak 2% Iranian 2% Romanian 1%
- Foreign-born
- 20% · Canada, Jamaica, South Korea
- Languages at home
- 60% English-only · Spanish 35% Tagalog/Filipino 1% Other Asian/Pacific 1%
Political lean MEDSL · Riverside
- 2024 margin
- Toss-up / Even · D 48.0% · R 49.3% · Other 2.6%
- 2008→2024 swing
- -3.6pp toward R · 2008: 2.3pp · 2024: -1.3pp
- All cycles
- 2024: R+1.3 2020: D+8.0 2016: D+4.3 2012: R+0.4 2008: D+2.3
Not yet ingested
- Civics
- —
Market trends
- HPI YoY
- ▼ -153.87%
- Current HPI
- 358.626
- Rent YoY
- ▲ 10.43%
- Metro
- Riverside-San Bernardino-Ontario, CA
- State GDP YoY
- ▲ 3.21%
- F500 in state
- 116
Industry mix (Fortune 500 HQ in CA)
| Industry | F500 HQs | Revenue |
|---|---|---|
| Technology | 27 | $1,492B |
|
||
| Financial Services | 3 | $174B |
|
||
| Retail | 3 | $44B |
|
||
| Insurance | 3 | $26B |
|
||
| Media / Entertainment | 2 | $115B |
|
||
| Pharmaceuticals / Biotech | 2 | $62B |
|
||
Price history
+19.0% since first listed47 events — show timeline
- 2026-06-03 Listed $689,999 CRMLS
- 2026-06-02 Coming Soon $689,999 CRMLS
- 2026-02-25 Listing Removed — CRMLS
- 2026-02-20 Listed $690,000 CRMLS
- 2026-02-10 Listing Removed — CRMLS
- 2026-01-18 Price Changed $850,000 CRMLS
- 2026-01-03 Price Changed $899,000 CRMLS
- 2025-12-17 Relisted — CRMLS
- 2025-11-26 Price Changed $900,000 CRMLS
- 2025-11-03 Price Changed $950,000 CRMLS
- 2025-10-14 Price Changed $1,000,000 CRMLS
- 2025-10-07 Price Changed $1,050,000 CRMLS
- 2025-10-05 Price Changed $1,500,000 CRMLS
- 2025-08-16 Listed $1,100,000 CRMLS
- 2025-08-11 Coming Soon — CRMLS
- 2009-06-29 Sold (Public Records) $271,000 Public Records
- 2009-06-29 Sold (MLS) $252,000 CRMLS
- 2009-05-08 Listing Removed — CRMLS
- 2009-04-28 Listed $259,900 CRMLS
- 2009-04-25 Listing Removed — CRMLS
- 2009-04-25 Listing Removed — CRMLS
- 2009-04-23 Listed $259,900 CRMLS
- 2009-04-13 Relisted — CRMLS
- 2009-02-20 Listing Removed — CRMLS
- 2009-02-10 Contingent — CRMLS
- 2009-01-29 Price Changed $299,000 CRMLS
- 2009-01-29 Listed $305,900 CRMLS
- 2009-01-27 Listing Removed — CRMLS
- 2009-01-26 Listed $305,900 CRMLS
- 2008-12-23 Listing Removed — CRMLS
- 2008-10-23 Price Changed $305,900 CRMLS
- 2008-09-23 Listed $319,900 CRMLS
- 2008-04-11 Listing Removed — CRMLS
- 2008-02-16 Listed $369,900 CRMLS
- 2008-02-15 Listing Removed — CRMLS
- 2008-01-08 Price Changed $369,900 CRMLS
- 2007-12-29 Listed $385,000 CRMLS
- 2007-11-16 Listing Removed — CRMLS
- 2007-10-26 Listing Removed — CRMLS
- 2007-09-22 Listed $419,000 CRMLS
- 2007-09-13 Price Changed $419,000 CRMLS
- 2007-09-12 Price Changed $419,900 CRMLS
- 2007-08-23 Price Changed $437,000 CRMLS
- 2007-07-20 Price Changed $449,000 CRMLS
- 2007-06-19 Listed $475,000 CRMLS
- 2006-05-25 Listing Removed — CRMLS
- 2006-01-30 Listed $580,000 CRMLS
Property tax history
+0.1%/yrLatest (2025): $7,167 · +0.6% YoY. Source: county tax records.
Cash-flow waterfall
monthlySold comps — $/sqft
last 12 mo · ≤1 miLoading sold comps…