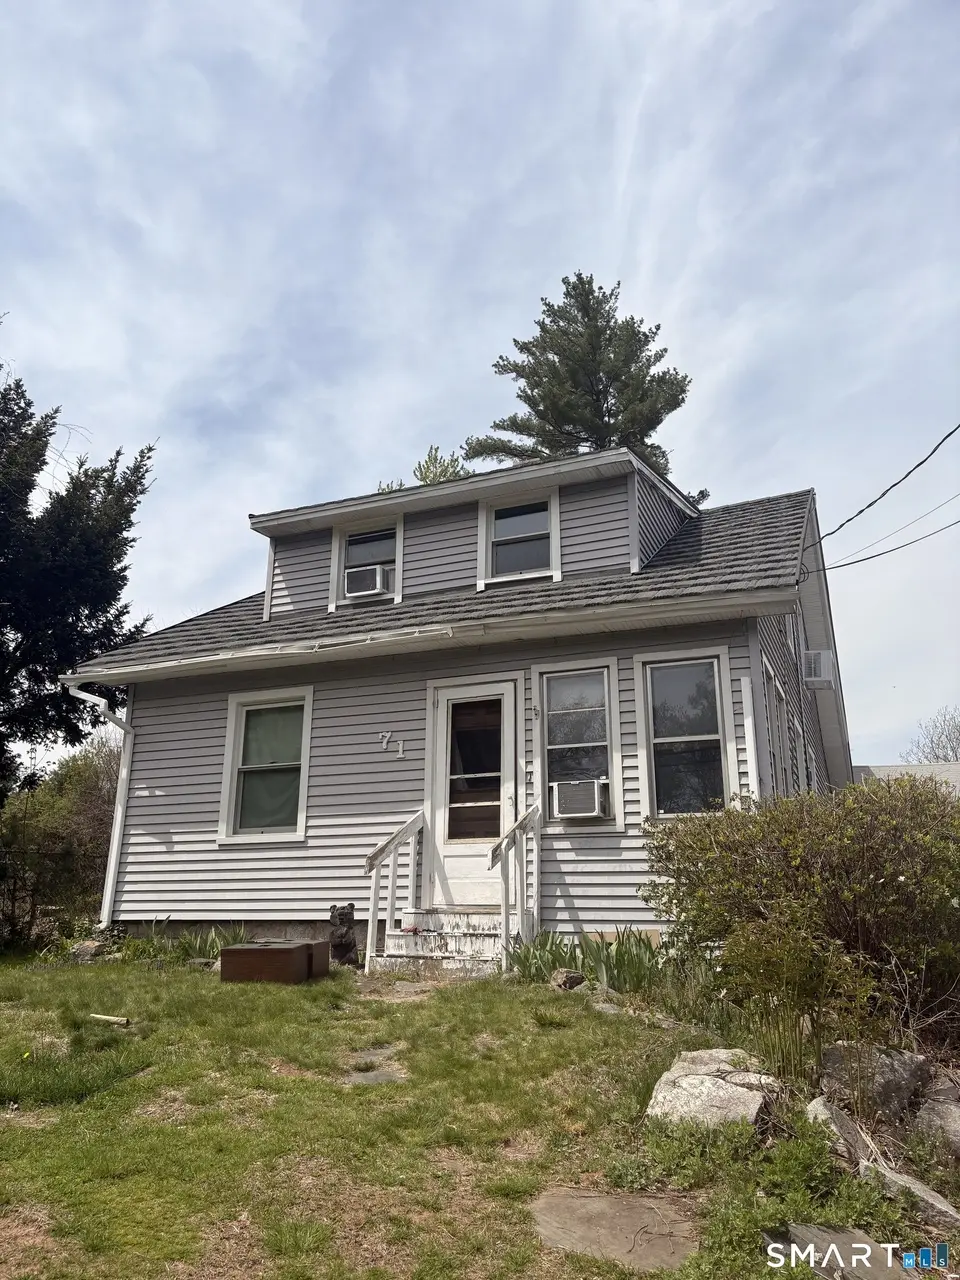
71 Mill St · Glastonbury Center, CT
Flood risk 1/10 · Minimal
- FEMA flood zone
- X (unshaded)
- Chance of flooding over 30 yrs
- 0.0%
- Est. flood insurance / yr
- $507 – $1,088
Fire risk 1/10 · Minimal
- Est. fire insurance / yr
- $829 – $1,539
Heat risk 5/10 · Moderate
- Hot days now (above 95°F)
- 7 days/yr
- Hot days in 30 yrs
- 16 days/yr
Wind risk 6/10 · Moderate
- Chance of severe wind over 30 yrs
- 27.0%
Air-quality risk 3/10 · Minor
- Unhealthy air days now
- 3 days/yr
- Unhealthy air days in 30 yrs
- 4 days/yr
Risk factors via First Street. Map © Google.
Why this score? — see what drove the C grade
The composite is a weighted blend of 9 inputs, each scored 0–100. Each bar is that input's sub-score; the figure is the points it added to the 100-point composite (weight × sub-score).
- Cash flow +18.0/30.0
- ARV discount +15.0/15.0
- Schools +6.6/10.0
- DSCR +5.7/10.0
- 1% rule +5.5/10.0
- Livability +4.2/5.0
- Rent growth +2.6/5.0
- Condition / age +2.5/5.0
- Appreciation +0.0/10.0
$274,900
🖨 Deal sheet 📄 Offer letter ✓ Due diligence
Listing remarks
This home is needing a full update on the interior but it does offer tremendous potential New Metal roofing 2025,almost all the windows are Vinyl replacement , has vinyl siding, there is a large barn garage that will fit two cars water heater apx 7 years old so you have to do all the cosmetics this one must sell fast looking for a closing fast SOLD AS IS junk to remain
Key facts
- Metal roofing
- Vinyl siding
- Large barn garage
Tags
Property features AI
Exterior
- Parking: Detached garage; 2-car garage
- Utilities: Public water; Public sewer; Above-ground fuel tank
- Home design: Single-family home
- Construction: Frame construction; Concrete and stone foundation
- Exterior features: Level lot; Vinyl siding; Asphalt shingle roof
Interior
- Kitchen: Oven/Range; Microwave; Refrigerator; Dishwasher
- Bedrooms: 3 bedrooms
- Bathrooms: 2 full bathrooms
- Heating & cooling: Steam heat; Oil-fired hot water; Window unit cooling
- Interior features: 6 total rooms; Full, unfinished basement; Attic with access via hatch
- Laundry & utility: Washer and Dryer included; Laundry on main level
Neighborhood map
What this means for you Summary
Snapshot
- This is a 3-bed/2.0-bath single-family listed at $275k.
Deal economics
- At list price, monthly cash flow is $239 ($3k/yr) — positive.
- The deal already cash-flows at list — no discount required.
- Meets the 1% rule at list price ($3k rent vs $275k).
- Cap rate 7.3% vs local median 2.1% in Glastonbury Center — top-decile yield for the area; either an underpriced asset or a hidden risk that comps aren't pricing in. Stress-test before assuming the spread holds.
Location & tenants
- Location reads 83/100 on livability (#7 in CT, #1,032 nationally) — a professional / high-income tenant draw. Strengths: crime A+, employment A+, housing A+; Watch: commute F, cost of living D-.
- Glastonbury School District (suburban): math 67% / reading 75% proficiency, ranked #13 of 153 in CT (top 8%) — strong family-tenant draw, lease renewals of 3-5y typical; only 6% free/reduced lunch — higher-income household profile.
- Market conditions: Rents flat; 96 active listings in the ZIP; 8 comparable units currently listed for rent nearby; rentals at typical pace (median 16d on market — plan ~3-4 weeks tenant-placement turnaround); high-income renter base; 1,867 units permitted in Capitol Planning Region in 2024 (1,399 in 5+ unit buildings).
Forward outlook
- Local home prices are declining (-3.0%/yr); year-one equity from $2k of loan paydown is wiped out by about $8k of value loss. Plan a longer hold.
Negotiation context
- Only 5 days on market — expect competitive offers; lowballing is unlikely to land.
Risks & watch-outs
- Watch-outs: built in 1917 — expect roof / HVAC / electrical / plumbing capex.
- Climate carrying-cost: major wind risk, 27% chance of damaging wind over 30y; extreme-heat days projected 7→16/yr by 2055 (HVAC capex compounding) — expect insurance premiums to compound above CPI over the hold.
Questions for the listing agent
- Built in 1917 — when were the roof, HVAC, electrical panel, plumbing, and water heater last replaced?
- Is there a deadline driving the sale (1031 exchange, divorce, estate, relocation)? That informs how much negotiation room exists.
- Schools are A-rated — typically a magnet for longer-tenancy family renters. What's the average tenant stay here, and is there a school-zone premium baked into asking?
- What's the average days-on-market for RENTAL listings here right now (not sales)? A rising rental-DOM trend means longer vacancies and softer asking-rent achievability than the comps imply.
- What's the recent tenant-quality profile in this submarket — average credit score on applications, eviction rate, late-payment / NSF rate, and stable-employment percentage? A property-management company in the area should have these aggregated.
- How much new for-sale + rental construction is in the pipeline within 1–3 miles? Heavy new supply typically softens prices + rents 12–24 months out; constrained supply supports both.
Investment metrics
- 1% rule
- 1.05% ✓
- Cap rate
- 7.34%
- Cash-on-cash
- 3.72%
- DSCR
- 1.17
- GRM
- 7.9
CMA / ARV
- ARV (median comp)
- $417,329
- List price
- $274,900
- Delta
- -34.13%
- Verdict
- UNDERPRICED
- Comps
- 20 within 1.0 mi
Show comp detail 3 sales within ~0.75 mi
| Address | Dist | Beds/Ba | Sqft | Sold | Price | $/sf | Match |
|---|---|---|---|---|---|---|---|
| 71 Mill St | 0.00mi | 3/2.0 | 1,251 (0%) | 0mo | $275,000 | $220 | 100 |
| 245 Cavan Ln | 0.26mi | 3/1.5 | 1,176 (-6%) | 7mo | $385,000 | $327 | 70 |
| 1016 Hebron Ave | 0.31mi | 4/1.5 (+1) | 1,152 (-8%) | 0mo | $411,075 | $357 | 65 |
Match score weights: distance 35% · size 25% · config 20% · recency 20%. Top-matched comps best support the ARV.
Projected returns pro-forma
-3.0% appreciation · 0.33% rent growth · sell at horizon
- IRR
- -13.7%
- Equity multiple
- 0.52×
- Total profit
- $-36,765
- Equity at exit
- $40,988
- IRR
- -10.1%
- Equity multiple
- 0.46×
- Total profit
- $-41,294
- Equity at exit
- $23,768
Cash invested: $76,972 (down + closing). Projections, not guarantees.
Landlord ↔ Tenant lean methodology
- Overall (STATE)
- 27 Tenant-Leaning
- State Connecticut
- 27 Tenant-Leaning · D+7
- County
- — inherits STATE
- City
- — inherits STATE
ZIP-level market 06033
- Rents YoY
- 0.3%
- Active inventory
- 96
- Price-to-rent
- 7.9×
Monthly cashflow live
- Estimated rent
- $2,887 high interval (Pro) →
- Mortgage (P&I)
- −$1,442
- Tax from tax record
- −$486 /mo · $5,834/yr
- Insurance
- −$115
- HOA
- −$0
- Vacancy / Maint / Mgmt
- −$606
- Net cashflow
- $239
Break-even live
UW: 25.0% down · 7.5% · 30yr · 1.5% tax · 5.0% vac · 8.0% maint · 8.0% mgmt
Financing live
Cash to close
- Down payment
- $68,725
- Closing costs
- $8,247
- Reserves months
- —
- Total cash needed
- —
Loan-product check · same deal, 3 products live
Conventional
25% down · 7.5% · 30yr
- Down + closing
- —
- Monthly P&I
- —
- Monthly cashflow
- —
- DSCR
- —
- Eligible?
- —
Personal DTI + credit; lowest rate.
DSCR
20% down · 8.5% · 30yr
- Down + closing
- —
- Monthly P&I
- —
- Monthly cashflow
- —
- DSCR
- —
- Eligible?
- —
No personal income docs; deal must DSCR.
Hard money
10% down · 12.0% · 12mo
- Down + closing
- —
- Monthly P&I
- —
- Monthly cashflow
- —
- DSCR
- —
- Eligible?
- —
Short-term bridge; refi at stabilization.
Rent comps 8 comps
| Address | Beds | Baths | Sqft | Rent | $/sqft | DOM | Units | Dist |
|---|---|---|---|---|---|---|---|---|
| 60 Rambling Brook Ln Unit C2 Glastonbury, CT | 2.0 | 2.0 | 940 | $2,150 | $2.29 | 3d | 1 | 0.39mi |
| 350 Cavan Ln #350 Glastonbury, CT | 3.0 | 2.5 | 1723 | $2,800 | $1.63 | 16d | 1 | 0.51mi |
| 6 Larkspur Ln #6 Glastonbury, CT | 2.0 | 1.5 | 1080 | $2,350 | $2.18 | 1d | 1 | 0.67mi |
| 917 New London Tpke Glastonbury, CT | 2.0 | 1.0–2.0 | 794 | $3,521 | $4.43 | 1d | 21 | 1.14mi |
| 101d House St Glastonbury, CT | 2.0 | 2.5 | 1450 | $3,925 | $2.71 | 44d | 1 | 1.19mi |
| 29 House St Glastonbury, CT | 3.0 | 2.5 | 1341 | $3,800 | $2.83 | 16d | 1 | 1.20mi |
| 4 Hubbard Run Dr Unit 4 Glastonbury, CT | 2.0 | 1.5 | 1200 | $2,500 | $2.08 | 21d | 1 | 1.31mi |
| 53 Salmon Brook Dr Glastonbury, CT | 1.0–2.0 | 1.0–2.5 | 1075 | $3,825 | $3.56 | 1d | 1 | 1.34mi |
Listing history 2 events
-
2026-05-06status Under Contract 359-char remark
-
2026-05-01$274,900 Active 359-char remark
ⓘ Source: listings_history table (triggers on properties + properties_extension) + one-shot
backfill from property_details.listing_events for pre-trigger history.
Tax reassessment forecast CT · Partial reset (capped growth)
- Current annual tax
- $5,834 · $486/mo
- Projected year-2 tax
- $5,858 · $488/mo
- Expected delta
- +$24/yr (+$2/mo · 0.4%)
ⓘ Screening estimate from a state-policy table — verify with the county assessor before closing.
Climate risk First Street
- Flood 1/10 Low FEMA zone X (unshaded) · 0% chance over 30 yrs
- Wildfire 1/10 Low
- Heat 5/10 Major 7 d/yr ≥95°F today · 16 d/yr by 30 yrs out
- Wind 6/10 Major 27% chance of damaging wind over 30 yrs
- Air quality 3/10 Moderate 3 unhealthy d/yr today · 4 by 30 yrs out
Nearby sold comps map
Loading sold comps map…
Walkable amenities ~0.75 mi
Loading nearby amenities…
Taxation est. · year 1
- Rental income
- $34,649
- − Mortgage interest
- −$15,399
- − Property taxes
- −$5,834
- − Insurance
- −$1,374
- − Repairs & maintenance
- −$2,772
- − Management
- −$2,772
- − Depreciation
- −$7,997
- Taxable loss
- −$1,499
- Est. tax savings @ 24.0%
- +$360
- After-tax cash flow
- $3,225/yr
For passive investors: Depreciation is non-cash, so a rental often shows a tax loss while cash-flowing — sheltering income. Rental losses are passive: they offset passive income freely, and up to $25,000/yr can offset ordinary (W-2) income if you actively participate and your MAGI is under $100k (phasing out to $0 by $150k); unused losses carry forward. On sale, claimed depreciation is recaptured at up to 25%, and gains may owe capital-gains tax (a 1031 exchange can defer both). Figures are a year-1 estimate at your 24.0% rate — not tax advice; consult a CPA.
Schools (NCES district)
- District
- Glastonbury School District
- NCES district ID
- 0901620
- Math proficiency
- 67% ▼ -8.00%
- Reading proficiency
- 75% ▼ -3.00%
- Median HH income
- $106,091
- Composite
- 65.53/100
- National rank
- #471
- State rank
- #13 of 153 in CT
Livability — Glastonbury Center
- Score
- 83/100
- State rank
- #7
- US rank
- #1032
Category grades
Schools grade is shown separately in the Schools card above.
Census & demographics
- County
- Hartford County · 754,208 people
- Metro
- Hartford-East Hartford-Middletown, CT
- Population (ZIP)
- 29,921
- Household income
- $149,962
- Rent vs Own
- Severe rent burden
- 604.0
Population outlook (Capitol County) Hauer SSP2
- By 2040
- 1,063,519
Race, ethnicity, and origin ACS 2023
- Neighborhood character
- Predominantly White (76%)
- Race & ethnicity
- White 76% Asian 10% Hispanic / Latino 9% Two or more races 6% Black 2%
- Hispanic origin (detail)
- Puerto Rican 4%
- Common ancestry
- Romanian 10% Lithuanian 5% Slovak 3%
- Foreign-born
- 13% · Canada, China, Jamaica
- Languages at home
- 82% English-only · Spanish 6% Other Indo-European 4% Other Asian/Pacific 3%
Political lean MEDSL · Capitol
- 2024 margin
- Strong D (+21.9) · D 60.1% · R 38.2% · Other 1.7%
- All cycles
- 2024: D+21.9
Not yet ingested
- Civics
- —
Market trends
- HPI YoY
- ▼ -184.94%
- Current HPI
- 193.4721
- Rent YoY
- ▲ 0.33%
- Metro
- Hartford-East Hartford-Middletown, CT
- State GDP YoY
- ▲ 1.06%
- F500 in state
- 38
Industry mix (Fortune 500 HQ in CT)
| Industry | F500 HQs | Revenue |
|---|---|---|
| Industrial Machinery | 4 | $38B |
|
||
| Insurance | 3 | $71B |
|
||
| Financial Services | 2 | $25B |
|
||
| Transportation / Logistics | 2 | $18B |
|
||
| Healthcare | 1 | $247B |
|
||
| Telecommunications | 1 | $55B |
|
||
Price history
+0.0% since first listed3 events — show timeline
- 2026-06-16 Sold (MLS) $275,000 Smart MLS
- 2026-05-06 Pending — Smart MLS
- 2026-05-01 Listed $274,900 Smart MLS
Property tax history
+1.2%/yrLatest (2025): $5,834 · +2.8% YoY. Source: county tax records.
Cash-flow waterfall
monthlySold comps — $/sqft
last 12 mo · ≤1 miLoading sold comps…