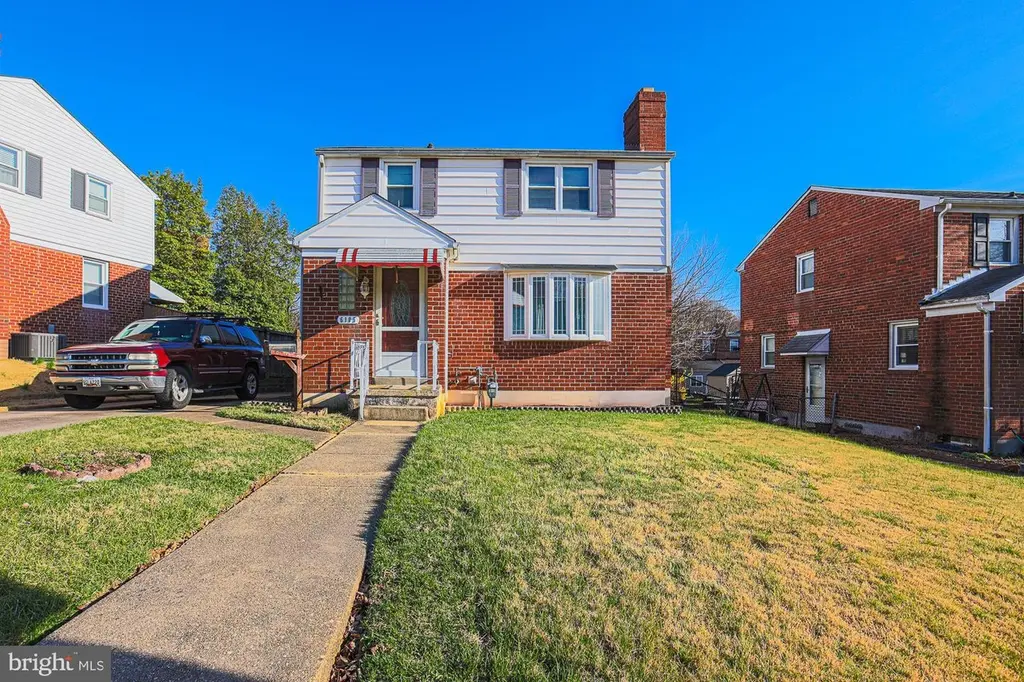
6105 Walther Ave · Baltimore, MD
Flood risk 1/10 · Minimal
- FEMA flood zone
- X (unshaded)
- Chance of flooding over 30 yrs
- 0.0%
- Est. flood insurance / yr
- $473 – $860
Fire risk 1/10 · Minimal
- Est. fire insurance / yr
- $755 – $1,403
Heat risk 7/10 · Major
- Hot days now (above 103°F)
- 7 days/yr
- Hot days in 30 yrs
- 14 days/yr
Wind risk 6/10 · Moderate
- Chance of severe wind over 30 yrs
- 27.0%
Air-quality risk 4/10 · Minor
- Unhealthy air days now
- 5 days/yr
- Unhealthy air days in 30 yrs
- 7 days/yr
Risk factors via First Street. Map © Google.
Why this score? — see what drove the D grade
The composite is a weighted blend of 9 inputs, each scored 0–100. Each bar is that input's sub-score; the figure is the points it added to the 100-point composite (weight × sub-score).
- Cash flow +13.9/30.0
- ARV discount +10.3/15.0
- DSCR +4.2/10.0
- 1% rule +3.9/10.0
- Livability +3.8/5.0
- Rent growth +3.6/5.0
- Condition / age +2.5/5.0
- Schools +1.0/10.0
- Appreciation +0.0/10.0
$245,000
🖨 Deal sheet (PDF) 📄 Offer letter ✓ Due diligence
Listing remarks
Rare opportunity to own a well-maintained single-family home in Baltimore City! Welcome to 6105 Walther Avenue, offering 3 bedrooms and 2 full baths with a flexible layout perfect for a variety of living situations. The main level features a bright and inviting living space, a functional kitchen with ample cabinetry, and comfortable bedrooms. The fully finished basement includes a private in-law suite with its own full bath—ideal for extended family, guests, or potential rental income. This home has been thoughtfully cared for and provides both space and versatility. Enjoy a private yard for relaxing or entertaining, along with convenient access to major commuter routes, shopping, din
Key facts
- 9,030 sq ft lot
- Built 1959
- Listed 11 days
Neighborhood map
What this means for you Summary
Snapshot
- This is a 3-bed/1.0-bath single-family listed at $245k.
Deal economics
- At list price, monthly cash flow is $29 ($342/yr) — positive.
- The deal already cash-flows at list — no discount required.
- To meet the 1% rule (rent ≥ 1% of price), the offer needs to be $218k (11.0% below list).
- Recommended offer: $218k (11.0% below list) — sets the bar for 1% rule.
Location & tenants
- Location reads 76/100 on livability (#90 in MD, #3,396 nationally) — a middle-class / working-renter tenant base. Strengths: amenities A+, commute A+, housing A+; Watch: schools D, crime F.
- Baltimore City Public Schools (urban): math 7% / reading 16% proficiency, ranked #24 of 24 in MD (top 100%) — low school quality limits family demand, transient renter base, plan for 1-2y turnover; 79% free/reduced lunch — lower-income household profile, screen leases tightly.
- Market conditions: Rents rising fast (+4.4%/yr); 180 active listings in the ZIP; 28 comparable units currently listed for rent nearby; rentals at typical pace (median 25d on market — plan ~3-4 weeks tenant-placement turnaround); 1,273 units permitted in Baltimore city in 2024 (1,104 in 5+ unit buildings).
- This rent runs 41% of the median local income ($65k/yr) — at the standard rent-burdened threshold; future hikes will face affordability resistance.
Forward outlook
- Local home prices are declining (-3.0%/yr); year-one equity from $2k of loan paydown is wiped out by about $7k of value loss. Plan a longer hold.
- Baltimore County population projected to shrink 4% by 2050 — rents likely to lag national; underwrite the cash flow, not the appreciation.
Negotiation context
- Only 11 days on market — expect competitive offers; lowballing is unlikely to land.
- Current owner paid $70k; list at $245k implies a 250% gain — meaningful room to come down on a strong offer.
Risks & watch-outs
- Watch-outs: built in 1959 — expect roof / HVAC / electrical / plumbing capex.
- Climate carrying-cost: major wind risk, 27% chance of damaging wind over 30y; extreme-heat days projected 7→14/yr by 2055 (HVAC capex compounding) — expect insurance premiums to compound above CPI over the hold.
Questions for the listing agent
- Built in 1959 — when were the roof, HVAC, electrical panel, plumbing, and water heater last replaced?
- Is there a deadline driving the sale (1031 exchange, divorce, estate, relocation)? That informs how much negotiation room exists.
- Schools are D-rated, which usually means shorter tenancies and higher turnover. Who's the typical renter profile here, and what's been the actual vacancy rate?
- Crime grade is F in this area — have there been break-ins, vandalism, or insurance claims at this property in the last 3 years? What carrier currently insures it and at what premium?
- The area grade is low — what's the realistic commute time and amenity access for the typical tenant pool here? Any planned neighborhood developments (good or bad) we should know about?
- What's the average days-on-market for RENTAL listings here right now (not sales)? A rising rental-DOM trend means longer vacancies and softer asking-rent achievability than the comps imply.
- What's the recent tenant-quality profile in this submarket — average credit score on applications, eviction rate, late-payment / NSF rate, and stable-employment percentage? A property-management company in the area should have these aggregated.
- How much new for-sale + rental construction is in the pipeline within 1–3 miles? Heavy new supply typically softens prices + rents 12–24 months out; constrained supply supports both.
Investment metrics
- 1% rule
- 0.89% ✗
- Cap rate
- 6.43%
- Cash-on-cash
- 0.50%
- DSCR
- 1.02
- GRM
- 9.4
CMA / ARV
- ARV (on-the-fly)
- $261,000
- Comps found
- 12
Show comp detail 12 sales within ~0.75 mi
| Address | Dist | Beds/Ba | Sqft | Sold | Price | $/sf | Match |
|---|---|---|---|---|---|---|---|
| 6105 Walther Ave | 0.00mi | 3/2.0 | 1,500 (0%) | 1mo | $250,000 | $167 | 95 |
| 4212 Mary Ave | 0.49mi | 3/3.0 | 1,430 (-5%) | 3mo | $286,999 | $201 | 59 |
| 6016 Burgess Ave | 0.60mi | 3/1.0 | 1,378 (-8%) | 1mo | $259,000 | $188 | 58 |
| 3203 Westfield Ave | 0.61mi | 3/2.0 | 1,412 (-6%) | 1mo | $275,000 | $195 | 56 |
| 6000 Glen Falls Ave | 0.21mi | 4/2.0 (+1) | 1,282 (-14%) | 3mo | $205,000 | $160 | 54 |
| 4412 Springwood Ave | 0.67mi | 3/1.5 | 1,624 (+8%) | 3mo | $295,000 | $182 | 51 |
| 4103 Glenmore Ave | 0.45mi | 4/2.5 (+1) | 1,666 (+11%) | 1mo | $280,000 | $168 | 48 |
| 6015 Sefton Ave | 0.52mi | 3/1.5 | 1,700 (+13%) | 4mo | $270,000 | $159 | 48 |
| 3800 E Northern Pkwy | 0.70mi | 4/2.0 (+1) | 1,408 (-6%) | 4mo | $305,000 | $217 | 45 |
| 3018 Mary Ave | 0.73mi | 3/1.5 | 1,320 (-12%) | 2mo | $230,000 | $174 | 42 |
| 6103 Glenoak Ave | 0.49mi | 4/3.0 (+1) | 1,704 (+14%) | 2mo | $286,400 | $168 | 40 |
| 4422 Forest View Ave | 0.69mi | 4/2.0 (+1) | 1,686 (+12%) | 4mo | $150,000 | $89 | 35 |
Match score weights: distance 35% · size 25% · config 20% · recency 20%. Top-matched comps best support the ARV.
Projected returns pro-forma
-3.0% appreciation · 4.43% rent growth · sell at horizon
- IRR
- -13.9%
- Equity multiple
- 0.49×
- Total profit
- $-34,669
- Equity at exit
- $36,530
- IRR
- -2.9%
- Equity multiple
- 0.79×
- Total profit
- $-14,269
- Equity at exit
- $21,183
Cash invested: $68,600 (down + closing). Projections, not guarantees.
Landlord ↔ Tenant lean methodology
- Overall (CITY)
- 12 Strongly Tenant-Friendly
- State Maryland
- 27 Tenant-Leaning · D+14
- County
- — inherits STATE
- City Baltimore
- 12 Strongly Tenant-Friendly · D+58
ZIP-level market 21206
- Rents YoY
- 4.4%
- Active inventory
- 180
- Price-to-rent
- 9.4×
Monthly cashflow live
- Estimated rent
- $2,181 high interval (Pro) →
- Mortgage (P&I)
- −$1,285
- Tax from tax record
- −$307 /mo · $3,689/yr
- Insurance
- −$102
- HOA
- −$0
- Vacancy / Maint / Mgmt
- −$458
- Net cashflow
- $29
Break-even live
Sensitivity live
| Price | -10% $167 | -5% $98 | +0% $29 | +5% $-41 | +10% $-110 |
|---|---|---|---|---|---|
| Rent | -10% $-144 | -5% $-58 | +0% $29 | +5% $115 | +10% $201 |
| Rate | -1.0pp $152 | -0.5pp $91 | base $29 | +0.5pp $-35 | +1.0pp $-100 |
UW: 25.0% down · 7.5% · 30yr · 1.5% tax · 5.0% vac · 8.0% maint · 8.0% mgmt
Financing live
Cash to close
- Down payment
- $61,250
- Closing costs
- $7,350
- Reserves months
- —
- Total cash needed
- —
Loan-product check · same deal, 3 products live
Conventional
25% down · 7.5% · 30yr
- Down + closing
- —
- Monthly P&I
- —
- Monthly cashflow
- —
- DSCR
- —
- Eligible?
- —
Personal DTI + credit; lowest rate.
DSCR
20% down · 8.5% · 30yr
- Down + closing
- —
- Monthly P&I
- —
- Monthly cashflow
- —
- DSCR
- —
- Eligible?
- —
No personal income docs; deal must DSCR.
Hard money
10% down · 12.0% · 12mo
- Down + closing
- —
- Monthly P&I
- —
- Monthly cashflow
- —
- DSCR
- —
- Eligible?
- —
Short-term bridge; refi at stabilization.
Rent comps 28 comps
| Address | Beds | Baths | Sqft | Rent | $/sqft | DOM | Units | Dist |
|---|---|---|---|---|---|---|---|---|
| 4111 Century Rd Baltimore, MD | 3.0 | 1.5 | 1432 | $2,500 | $1.75 | 44d | 1 | 0.36mi |
| 6410 Walther Ave Baltimore, MD | 2.0 | 1.0–2.0 | 1195 | $1,995 | $1.67 | 44d | 7 | 0.42mi |
| 3412 Fleetwood Ave Baltimore, MD | 3.0 | 2.5 | 1620 | $2,195 | $1.35 | 44d | 1 | 0.57mi |
| 3510 Hamilton Ave Baltimore, MD | 3.0 | 2.5 | 2100 | $2,300 | $1.10 | 24d | 1 | 0.64mi |
| 5632 Belair Rd Baltimore, MD | 3.0 | 1.5 | 1260 | $2,100 | $1.67 | 24d | 1 | 0.65mi |
| 4308 Hamilton Ave Baltimore, MD | 2.0 | 1.0 | 1110 | $1,416 | $1.28 | 24d | 1 | 0.70mi |
| 3721 Frankford Ave Baltimore, MD | 3.0 | 2.0 | 1600 | $2,050 | $1.28 | 44d | 1 | 0.78mi |
| 3158 Woodring Ave Parkville, MD | 3.0 | 1.5 | 1500 | $1,950 | $1.30 | 24d | 1 | 0.82mi |
| 3802 Biddison Ln Baltimore, MD | 4.0 | 1.5 | 1443 | $2,024 | $1.40 | 12d | 1 | 0.98mi |
| 3514 Ailsa Ave Baltimore, MD | 3.0 | 2.0 | 1800 | $2,200 | $1.22 | 44d | 1 | 1.02mi |
| 2805 Hamilton Ave Baltimore, MD | 4.0 | 2.0 | 1416 | $2,300 | $1.62 | 44d | 1 | 1.07mi |
| 2804 Christopher Ave Baltimore, MD | 3.0 | 2.5 | 1280 | $2,200 | $1.72 | 24d | 1 | 1.10mi |
| 4023 Belwood Ave Baltimore, MD | 3.0 | 1.0 | 1080 | $1,995 | $1.85 | 44d | 1 | 1.12mi |
| 5938 Clayton Ave Baltimore, MD | 4.0 | 2.0 | 1296 | $2,872 | $2.22 | 17d | 1 | 1.13mi |
| 5307 Valiquet Ave Unit A Baltimore, MD | 2.0 | 1.0 | 1672 | $1,375 | $0.82 | 44d | 1 | 1.15mi |
| 29 E Elm Ave Baltimore, MD | 3.0 | 2.0 | 2052 | $3,000 | $1.46 | 5d | 1 | 1.19mi |
| 4104 Parkwood Ave Baltimore, MD | 3.0 | 1.0 | 1224 | $2,800 | $2.29 | 24d | 1 | 1.19mi |
| 35-C Mopec Cir Nottingham, MD | 2.0 | 1.0 | 1100 | $1,445 | $1.31 | 3d | 10 | 1.21mi |
| 3309 Southern Ave Unit 2 Baltimore, MD | 2.0 | 1.0 | 1200 | $1,600 | $1.33 | 13d | 1 | 1.23mi |
| 2900 Ailsa Ave Apt 2 Baltimore, MD | 3.0 | 1.0 | 1300 | $1,750 | $1.35 | 5d | 1 | 1.25mi |
| 3108 Glendale Ave Parkville, MD | 3.0 | 3.0 | 1224 | $2,550 | $2.08 | 24d | 1 | 1.30mi |
| 2911 Shirey Ave Baltimore, MD | 4.0 | 2.0 | 1680 | $2,500 | $1.49 | 21d | 1 | 1.32mi |
| 2807 Shirey Ave Baltimore, MD | 4.0 | 3.0 | 1190 | $2,500 | $2.10 | 15d | 1 | 1.36mi |
| 6612 Birchwood Ave Baltimore, MD | 3.0 | 2.0 | 1122 | $2,300 | $2.05 | 20d | 1 | 1.36mi |
| 4718 Blue Ridge Ave Baltimore, MD | 4.0 | 3.0 | 1744 | $2,400 | $1.38 | 12d | 1 | 1.43mi |
| 4924 Frankford Ave Baltimore, MD | 4.0 | 2.0 | 1176 | $2,600 | $2.21 | 24d | 1 | 1.44mi |
| 5 Belhaven Dr Nottingham, MD | 4.0 | 1.5 | 1554 | $2,000 | $1.29 | 44d | 1 | 1.45mi |
| 4517 Woodlea Ave Baltimore, MD | 2.0 | 2.0 | 1326 | $1,900 | $1.43 | 3d | 1 | 1.48mi |
Listing history 3 events
-
2026-04-13status Pending
-
2026-04-02$245,000 Active
-
1985-09-16soldstatus $70,000
ⓘ Source: listings_history table (triggers on properties + properties_extension) + one-shot
backfill from property_details.listing_events for pre-trigger history.
Tax reassessment forecast MD · Partial reset (capped growth)
- Current annual tax
- $3,689 · $307/mo
- Projected year-2 tax
- $3,689 · $307/mo
- Expected delta
- $0/yr ($0/mo · 0.0%)
ⓘ Screening estimate from a state-policy table — verify with the county assessor before closing.
Climate risk First Street
- Flood 1/10 Low FEMA zone X (unshaded) · 0% chance over 30 yrs
- Wildfire 1/10 Low
- Heat 7/10 Severe 7 d/yr ≥103°F today · 14 d/yr by 30 yrs out
- Wind 6/10 Major 27% chance of damaging wind over 30 yrs
- Air quality 4/10 Moderate 5 unhealthy d/yr today · 7 by 30 yrs out
Nearby sold comps map
Loading sold comps map…
Walkable amenities ~0.75 mi
Loading nearby amenities…
Taxation est. · year 1
- Rental income
- $26,169
- − Mortgage interest
- −$13,724
- − Property taxes
- −$3,689
- − Insurance
- −$1,225
- − Repairs & maintenance
- −$2,094
- − Management
- −$2,094
- − Depreciation
- −$7,127
- Taxable loss
- −$3,783
- Est. tax savings @ 24.0%
- +$908
- After-tax cash flow
- $1,250/yr
For passive investors: Depreciation is non-cash, so a rental often shows a tax loss while cash-flowing — sheltering income. Rental losses are passive: they offset passive income freely, and up to $25,000/yr can offset ordinary (W-2) income if you actively participate and your MAGI is under $100k (phasing out to $0 by $150k); unused losses carry forward. On sale, claimed depreciation is recaptured at up to 25%, and gains may owe capital-gains tax (a 1031 exchange can defer both). Figures are a year-1 estimate at your 24.0% rate — not tax advice; consult a CPA.
Schools (NCES district)
- District
- Baltimore City Public Schools
- NCES district ID
- 2400090
- Math proficiency
- 7% ▼ -9.00%
- Reading proficiency
- 16% ▼ -5.00%
- Median HH income
- $42,108
- Composite
- 10.08/100
- National rank
- #9805
- State rank
- #24 of 24 in MD
Livability — Baltimore
- Score
- 76/100
- State rank
- #90
- US rank
- #3396
Category grades
Schools grade is shown separately in the Schools card above.
Census & demographics
- Census place
- Baltimore, MD
- County
- Baltimore City · 558,601 people
- City population
- 588,727
- Metro
- Baltimore-Columbia-Towson, MD
- Population (ZIP)
- 48,902
- Household income
- $64,531
- Rent vs Own
- Severe rent burden
- 2317.0
Population outlook (Baltimore County) Hauer SSP2
- Today (2025)
- 624,249 people
- By 2030
- 621,541 · -0.4%
- By 2040
- 609,756 · -2.3%
- By 2050
- 597,249 · -4.3%
- By 2075
- 552,236 · -11.5%
- By 2100
- 513,934 · -17.7%
Race, ethnicity, and origin ACS 2023
- Neighborhood character
- Predominantly Black (73%)
- Race & ethnicity
- Black 73% White 20% Two or more races 3% Hispanic / Latino 3% Asian 2%
- Common ancestry
- Romanian 3% Ukrainian 1%
- Foreign-born
- 8% · Canada
- Languages at home
- 92% English-only · Spanish 2% Arabic 2% Other Indo-European 1%
Political lean MEDSL · Baltimore
- 2024 margin
- Solid D (+73.0) · D 85.2% · R 12.2% · Other 2.6%
- 2008→2024 swing
- -2.5pp toward R · 2008: 75.5pp · 2024: 73.0pp
- All cycles
- 2024: D+73.0 2020: D+76.6 2016: D+74.6 2012: D+76.4 2008: D+75.5
Not yet ingested
- Civics
- —
Market trends
- HPI YoY
- ▼ -191.83%
- Current HPI
- 284.5645
- Rent YoY
- ▲ 4.43%
- Metro
- Baltimore-Columbia-Towson, MD
- State GDP YoY
- ▲ 2.97%
- F500 in state
- 12
Industry mix (Fortune 500 HQ in MD)
| Industry | F500 HQs | Revenue |
|---|---|---|
| Aerospace / Defense | 1 | $71B |
|
||
| Utilities | 1 | $25B |
|
||
| Hotels | 1 | $24B |
|
||
| Consumer Goods | 1 | $7B |
|
||
| Real Estate | 1 | $6B |
|
||
| Chemicals | 1 | $2B |
|
||
Price history
+250.0% since first listed3 events — show timeline
- 2026-04-13 Pending — BRIGHT MLS
- 2026-04-02 Listed $245,000 BRIGHT MLS
- 1985-09-16 Sold (Public Records) $70,000 Public Records
Property tax history
-0.9%/yrLatest (2025): $3,689 · +2.8% YoY. Source: county tax records.
Cash-flow waterfall
monthlySold comps — $/sqft
last 12 mo · ≤1 miLoading sold comps…