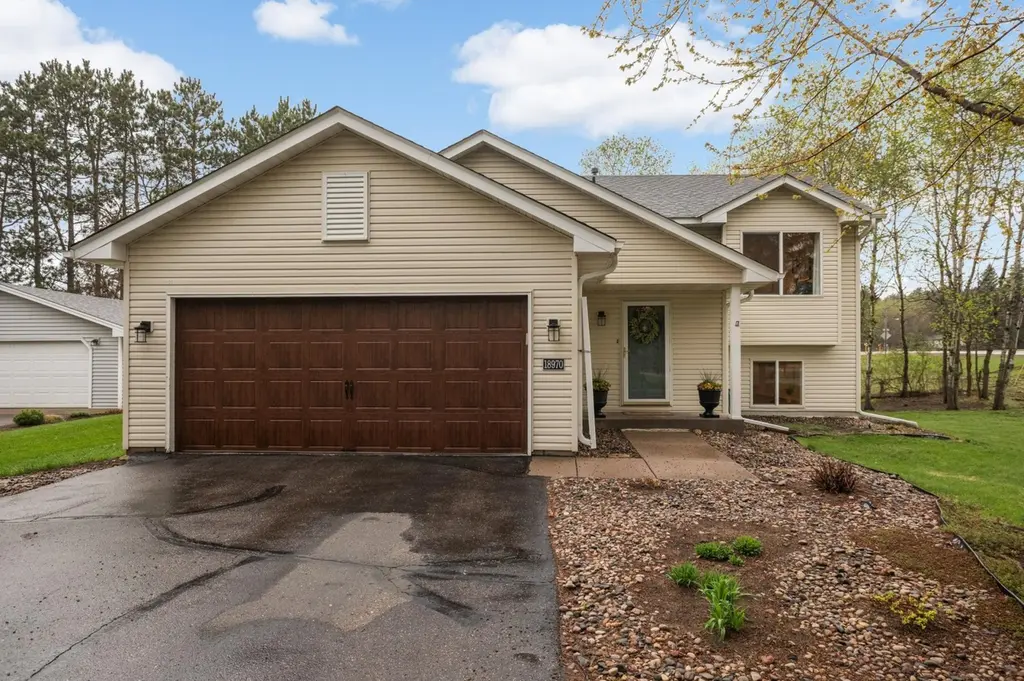
18970 Boston St NW · Elk River, MN
Flood risk 1/10 · Minimal
- FEMA flood zone
- X (unshaded)
- Chance of flooding over 30 yrs
- 0.0%
- Est. flood insurance / yr
- $473 – $860
Fire risk 2/10 · Minimal
- Est. fire insurance / yr
- $888 – $1,650
Heat risk 2/10 · Minimal
- Hot days now (above 98°F)
- 7 days/yr
- Hot days in 30 yrs
- 14 days/yr
Wind risk 2/10 · Minimal
- Chance of severe wind over 30 yrs
- —
Air-quality risk 2/10 · Minimal
- Unhealthy air days now
- 2 days/yr
- Unhealthy air days in 30 yrs
- 2 days/yr
Risk factors via First Street. Map © Google.
Why this score? — see what drove the D- grade
The composite is a weighted blend of 9 inputs, each scored 0–100. Each bar is that input's sub-score; the figure is the points it added to the 100-point composite (weight × sub-score).
- Cash flow +10.1/30.0
- ARV discount +7.5/15.0
- Schools +5.2/10.0
- Livability +3.6/5.0
- DSCR +2.9/10.0
- 1% rule +2.6/10.0
- Rent growth +2.5/5.0
- Condition / age +2.5/5.0
- Appreciation +0.0/10.0
$360,000
🖨 Deal sheet 📄 Offer letter ✓ Due diligence
Listing remarks MLS
Turn key & move-in ready home. Seller is a professional designer and it shows. Main level features include 3 bedrooms, large foyer, spacious living/dining area and large deck with pergola. Lower level features an expansive family room area, beautiful 3/4 bath and 2 additional beds. 5th bedroom is non-conforming due to lack of closet but has a legal egress. Recent updates include AC (2018), Water heater(2019), Newer Washer & Dryer and insulated garage door. Driveway was just sealed.
Key facts
- 0.29 acre lot
- 2 garage spots
- Built 1999
Neighborhood map
What this means for you Summary
Snapshot
- This is a 4-bed/2.0-bath single-family listed at $360k.
Deal economics
- At list price, monthly cash flow is $-213 ($-3k/yr) — negative.
- To cash-flow at today's rent, offer at most $322k (10.5% below list).
- To meet the 1% rule (rent ≥ 1% of price), the offer needs to be $272k (24.4% below list).
- Recommended offer: $272k (24.4% below list) — sets the bar for 1% rule.
- Cap rate 5.6% vs local median 3.4% in Elk River — top-decile yield for the area; either an underpriced asset or a hidden risk that comps aren't pricing in. Stress-test before assuming the spread holds.
Location & tenants
- Location reads 72/100 on livability (#265 in MN) — a middle-class / working-renter tenant base. Strengths: crime A+, employment A+, housing A+; Watch: amenities F, commute F, health & safety F.
- Independent School District 728 (suburban): math 56% / reading 60% proficiency, ranked #37 of 301 in MN (top 12%) — acceptable for families but not a draw, mixed tenant base, ~2y average lease; only 14% free/reduced lunch — higher-income household profile.
- Market conditions: 453 active listings in the ZIP; high-income renter base; 334 units permitted in Sherburne County in 2024 (58 in 5+ unit buildings).
Forward outlook
- Local home prices are declining (-3.0%/yr); year-one equity from $2k of loan paydown is wiped out by about $11k of value loss. Plan a longer hold.
Negotiation context
- Only 2 days on market — expect competitive offers; lowballing is unlikely to land.
- 4 sale attempts since 26y ago with the ask held roughly flat each time — persistent listings suggest the price (not the market) is what's stuck; bring a comps-based counter.
Questions for the listing agent
- What do current leases actually rent for vs. the listed asking? Can we see a recent rent roll and the last 12 months of T-12 income?
- Is there a deadline driving the sale (1031 exchange, divorce, estate, relocation)? That informs how much negotiation room exists.
- Schools are A-rated — typically a magnet for longer-tenancy family renters. What's the average tenant stay here, and is there a school-zone premium baked into asking?
- The area grade is low — what's the realistic commute time and amenity access for the typical tenant pool here? Any planned neighborhood developments (good or bad) we should know about?
- What's the average days-on-market for RENTAL listings here right now (not sales)? A rising rental-DOM trend means longer vacancies and softer asking-rent achievability than the comps imply.
- What's the recent tenant-quality profile in this submarket — average credit score on applications, eviction rate, late-payment / NSF rate, and stable-employment percentage? A property-management company in the area should have these aggregated.
- How much new for-sale + rental construction is in the pipeline within 1–3 miles? Heavy new supply typically softens prices + rents 12–24 months out; constrained supply supports both.
Investment metrics
- 1% rule
- 0.76% ✗
- Cap rate
- 5.58%
- Cash-on-cash
- -2.54%
- DSCR
- 0.89
- GRM
- 11.0
CMA / ARV
No comps found within radius.
Projected returns pro-forma
-3.0% appreciation · 3.0% rent growth · sell at horizon
- IRR
- -20.5%
- Equity multiple
- 0.29×
- Total profit
- $-71,948
- Equity at exit
- $53,677
- IRR
- -13.8%
- Equity multiple
- 0.20×
- Total profit
- $-80,276
- Equity at exit
- $31,126
Cash invested: $100,800 (down + closing). Projections, not guarantees.
Landlord ↔ Tenant lean methodology
- Overall (STATE)
- 46 Balanced
- State Minnesota
- 46 Balanced · D+2
- County
- — inherits STATE
- City
- — inherits STATE
ZIP-level market 55330
- Active inventory
- 453
- Price-to-rent
- 11.0×
Monthly cashflow live
- Estimated rent
- $2,723 medium interval (Pro) →
- Mortgage (P&I)
- −$1,888
- Tax from tax record
- −$326 /mo · $3,918/yr
- Insurance
- −$150
- HOA
- −$0
- Vacancy / Maint / Mgmt
- −$572
- Net cashflow
- $-213
Break-even live
UW: 25.0% down · 7.5% · 30yr · 1.5% tax · 5.0% vac · 8.0% maint · 8.0% mgmt
Financing live
Cash to close
- Down payment
- $90,000
- Closing costs
- $10,800
- Reserves months
- —
- Total cash needed
- —
Loan-product check · same deal, 3 products live
Conventional
25% down · 7.5% · 30yr
- Down + closing
- —
- Monthly P&I
- —
- Monthly cashflow
- —
- DSCR
- —
- Eligible?
- —
Personal DTI + credit; lowest rate.
DSCR
20% down · 8.5% · 30yr
- Down + closing
- —
- Monthly P&I
- —
- Monthly cashflow
- —
- DSCR
- —
- Eligible?
- —
No personal income docs; deal must DSCR.
Hard money
10% down · 12.0% · 12mo
- Down + closing
- —
- Monthly P&I
- —
- Monthly cashflow
- —
- DSCR
- —
- Eligible?
- —
Short-term bridge; refi at stabilization.
Listing history 16 events
-
2026-04-27status Pending
-
2026-04-25$360,000 Active
-
2026-04-24price $360,000
-
2026-04-23historical $354,900
-
2021-09-08soldstatus $319,276
-
2021-08-31historical 495-char remark
Show marketing remark (495 chars)
Turn key & move-in ready home. Seller is a professional designer and it shows. Main level features include 3 bedrooms, large foyer, spacious living/dining area and large deck with pergola. Lower level features an expansive family room area, beautiful 3/4 bath and 2 additional beds. 5th bedroom is non-conforming due to lack of closet but has a legal egress. Recent updates include AC (2018), Water heater(2019), Newer Washer & Dryer and insulated garage door. Driveway was just sealed.
-
2021-08-31soldstatus $319,275 Sold 495-char remark
Show marketing remark (495 chars)
Turn key & move-in ready home. Seller is a professional designer and it shows. Main level features include 3 bedrooms, large foyer, spacious living/dining area and large deck with pergola. Lower level features an expansive family room area, beautiful 3/4 bath and 2 additional beds. 5th bedroom is non-conforming due to lack of closet but has a legal egress. Recent updates include AC (2018), Water heater(2019), Newer Washer & Dryer and insulated garage door. Driveway was just sealed.
-
2021-07-22status Pending 495-char remark
Show marketing remark (495 chars)
Turn key & move-in ready home. Seller is a professional designer and it shows. Main level features include 3 bedrooms, large foyer, spacious living/dining area and large deck with pergola. Lower level features an expansive family room area, beautiful 3/4 bath and 2 additional beds. 5th bedroom is non-conforming due to lack of closet but has a legal egress. Recent updates include AC (2018), Water heater(2019), Newer Washer & Dryer and insulated garage door. Driveway was just sealed.
-
2021-07-20$314,900 Active 495-char remark
Show marketing remark (495 chars)
Turn key & move-in ready home. Seller is a professional designer and it shows. Main level features include 3 bedrooms, large foyer, spacious living/dining area and large deck with pergola. Lower level features an expansive family room area, beautiful 3/4 bath and 2 additional beds. 5th bedroom is non-conforming due to lack of closet but has a legal egress. Recent updates include AC (2018), Water heater(2019), Newer Washer & Dryer and insulated garage door. Driveway was just sealed.
-
2007-07-18historical
-
2007-04-24$204,900
-
2000-05-25soldstatus $141,366
-
2000-05-25soldstatus $141,366
-
2000-03-23historical
-
2000-03-17$139,900
-
1999-10-15soldstatus $30,000
ⓘ Source: listings_history table (triggers on properties + properties_extension) + one-shot
backfill from property_details.listing_events for pre-trigger history.
Tax reassessment forecast MN · Partial reset (capped growth)
- Current annual tax
- $3,918 · $326/mo
- Projected year-2 tax
- $3,975 · $331/mo
- Expected delta
- +$57/yr (+$5/mo · 1.5%)
ⓘ Screening estimate from a state-policy table — verify with the county assessor before closing.
Climate risk First Street
- Flood 1/10 Low FEMA zone X (unshaded) · 0% chance over 30 yrs
- Wildfire 2/10 Low
- Heat 2/10 Low 7 d/yr ≥98°F today · 14 d/yr by 30 yrs out
- Wind 2/10 Low
- Air quality 2/10 Low 2 unhealthy d/yr today · 2 by 30 yrs out
Nearby sold comps map
Loading sold comps map…
Walkable amenities ~0.75 mi
Loading nearby amenities…
Taxation est. · year 1
- Rental income
- $32,676
- − Mortgage interest
- −$20,166
- − Property taxes
- −$3,918
- − Insurance
- −$1,800
- − Repairs & maintenance
- −$2,614
- − Management
- −$2,614
- − Depreciation
- −$10,473
- Taxable loss
- −$8,908
- Est. tax savings @ 24.0%
- +$2,138
- After-tax cash flow
- $-420/yr
For passive investors: Depreciation is non-cash, so a rental often shows a tax loss while cash-flowing — sheltering income. Rental losses are passive: they offset passive income freely, and up to $25,000/yr can offset ordinary (W-2) income if you actively participate and your MAGI is under $100k (phasing out to $0 by $150k); unused losses carry forward. On sale, claimed depreciation is recaptured at up to 25%, and gains may owe capital-gains tax (a 1031 exchange can defer both). Figures are a year-1 estimate at your 24.0% rate — not tax advice; consult a CPA.
Schools (NCES district)
- District
- Independent School District 728
- NCES district ID
- 2711370
- Math proficiency
- 56% ▼ -15.00%
- Reading proficiency
- 60% ▼ -10.00%
- Median HH income
- $82,336
- Composite
- 52.5/100
- National rank
- #1567
- State rank
- #37 of 301 in MN
Livability — Elk River
- Score
- 72/100
- State rank
- #265
- US rank
- #5795
Category grades
Schools grade is shown separately in the Schools card above.
Census & demographics
- Census place
- Elk River, MN
- County
- Sherburne County · 120,363 people
- City population
- 45,721
- Metro
- Minneapolis-St. Paul-Bloomington, MN-WI
- Population (ZIP)
- 45,721
- Household income
- $115,761
- Rent vs Own
- Severe rent burden
- 285.0
Population outlook (Sherburne County) Hauer SSP2
- Today (2025)
- 97,402 people
- By 2030
- 99,341 · +2.0%
- By 2040
- 101,188 · +3.9%
- By 2050
- 99,214 · +1.9%
- By 2075
- 88,700 · -8.9%
- By 2100
- 72,241 · -25.8%
Race, ethnicity, and origin ACS 2023
- Neighborhood character
- Predominantly White (85%)
- Race & ethnicity
- White 85% Two or more races 6% Black 4% Hispanic / Latino 3% Asian 1%
- Common ancestry
- Portuguese 13% Romanian 6% Lithuanian 3%
- Foreign-born
- 5% · Canada, South Korea
- Languages at home
- 94% English-only · Spanish 2% Russian/Polish/Slavic 1% Other Asian/Pacific 1%
Political lean MEDSL · Sherburne
- 2024 margin
- Solid R (+34.9) · D 31.7% · R 66.6% · Other 1.7%
- 2008→2024 swing
- -16.7pp toward R · 2008: -18.2pp · 2024: -34.9pp
- All cycles
- 2024: R+34.9 2020: R+32.6 2016: R+37.0 2012: R+22.1 2008: R+18.2
Not yet ingested
- Civics
- —
Market trends
- HPI YoY
- ▼ -173.46%
- Current HPI
- 241.3028
- Rent YoY
- —
- Metro
- Minneapolis-St. Paul-Bloomington, MN-WI
- State GDP YoY
- ▲ 2.41%
- F500 in state
- 34
Industry mix (Fortune 500 HQ in MN)
| Industry | F500 HQs | Revenue |
|---|---|---|
| Healthcare | 2 | $407B |
|
||
| Retail | 2 | $150B |
|
||
| Consumer Goods | 2 | $32B |
|
||
| Industrial Machinery | 2 | $6B |
|
||
| Agriculture | 1 | $40B |
|
||
| Healthcare / Medical Devices | 1 | $32B |
|
||
Price history
+1100.0% since first listed16 events — show timeline
- 2026-04-27 Pending — NORTHSTARMLS as Distributed by MLS Grid
- 2026-04-25 Listed $360,000 NORTHSTARMLS as Distributed by MLS Grid
- 2026-04-24 Price Changed $360,000 NORTHSTARMLS as Distributed by MLS Grid
- 2026-04-23 Coming Soon $354,900 NORTHSTARMLS as Distributed by MLS Grid
- 2021-09-08 Sold (Public Records) $319,276 Public Records
- 2021-08-31 Listing Removed — NORTHSTARMLS as Distributed by MLS Grid
- 2021-08-31 Sold (MLS) $319,275 NORTHSTARMLS as Distributed by MLS Grid
- 2021-07-22 Pending — NORTHSTARMLS as Distributed by MLS Grid
- 2021-07-20 Listed $314,900 NORTHSTARMLS as Distributed by MLS Grid
- 2007-07-18 Listing Removed — NORTHSTARMLS as Distributed by MLS Grid
- 2007-04-24 Listed $204,900 NORTHSTARMLS as Distributed by MLS Grid
- 2000-05-25 Sold (Public Records) $141,366 Public Records
- 2000-05-25 Sold (MLS) $141,366 NORTHSTARMLS as Distributed by MLS Grid
- 2000-03-23 Listing Removed — NORTHSTARMLS as Distributed by MLS Grid
- 2000-03-17 Listed $139,900 NORTHSTARMLS as Distributed by MLS Grid
- 1999-10-15 Sold (Public Records) $30,000 Public Records
Property tax history
+5.4%/yrLatest (2025): $3,918 · +0.7% YoY. Source: county tax records.
Cash-flow waterfall
monthlySold comps — $/sqft
last 12 mo · ≤1 miLoading sold comps…