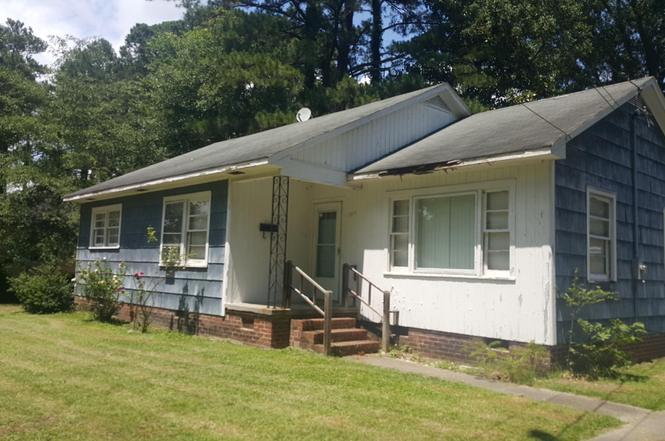
1117 Candlewood Dr · Kinston, NC
Flood risk 1/10 · Minimal
- FEMA flood zone
- X (unshaded)
- Chance of flooding over 30 yrs
- 0.0%
- Est. flood insurance / yr
- $507 – $1,088
Fire risk 2/10 · Minimal
- Est. fire insurance / yr
- $906 – $1,684
Heat risk 8/10 · Major
- Hot days now (above 107°F)
- 7 days/yr
- Hot days in 30 yrs
- 18 days/yr
Wind risk 8/10 · Major
- Chance of severe wind over 30 yrs
- 80.0%
Air-quality risk 2/10 · Minimal
- Unhealthy air days now
- 2 days/yr
- Unhealthy air days in 30 yrs
- 2 days/yr
Risk factors via First Street. Map © Google.
Why this score? — see what drove the D- grade
The composite is a weighted blend of 9 inputs, each scored 0–100. Each bar is that input's sub-score; the figure is the points it added to the 100-point composite (weight × sub-score).
- Cash flow +15.6/30.0
- ARV discount +4.9/15.0
- DSCR +4.8/10.0
- 1% rule +4.3/10.0
- Livability +2.8/5.0
- Rent growth +2.5/5.0
- Schools +2.5/10.0
- Condition / age +2.5/5.0
- Appreciation +0.0/10.0
$90,000
🖨 Deal sheet (PDF) 📄 Offer letter ✓ Due diligence
Listing remarks MLS
3 bed 1 bath single story home, with potential. Needs repairs. Cash, as is, where is, make an offer! No warranties or guarantees on heat pump or other major components.
Key facts
- Inviting kitchen
- Bright living area
- Large yard
Tags
Property features AI
Finance
- HOA & community: No HOA
Exterior
- Parking: Assigned parking
- Utilities: Water source: None listed; Sewer: None listed
- Home design: Single-family residence; One story; Site built construction; Composition roof; Zoning: RA6
- Construction: Site-built construction; Composition roof; Foundation: None listed; Built on one level
- Exterior features: Publicly maintained road access; Road surface: Other
Interior
- Bedrooms: 3 bedrooms (all on the main level)
- Bathrooms: 1 full bathroom (main level)
- Interior features: Heat pump heating; Central air conditioning; Appliances: Other
- Laundry & utility: No laundry features listed
Neighborhood map
What this means for you Summary
Snapshot
- This is a 3-bed/1.0-bath single-family listed at $90k.
Deal economics
- At list price, monthly cash flow is $38 ($453/yr) — positive.
- The deal already cash-flows at list — no discount required.
- To meet the 1% rule (rent ≥ 1% of price), the offer needs to be $84k (6.9% below list).
- Recommended offer: $84k (6.9% below list) — sets the bar for 1% rule.
- Cap rate 6.8% vs local median 3.8% in Kinston — top-decile yield for the area; either an underpriced asset or a hidden risk that comps aren't pricing in. Stress-test before assuming the spread holds.
Location & tenants
- Location reads 55/100 on livability (#640 in NC) — a working-class tenant base; expect higher turnover. Strengths: cost of living A+, health & safety A+, housing B+; Watch: crime F, amenities F, commute F.
- Lenoir County Public Schools (rural): math 29% / reading 32% proficiency, ranked #147 of 178 in NC (top 83%) — families likely to look elsewhere, expect single-tenant / working-renter base with shorter leases; 65% free/reduced lunch — lower-income household profile, screen leases tightly.
- Zoned schools: Northeast Elementary (math 6% / reading 12%, grade F, #1,393 of 1,410 statewide, top 99%, 442 students, 98% FRL); Rochelle Middle (math 9% / reading 20%, grade F, #462 of 475 statewide, top 98%, 466 students, 98% FRL); Kinston High (math 22% / reading 37%, grade F, #459 of 535 statewide, top 87%, 713 students, 100% FRL) — zoned schools average 98% FRL vs 65% district-wide (34 pts higher); higher-poverty schools than district average — tighter screening recommended.
- Zoned-school proficiency averages 18% at this address vs 30% district-wide (-13 pts) — the specific schools serving this property underperform the Lenoir County Public Schools average; the district grade overstates school quality for this exact location.
- Market conditions: 96 active listings in the ZIP; 1 comparable units currently listed for rent nearby; 148 units permitted in Lenoir County in 2024 (0 in 5+ unit buildings).
Forward outlook
- Local home prices are declining (-3.0%/yr); year-one equity from $622 of loan paydown is wiped out by about $3k of value loss. Plan a longer hold.
- Lenoir County population projected at -18% by 2050 — secular population decline; favor cash flow + early exit over multi-decade hold.
Negotiation context
- It's been on market 59 days — a 3% lower offer ($87k) is reasonable based on typical stale-listing flexibility.
- 3 sale attempts since 10y ago with the ask held roughly flat each time — persistent listings suggest the price (not the market) is what's stuck; bring a comps-based counter.
- Current owner paid $15k; list at $90k implies a 500% gain — meaningful room to come down on a strong offer.
Risks & watch-outs
- Watch-outs: built in 1954 — expect roof / HVAC / electrical / plumbing capex.
- Climate carrying-cost: severe wind risk, 80% chance of damaging wind over 30y; extreme-heat days projected 7→18/yr by 2055 (HVAC capex compounding) — expect insurance premiums to compound above CPI over the hold.
Questions for the listing agent
- It's been on market 59 days. Have you received any prior offers? Is the seller open to a 7% concession, seller financing, or rate buy-down credit?
- Built in 1954 — when were the roof, HVAC, electrical panel, plumbing, and water heater last replaced?
- Is there a deadline driving the sale (1031 exchange, divorce, estate, relocation)? That informs how much negotiation room exists.
- Schools are F-rated, which usually means shorter tenancies and higher turnover. Who's the typical renter profile here, and what's been the actual vacancy rate?
- Crime grade is F in this area — have there been break-ins, vandalism, or insurance claims at this property in the last 3 years? What carrier currently insures it and at what premium?
- The area grade is low — what's the realistic commute time and amenity access for the typical tenant pool here? Any planned neighborhood developments (good or bad) we should know about?
- What's the average days-on-market for RENTAL listings here right now (not sales)? A rising rental-DOM trend means longer vacancies and softer asking-rent achievability than the comps imply.
- What's the recent tenant-quality profile in this submarket — average credit score on applications, eviction rate, late-payment / NSF rate, and stable-employment percentage? A property-management company in the area should have these aggregated.
- How much new for-sale + rental construction is in the pipeline within 1–3 miles? Heavy new supply typically softens prices + rents 12–24 months out; constrained supply supports both.
Investment metrics
- 1% rule
- 0.93% ✗
- Cap rate
- 6.80%
- Cash-on-cash
- 1.80%
- DSCR
- 1.08
- GRM
- 8.9
CMA / ARV
- ARV (on-the-fly)
- $85,100
- Comps found
- 12
Show comp detail 12 sales within ~0.75 mi
| Address | Dist | Beds/Ba | Sqft | Sold | Price | $/sf | Match |
|---|---|---|---|---|---|---|---|
| 1203 Ferndale Ln | 0.15mi | 3/1.0 | 1,023 (-11%) | 8mo | $32,500 | $32 | 68 |
| 2104 Cecelia Ave | 0.54mi | 3/1.0 | 1,196 (+4%) | 5mo | $67,000 | $56 | 64 |
| 402 Marcella Dr | 0.56mi | 3/2.0 | 1,078 (-6%) | 3mo | $146,500 | $136 | 57 |
| 514 Greenmead Dr | 0.38mi | 2/1.0 (-1) | 1,038 (-10%) | 5mo | $77,500 | $75 | 56 |
| 1403 Lockwood Rd | 0.74mi | 3/2.0 | 1,113 (-3%) | 2mo | $141,000 | $127 | 55 |
| 616 Greenmead Dr | 0.23mi | 2/1.0 (-1) | 1,038 (-10%) | 16mo | $30,000 | $29 | 54 |
| 823 Dixon St | 0.67mi | 2/1.0 (-1) | 1,110 (-4%) | 11mo | $54,000 | $49 | 49 |
| 206 Pierce Rd | 0.69mi | 3/1.5 | 1,216 (+6%) | 14mo | $90,000 | $74 | 45 |
| 1210 Lockwood Rd | 0.53mi | 3/2.0 | 1,260 (+10%) | 19mo | $170,000 | $135 | 39 |
| 1801 Charlotte Ave | 0.63mi | 3/1.0 | 1,064 (-8%) | 24mo | $89,000 | $84 | 38 |
| 207 Pierce Rd | 0.72mi | 3/1.5 | 1,212 (+5%) | 21mo | $74,000 | $61 | 38 |
| 504 Jackson Ln | 0.68mi | 3/1.0 | 983 (-14%) | 15mo | $65,000 | $66 | 32 |
Match score weights: distance 35% · size 25% · config 20% · recency 20%. Top-matched comps best support the ARV.
Projected returns pro-forma
-3.0% appreciation · 3.0% rent growth · sell at horizon
- IRR
- -13.4%
- Equity multiple
- 0.52×
- Total profit
- $-12,167
- Equity at exit
- $13,419
- IRR
- -4.5%
- Equity multiple
- 0.70×
- Total profit
- $-7,444
- Equity at exit
- $7,782
Cash invested: $25,200 (down + closing). Projections, not guarantees.
Landlord ↔ Tenant lean methodology
- Overall (STATE)
- 85 Strongly Landlord-Friendly
- State North Carolina
- 85 Strongly Landlord-Friendly · R+3
- County
- — inherits STATE
- City
- — inherits STATE
ZIP-level market 28501
- Home prices YoY
- -18.9%
- Active inventory
- 96
- Price-to-rent
- 8.9×
Monthly cashflow live
- Estimated rent
- $838 medium interval (Pro) →
- Mortgage (P&I)
- −$472
- Tax from tax record
- −$115 /mo · $1,378/yr
- Insurance
- −$38
- HOA
- −$0
- Vacancy / Maint / Mgmt
- −$176
- Net cashflow
- $38
Break-even live
Sensitivity live
| Price | -10% $89 | -5% $63 | +0% $38 | +5% $12 | +10% $-13 |
|---|---|---|---|---|---|
| Rent | -10% $-28 | -5% $5 | +0% $38 | +5% $71 | +10% $104 |
| Rate | -1.0pp $83 | -0.5pp $61 | base $38 | +0.5pp $14 | +1.0pp $-9 |
UW: 25.0% down · 7.5% · 30yr · 1.5% tax · 5.0% vac · 8.0% maint · 8.0% mgmt
Financing live
Cash to close
- Down payment
- $22,500
- Closing costs
- $2,700
- Reserves months
- —
- Total cash needed
- —
Loan-product check · same deal, 3 products live
Conventional
25% down · 7.5% · 30yr
- Down + closing
- —
- Monthly P&I
- —
- Monthly cashflow
- —
- DSCR
- —
- Eligible?
- —
Personal DTI + credit; lowest rate.
DSCR
20% down · 8.5% · 30yr
- Down + closing
- —
- Monthly P&I
- —
- Monthly cashflow
- —
- DSCR
- —
- Eligible?
- —
No personal income docs; deal must DSCR.
Hard money
10% down · 12.0% · 12mo
- Down + closing
- —
- Monthly P&I
- —
- Monthly cashflow
- —
- DSCR
- —
- Eligible?
- —
Short-term bridge; refi at stabilization.
Rent comps 1 comps
| Address | Beds | Baths | Sqft | Rent | $/sqft | DOM | Units | Dist |
|---|---|---|---|---|---|---|---|---|
| 4015 N Herritage St Kinston, NC | 1.0–3.0 | 1.0–2.0 | 964 | $838 | $0.87 | 15d | 6 | 0.36mi |
Listing history 9 events
-
2026-05-05status Pending
-
2026-03-06$90,000 Active
-
2026-01-26price $89,000
-
2026-01-26historical
-
2026-01-05price $95,000
-
2025-12-05price $99,000
-
2025-11-18$115,000 Active
-
2017-03-02soldstatus $15,000 169-char remark
Show marketing remark (169 chars)
3 bed 1 bath single story home, with potential. Needs repairs. Cash, as is, where is, make an offer! No warranties or guarantees on heat pump or other major components.
-
2016-09-07$19,900 169-char remark
Show marketing remark (169 chars)
3 bed 1 bath single story home, with potential. Needs repairs. Cash, as is, where is, make an offer! No warranties or guarantees on heat pump or other major components.
ⓘ Source: listings_history table (triggers on properties + properties_extension) + one-shot
backfill from property_details.listing_events for pre-trigger history.
Tax reassessment forecast NC · Resets to sale price
- Current annual tax
- $1,378 · $115/mo
- Projected year-2 tax
- $1,378 · $115/mo
- Expected delta
- $0/yr ($0/mo · 0.0%)
ⓘ Screening estimate from a state-policy table — verify with the county assessor before closing.
Climate risk First Street
- Flood 1/10 Low FEMA zone X (unshaded) · 0% chance over 30 yrs
- Wildfire 2/10 Low
- Heat 8/10 Severe 7 d/yr ≥107°F today · 18 d/yr by 30 yrs out
- Wind 8/10 Severe 80% chance of damaging wind over 30 yrs
- Air quality 2/10 Low 2 unhealthy d/yr today · 2 by 30 yrs out
Nearby sold comps map
Loading sold comps map…
Walkable amenities ~0.75 mi
Loading nearby amenities…
Taxation est. · year 1
- Rental income
- $10,056
- − Mortgage interest
- −$5,041
- − Property taxes
- −$1,378
- − Insurance
- −$450
- − Repairs & maintenance
- −$804
- − Management
- −$804
- − Depreciation
- −$2,618
- Taxable loss
- −$1,040
- Est. tax savings @ 24.0%
- +$250
- After-tax cash flow
- $702/yr
For passive investors: Depreciation is non-cash, so a rental often shows a tax loss while cash-flowing — sheltering income. Rental losses are passive: they offset passive income freely, and up to $25,000/yr can offset ordinary (W-2) income if you actively participate and your MAGI is under $100k (phasing out to $0 by $150k); unused losses carry forward. On sale, claimed depreciation is recaptured at up to 25%, and gains may owe capital-gains tax (a 1031 exchange can defer both). Figures are a year-1 estimate at your 24.0% rate — not tax advice; consult a CPA.
Schools (NCES district)
- District
- Lenoir County Public Schools
- NCES district ID
- 3702610
- Math proficiency
- 29% ▲ 1.00%
- Reading proficiency
- 32% ▼ -4.00%
- Median HH income
- $34,958
- Composite
- 25.17/100
- National rank
- #7515
- State rank
- #147 of 178 in NC
Livability — Kinston
- Score
- 55/100
- State rank
- #640
- US rank
- #23267
Category grades
Schools grade is shown separately in the Schools card above.
Census & demographics
- Census place
- Kinston, NC
- City population
- 20,407
- Population (ZIP)
- 18,112
Population outlook (Lenoir County) Hauer SSP2
- Today (2025)
- 55,002 people
- By 2030
- 53,048 · -3.6%
- By 2040
- 49,041 · -10.8%
- By 2050
- 45,136 · -17.9%
- By 2075
- 36,547 · -33.6%
- By 2100
- 27,731 · -49.6%
Race, ethnicity, and origin ACS 2023
- Neighborhood character
- Majority Black (62%)
- Race & ethnicity
- Black 62% White 26% Two or more races 6% Hispanic / Latino 5%
- Common ancestry
- Serbian 1% Italian 1%
- Foreign-born
- 2% · Canada, China
- Languages at home
- 95% English-only · Spanish 5%
Political lean MEDSL · Lenoir
- 2024 margin
- Lean R (+6.8) · D 46.2% · R 53.0%
- 2008→2024 swing
- -6.7pp toward R · 2008: -0.1pp · 2024: -6.8pp
- All cycles
- 2024: R+6.8 2020: R+3.5 2016: R+6.3 2012: R+1.5 2008: R+0.1
Not yet ingested
- Civics
- —
Market trends
- HPI YoY
- ▼ -45.17%
- Current HPI
- 193.3213
- Rent YoY
- —
- Metro
- —
- State GDP YoY
- ▲ 3.28%
- F500 in state
- 26
Industry mix (Fortune 500 HQ in NC)
| Industry | F500 HQs | Revenue |
|---|---|---|
| Financial Services | 2 | $213B |
|
||
| Retail | 2 | $95B |
|
||
| Industrial Conglomerate | 1 | $38B |
|
||
| Metals / Steel | 1 | $35B |
|
||
| Utilities | 1 | $30B |
|
||
| Industrial Machinery | 1 | $19B |
|
||
Price history
+352.3% since first listed9 events — show timeline
- 2026-05-05 Pending — CANOPYMLS as Distributed by MLS Grid
- 2026-03-06 Listed $90,000 CANOPYMLS as Distributed by MLS Grid
- 2026-01-26 Price Changed $89,000 Hive MLS
- 2026-01-26 Listing Removed — Hive MLS
- 2026-01-05 Price Changed $95,000 Hive MLS
- 2025-12-05 Price Changed $99,000 Hive MLS
- 2025-11-18 Listed $115,000 Hive MLS
- 2017-03-02 Sold (MLS) $15,000 Hive MLS
- 2016-09-07 Listed $19,900 Hive MLS
Property tax history
+9.2%/yrLatest (2025): $1,378 · +263.6% YoY. Source: county tax records.
Cash-flow waterfall
monthlySold comps — $/sqft
last 12 mo · ≤1 miLoading sold comps…