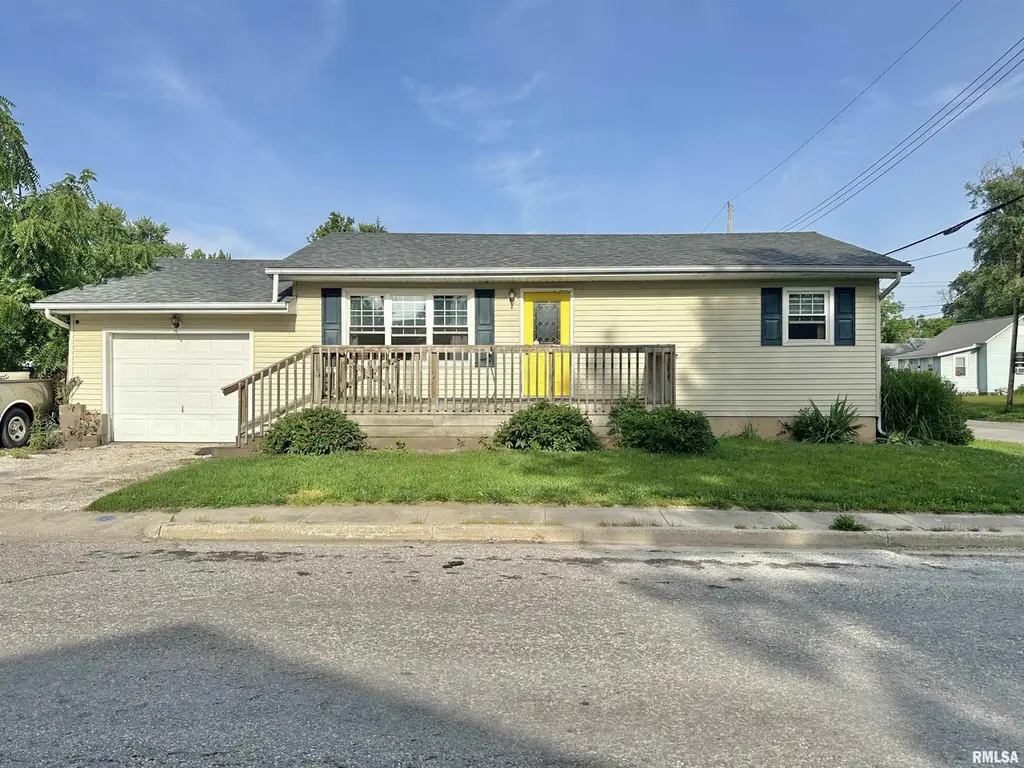
525 N Illinois St · Pittsfield, IL
Flood risk 5/10 · Moderate
- FEMA flood zone
- X (unshaded)
- Chance of flooding over 30 yrs
- 0.67%
- Est. flood insurance / yr
- $473 – $860
Fire risk 1/10 · Minimal
- Est. fire insurance / yr
- $804 – $1,492
Heat risk 4/10 · Minor
- Hot days now (above 106°F)
- 7 days/yr
- Hot days in 30 yrs
- 18 days/yr
Wind risk 2/10 · Minimal
- Chance of severe wind over 30 yrs
- 1.0%
Air-quality risk 2/10 · Minimal
- Unhealthy air days now
- 1 days/yr
- Unhealthy air days in 30 yrs
- 1 days/yr
Risk factors via First Street. Map © Google.
Why this score? — see what drove the B- grade
The composite is a weighted blend of 9 inputs, each scored 0–100. Each bar is that input's sub-score; the figure is the points it added to the 100-point composite (weight × sub-score).
- Cash flow +28.7/30.0
- DSCR +10.0/10.0
- 1% rule +8.7/10.0
- ARV discount +7.5/15.0
- Appreciation +3.3/10.0
- Livability +3.1/5.0
- Rent growth +2.5/5.0
- Condition / age +2.5/5.0
- Schools +1.2/10.0
$65,000
🖨 Deal sheet (PDF) 📄 Offer letter ✓ Due diligence
Listing remarks
Charming 2-bedroom, 1-bath home in Pittsfield with great curb appeal, tons of potential, and priced to sell quickly! Enjoy relaxing on the welcoming front porch or entertaining on the back deck overlooking the cute yard. Inside, you’ll find an open-concept kitchen, dining, and living room area that creates a convenient space for everyday living. The home also features a small attached garage and a full basement offering plenty of storage or the opportunity to easily create additional bedrooms or living space. With just a few repairs, this home could be move-in ready and make a fantastic investment or perfect place to call home! Being sold "As Is". Please allow for a closing
Key facts
- Open-concept kitchen
- Front porch
- Full basement
Tags
Property features AI
Exterior
- Parking: Attached garage with 1 garage space; Parking pad
- Utilities: Public water; Public sewer; Electric service
- Home design: Single-family residence; Built in 1970; 1 story (living area listed as 988); Shingle roof
- Construction: Shingle roof; Not new construction
- Exterior features: Corner lot; Lot dimensions approximately 71 x 100
Interior
- Kitchen: Kitchen on main level; Includes microwave and refrigerator
- Bedrooms: 2 bedrooms (both on the main level; each with egress window)
- Flooring: Tile flooring in bedrooms and kitchen
- Bathrooms: 1 full bathroom
- Heating & cooling: Radiant heat; Window unit(s)
- Interior features: Full, unfinished basement; Microwave; Refrigerator; No fireplace
- Laundry & utility: Laundry room in basement; Electric water heater
Neighborhood map
What this means for you Summary
Snapshot
- This is a 2-bed/1.0-bath other listed at $65k.
Deal economics
- At list price, monthly cash flow is $216 ($3k/yr) — positive.
- The deal already cash-flows at list — no discount required.
- Meets the 1% rule at list price ($889 rent vs $65k).
Location & tenants
- Location reads 62/100 on livability (#828 in IL) — a middle-class / working-renter tenant base. Strengths: cost of living A+, housing A+, crime A-; Watch: amenities F, commute F, employment D-.
- Pikeland CUSD 10 (town): math 11% / reading 18% proficiency, ranked #529 of 620 in IL (top 85%) — low school quality limits family demand, transient renter base, plan for 1-2y turnover.
- Zoned schools: Pittsfield High School (math 12% / reading 22%, grade F, #430 of 693 statewide, top 66%, 344 students, 0% FRL) — zoned schools average 0% FRL vs 42% district-wide (42 pts lower); this property's tenant base skews higher-income than the district average.
- Market conditions: 7 active listings in the ZIP; 20 units permitted in Pike County in 2024 (0 in 5+ unit buildings).
Forward outlook
- Local home prices are declining (-3.0%/yr); year-one equity from $449 of loan paydown is wiped out by about $2k of value loss. Plan a longer hold.
- Pike County population projected at -19% by 2050 — secular population decline; favor cash flow + early exit over multi-decade hold.
- At projected returns (-3.0% appreciation + 3.0% rent growth), your $18k cash investment doubles in ~9 years — after that, you're playing with house money.
Negotiation context
- Only 4 days on market — expect competitive offers; lowballing is unlikely to land.
Risks & watch-outs
- Climate carrying-cost: moderate flood risk — expect insurance premiums to compound above CPI over the hold.
Questions for the listing agent
- Built in 1970 — when were the roof, HVAC, electrical panel, plumbing, and water heater last replaced?
- Is there a deadline driving the sale (1031 exchange, divorce, estate, relocation)? That informs how much negotiation room exists.
- Schools are F-rated, which usually means shorter tenancies and higher turnover. Who's the typical renter profile here, and what's been the actual vacancy rate?
- What's the average days-on-market for RENTAL listings here right now (not sales)? A rising rental-DOM trend means longer vacancies and softer asking-rent achievability than the comps imply.
- What's the recent tenant-quality profile in this submarket — average credit score on applications, eviction rate, late-payment / NSF rate, and stable-employment percentage? A property-management company in the area should have these aggregated.
- How much new for-sale + rental construction is in the pipeline within 1–3 miles? Heavy new supply typically softens prices + rents 12–24 months out; constrained supply supports both.
Investment metrics
- 1% rule
- 1.37% ✓
- Cap rate
- 10.29%
- Cash-on-cash
- 14.27%
- DSCR
- 1.63
- GRM
- 6.1
CMA / ARV
No comps found within radius.
Projected returns pro-forma
-3.0% appreciation · 3.0% rent growth · sell at horizon
- IRR
- 4.7%
- Equity multiple
- 1.18×
- Total profit
- $3,285
- Equity at exit
- $9,692
- IRR
- 14.2%
- Equity multiple
- 2.14×
- Total profit
- $20,753
- Equity at exit
- $5,620
Cash invested: $18,200 (down + closing). Projections, not guarantees.
Landlord ↔ Tenant lean methodology
- Overall (STATE)
- 43 Moderately Tenant-Leaning
- State Illinois
- 43 Moderately Tenant-Leaning · D+7
- County
- — inherits STATE
- City
- — inherits STATE
ZIP-level market 62363
- Home prices YoY
- -2.1%
- Active inventory
- 7
- Price-to-rent
- 6.1×
Monthly cashflow live
- Estimated rent
- $889 medium interval (Pro) →
- Mortgage (P&I)
- −$341
- Tax from tax record
- −$118 /mo · $1,415/yr
- Insurance
- −$27
- HOA
- −$0
- Vacancy / Maint / Mgmt
- −$187
- Net cashflow
- $216
Break-even live
Sensitivity live
| Price | -10% $253 | -5% $235 | +0% $216 | +5% $198 | +10% $180 |
|---|---|---|---|---|---|
| Rent | -10% $146 | -5% $181 | +0% $216 | +5% $251 | +10% $287 |
| Rate | -1.0pp $249 | -0.5pp $233 | base $216 | +0.5pp $200 | +1.0pp $182 |
UW: 25.0% down · 7.5% · 30yr · 1.5% tax · 5.0% vac · 8.0% maint · 8.0% mgmt
Financing live
Cash to close
- Down payment
- $16,250
- Closing costs
- $1,950
- Reserves months
- —
- Total cash needed
- —
Loan-product check · same deal, 3 products live
Conventional
25% down · 7.5% · 30yr
- Down + closing
- —
- Monthly P&I
- —
- Monthly cashflow
- —
- DSCR
- —
- Eligible?
- —
Personal DTI + credit; lowest rate.
DSCR
20% down · 8.5% · 30yr
- Down + closing
- —
- Monthly P&I
- —
- Monthly cashflow
- —
- DSCR
- —
- Eligible?
- —
No personal income docs; deal must DSCR.
Hard money
10% down · 12.0% · 12mo
- Down + closing
- —
- Monthly P&I
- —
- Monthly cashflow
- —
- DSCR
- —
- Eligible?
- —
Short-term bridge; refi at stabilization.
Listing history 5 events
-
2026-06-01status $65,000 Pending 4 DOM
-
2026-06-01days on market $65,000 Active 4 DOM
-
2026-05-31days on market $65,000 Active 3 DOM
-
2026-05-31days on market $65,000 Active 2 DOM
-
2026-05-27$65,000 Active
ⓘ Source: listings_history table (triggers on properties + properties_extension) + one-shot
backfill from property_details.listing_events for pre-trigger history.
Tax reassessment forecast IL · Partial reset (capped growth)
- Current annual tax
- $1,415 · $118/mo
- Projected year-2 tax
- $1,445 · $120/mo
- Expected delta
- +$30/yr (+$3/mo · 2.1%)
ⓘ Screening estimate from a state-policy table — verify with the county assessor before closing.
Climate risk First Street
- Flood 5/10 Major FEMA zone X (unshaded) · 67% chance over 30 yrs
- Wildfire 1/10 Low
- Heat 4/10 Moderate 7 d/yr ≥106°F today · 18 d/yr by 30 yrs out
- Wind 2/10 Low 100% chance of damaging wind over 30 yrs
- Air quality 2/10 Low 1 unhealthy d/yr today · 1 by 30 yrs out
Nearby sold comps map
Loading sold comps map…
Walkable amenities ~0.75 mi
Loading nearby amenities…
Taxation est. · year 1
- Rental income
- $10,667
- − Mortgage interest
- −$3,641
- − Property taxes
- −$1,415
- − Insurance
- −$325
- − Repairs & maintenance
- −$853
- − Management
- −$853
- − Depreciation
- −$1,891
- Taxable income
- $1,688
- Est. tax owed @ 24.0%
- −$405
- After-tax cash flow
- $2,191/yr
For passive investors: Depreciation is non-cash, so a rental often shows a tax loss while cash-flowing — sheltering income. Rental losses are passive: they offset passive income freely, and up to $25,000/yr can offset ordinary (W-2) income if you actively participate and your MAGI is under $100k (phasing out to $0 by $150k); unused losses carry forward. On sale, claimed depreciation is recaptured at up to 25%, and gains may owe capital-gains tax (a 1031 exchange can defer both). Figures are a year-1 estimate at your 24.0% rate — not tax advice; consult a CPA.
Schools (NCES district)
- District
- Pikeland CUSD 10
- NCES district ID
- 1731710
- Math proficiency
- 11% ▼ -3.00%
- Reading proficiency
- 18% ▼ -16.00%
- Median HH income
- $39,658
- Composite
- 12.34/100
- National rank
- #9639
- State rank
- #529 of 620 in IL
Livability — Pittsfield
- Score
- 62/100
- State rank
- #828
- US rank
- #16340
Category grades
Schools grade is shown separately in the Schools card above.
Census & demographics
- Census place
- Pittsfield, IL
- Population (ZIP)
- 5,487
Population outlook (Pike County) Hauer SSP2
- Today (2025)
- 15,069 people
- By 2030
- 14,505 · -3.7%
- By 2040
- 13,340 · -11.5%
- By 2050
- 12,159 · -19.3%
- By 2075
- 9,227 · -38.8%
- By 2100
- 6,064 · -59.8%
Race, ethnicity, and origin ACS 2023
- Neighborhood character
- Predominantly White (96%)
- Race & ethnicity
- White 96% Hispanic / Latino 2% Two or more races 1%
- Common ancestry
- Slovak 3% Lithuanian 2% Iranian 1%
- Foreign-born
- 1% · Canada
- Languages at home
- 98% English-only · Other Indo-European 1% Spanish 1% Tagalog/Filipino 1%
Political lean MEDSL · Pike
- 2024 margin
- Solid R (+63.7) · D 17.4% · R 81.1% · Other 1.6%
- 2008→2024 swing
- -44.9pp toward R · 2008: -18.8pp · 2024: -63.7pp
- All cycles
- 2024: R+63.7 2020: R+60.9 2016: R+58.2 2012: R+35.4 2008: R+18.8
Not yet ingested
- Civics
- —
Market trends
- HPI YoY
- ▼ -3.43%
- Current HPI
- 157.1236
- Rent YoY
- —
- Metro
- —
- State GDP YoY
- ▲ 1.59%
- F500 in state
- 60
Industry mix (Fortune 500 HQ in IL)
| Industry | F500 HQs | Revenue |
|---|---|---|
| Insurance | 4 | $201B |
|
||
| Consumer Goods | 4 | $87B |
|
||
| Industrial Machinery | 3 | $64B |
|
||
| Healthcare | 2 | $55B |
|
||
| Retail / Pharmacy | 1 | $148B |
|
||
| Agriculture / Food | 1 | $86B |
|
||
Price history
1 event — show timeline
- 2026-05-27 Listed $65,000 RMLSA as Distributed by MLS Grid
Property tax history
+2.1%/yrLatest (2024): $1,415 · +9.0% YoY. Source: county tax records.
Cash-flow waterfall
monthlySold comps — $/sqft
last 12 mo · ≤1 miLoading sold comps…