 5-Plex
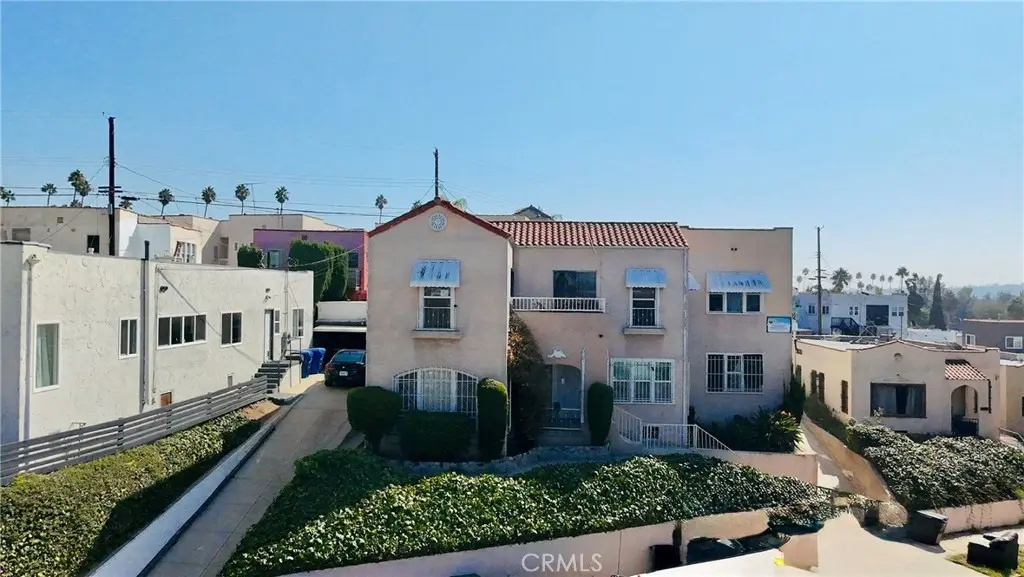
2116 S Palm Grove Ave · Los Angeles, CA
Flood risk 1/10 · Minimal
- FEMA flood zone
- X (unshaded)
- Chance of flooding over 30 yrs
- 0.0%
- Est. flood insurance / yr
- $507 – $1,088
Fire risk 1/10 · Minimal
- Est. fire insurance / yr
- $659 – $1,223
Heat risk 6/10 · Moderate
- Hot days now (above 89°F)
- 7 days/yr
- Hot days in 30 yrs
- 21 days/yr
Wind risk 1/10 · Minimal
- Chance of severe wind over 30 yrs
- —
Air-quality risk 5/10 · Moderate
- Unhealthy air days now
- 7 days/yr
- Unhealthy air days in 30 yrs
- 7 days/yr
Risk factors via First Street. Map © Google.
Why this score? — see what drove the B grade
The composite is a weighted blend of 9 inputs, each scored 0–100. Each bar is that input's sub-score; the figure is the points it added to the 100-point composite (weight × sub-score).
- Cash flow +30.0/30.0
- ARV discount +12.3/15.0
- 1% rule +10.0/10.0
- DSCR +10.0/10.0
- Schools +3.6/10.0
- Livability +3.4/5.0
- Rent growth +2.8/5.0
- Condition / age +2.5/5.0
- Appreciation +0.0/10.0
$1,395,000
🖨 Deal sheet 📄 Offer letter ✓ Due diligence
Multi-family units
County records classify this as Multi-Family (5+ Unit). Listing-text estimate: 5 units. confirmed
5+ unit building — per-unit beds/baths from public records are typically unavailable; the breakdown below (if shown) is an estimate from the listing text.
Listing remarks MLS
Welcome to this incredible value in Mid City, Fantastic investment opportunity in the rapidly growing Mid City market! This well-maintained 5 units feature over 5000 square feet of unique construction, creating strong value-add potential, 2 units were recently fully renovated the property is strategically positioned in the most appealing, high growth areas from Downtown L. A. to Culver City's Tech Hub, the neighborhood is experiencing a rapid growth of multifamily development. This property offers amazing tenant convenience Located in a high-demand rental market, this property is ideal for investors seeking steady income and long-term growth.
Key facts
- On site parking
- Private outdoor area
- Prime location
Tags
Neighborhood map
What this means for you Summary
Snapshot
- This is a 5 × 7-bed/5.0-bath units multifamily listed at $1.40M.
Deal economics
- At list price, monthly cash flow is $17k ($202k/yr) — positive. Per door: $3k/mo.
- The deal already cash-flows at list — no discount required.
- Meets the 1% rule at list price ($33k rent vs $1.40M).
- Recommended offer: $1.23M (12.0% below list) — sets the bar for market timing.
- Cap rate 20.8% vs local median 2.1% in Los Angeles — top-decile yield for the area; either an underpriced asset or a hidden risk that comps aren't pricing in. Stress-test before assuming the spread holds.
Location & tenants
- Location reads 68/100 on livability (#273 in CA) — a middle-class / working-renter tenant base. Strengths: amenities A+, commute A+, employment B; Watch: health & safety C-, schools D+, crime F.
- Los Angeles Unified (urban): math 29% / reading 54% proficiency, ranked #223 of 517 in CA (top 43%) — families likely to look elsewhere, expect single-tenant / working-renter base with shorter leases; 67% free/reduced lunch — lower-income household profile, screen leases tightly.
- Market conditions: Rents rising (+1.1%/yr); 149 active listings in the ZIP; 40 comparable units currently listed for rent nearby; rentals lingering (median 44d on market — plan ~5-8 weeks vacancy on turnover, expect pricing pressure); 55% of comp listings sitting > 30 days — soft ceiling on asking rent; 19,697 units permitted in Los Angeles County in 2024 (9,426 in 5+ unit buildings).
- At $33,162/mo this rent would consume 541% of the median local household income ($74k/yr) (locally 3450% of renters already pay >50% of income on rent) — very limited rent-growth headroom before tenants either downsize or default.
Forward outlook
- Local home prices are declining (-3.0%/yr); year-one equity from $10k of loan paydown is wiped out by about $42k of value loss. Plan a longer hold.
- Los Angeles County population projected at +9% by 2050 — modest demand growth; plan on rents tracking national, not racing it.
- At projected returns (-3.0% appreciation + 1.1% rent growth), your $391k cash investment doubles in ~3 years — after that, you're playing with house money.
Negotiation context
- It's been on market 233 days — a 12% lower offer ($1.23M) is reasonable based on typical stale-listing flexibility.
- 8 sale attempts since 11y ago with the ask held roughly flat each time — persistent listings suggest the price (not the market) is what's stuck; bring a comps-based counter.
- Current owner paid $1.20M; 16% above their basis — modest negotiation headroom, anchor on the comps not their cost.
Risks & watch-outs
- Watch-outs: built in 1924 — expect roof / HVAC / electrical / plumbing capex.
- Climate carrying-cost: extreme-heat days projected 7→21/yr by 2055 (HVAC capex compounding) — expect insurance premiums to compound above CPI over the hold.
Questions for the listing agent
- It's been on market 233 days. Have you received any prior offers? Is the seller open to a 12% concession, seller financing, or rate buy-down credit?
- Can we see the unit-by-unit rent roll, current vacancy, and any below-market leases? What's the average tenancy length?
- What capital expenditures (roof, boiler, parking lot, exteriors) have been made in the last 5 years, and what's planned in the next 2?
- Built in 1924 — when were the roof, HVAC, electrical panel, plumbing, and water heater last replaced?
- Why hasn't it sold? Are there any deal-killer items the seller is aware of (foundation, flood, title, zoning, code violations)?
- Is there a deadline driving the sale (1031 exchange, divorce, estate, relocation)? That informs how much negotiation room exists.
- Schools are D-rated, which usually means shorter tenancies and higher turnover. Who's the typical renter profile here, and what's been the actual vacancy rate?
- Crime grade is F in this area — have there been break-ins, vandalism, or insurance claims at this property in the last 3 years? What carrier currently insures it and at what premium?
- What's the average days-on-market for RENTAL listings here right now (not sales)? A rising rental-DOM trend means longer vacancies and softer asking-rent achievability than the comps imply.
- What's the recent tenant-quality profile in this submarket — average credit score on applications, eviction rate, late-payment / NSF rate, and stable-employment percentage? A property-management company in the area should have these aggregated.
- How much new apartment / multifamily construction is in the pipeline within 1–3 miles? Heavy new supply (>2% of stock underway) typically softens rents 12–24 months out; light construction supports rent growth.
Investment metrics
- 1% rule
- 2.38% ✓
- Cap rate
- 20.80%
- Cash-on-cash
- 51.81%
- DSCR
- 3.31
- GRM
- 3.5
CMA / ARV
- ARV (median comp)
- $1,563,401
- List price
- $1,395,000
- Delta
- -10.77%
- Verdict
- UNDERPRICED
- Comps
- 20 within 1.0 mi
Projected returns pro-forma
-3.0% appreciation · 1.12% rent growth · sell at horizon
- IRR
- 47.6%
- Equity multiple
- 3.01×
- Total profit
- $786,713
- Equity at exit
- $207,999
- IRR
- 52.5%
- Equity multiple
- 5.67×
- Total profit
- $1,825,994
- Equity at exit
- $120,614
Cash invested: $390,600 (down + closing). Projections, not guarantees.
Landlord ↔ Tenant lean methodology
- Overall (CITY)
- 0 Strongly Tenant-Friendly
- State California
- 18 Strongly Tenant-Friendly · D+13
- County
- — inherits STATE
- City Los Angeles
- 0 Strongly Tenant-Friendly · D+22
ZIP-level market 90016
- Rents YoY
- 1.1%
- Active inventory
- 149
- Price-to-rent
- 17.5×
Monthly cashflow live
- Estimated rent
- $33,162 high interval (Pro) →
- Mortgage (P&I)
- −$7,316
- Tax from tax record
- −$1,438 /mo · $17,256/yr
- Insurance
- −$581
- HOA
- −$0
- Vacancy / Maint / Mgmt
- −$6,964
- Net cashflow
- $16,863
Break-even live
5-unit breakdown (identical units grouped — click to expand)
| Units | Beds | Baths | Est. rent |
|---|---|---|---|
| 5× units | 7 | 5 | $33,160 |
| #1 | 7 | 5 | $6,632 |
| #2 | 7 | 5 | $6,632 |
| #3 | 7 | 5 | $6,632 |
| #4 | 7 | 5 | $6,632 |
| #5 | 7 | 5 | $6,632 |
| Total (5 units) | $33,162 | ||
UW: 25.0% down · 7.5% · 30yr · 1.5% tax · 5.0% vac · 8.0% maint · 8.0% mgmt
Financing live
Cash to close
- Down payment
- $348,750
- Closing costs
- $41,850
- Reserves months
- —
- Total cash needed
- —
Loan-product check · same deal, 3 products live
Conventional
25% down · 7.5% · 30yr
- Down + closing
- —
- Monthly P&I
- —
- Monthly cashflow
- —
- DSCR
- —
- Eligible?
- —
Personal DTI + credit; lowest rate.
DSCR
20% down · 8.5% · 30yr
- Down + closing
- —
- Monthly P&I
- —
- Monthly cashflow
- —
- DSCR
- —
- Eligible?
- —
No personal income docs; deal must DSCR.
Hard money
10% down · 12.0% · 12mo
- Down + closing
- —
- Monthly P&I
- —
- Monthly cashflow
- —
- DSCR
- —
- Eligible?
- —
Short-term bridge; refi at stabilization.
Rent comps 40 comps
| Address | Beds | Baths | Sqft | Rent | $/sqft | DOM | Units | Dist |
|---|---|---|---|---|---|---|---|---|
| 4861 W 23rd St Los Angeles, CA | 1.0 | 1.0 | 700 | $2,000 | $2.86 | 43d | 1 | 0.18mi |
| 1915 S Longwood Ave Unit 5 Los Angeles, CA | 2.0 | 1.0 | 860 | $2,595 | $3.02 | 15d | 1 | 0.24mi |
| 2516 Lucerne Ave Los Angeles, CA | 2.0 | 1.0 | 945 | $3,500 | $3.70 | 43d | 1 | 0.25mi |
| 4937 20th St Unit 1/4 Los Angeles, CA | 2.0 | 2.5 | 1000 | $3,250 | $3.25 | 22d | 1 | 0.32mi |
| 1805 S Rimpau Blvd Los Angeles, CA | 1.0 | 1.0 | 700 | $1,900 | $2.71 | 43d | 1 | 0.36mi |
| 2616 Buckingham Rd Unit 2616 Los Angeles, CA | 2.0 | 2.0 | 1100 | $3,200 | $2.91 | 43d | 1 | 0.38mi |
| 1782 S Rimpau Blvd Los Angeles, CA | 2.0 | 2.0 | 1000 | $3,050 | $3.05 | 15d | 1 | 0.40mi |
| 4520 W 18th St Los Angeles, CA | 2.0 | 1.0 | 730 | $2,300 | $3.15 | 43d | 1 | 0.40mi |
| 4837 W 18th St Los Angeles, CA | 1.0 | 1.0 | 700 | $3,200 | $4.57 | 43d | 1 | 0.40mi |
| 2653 Vineyard Ave Los Angeles, CA | 2.0 | 2.5 | 745 | $2,995 | $4.02 | 7d | 1 | 0.41mi |
| 4474 W Adams Blvd Los Angeles, CA | — | 1.0 | 1200 | $2,995 | $2.50 | 43d | 1 | 0.45mi |
| 2333 S Mansfield Ave Unit 2 Los Angeles, CA | 2.0 | 1.5 | 1131 | $2,395 | $2.12 | 24d | 1 | 0.46mi |
| 2210 S Sycamore Ave Unit 3 Los Angeles, CA | 2.0 | 1.0 | 900 | $2,395 | $2.66 | 43d | 1 | 0.51mi |
| 1861 S Sycamore Ave Los Angeles, CA | 1.0 | 1.0 | 805 | $1,828 | $2.27 | 43d | 1 | 0.55mi |
| 4546 W 17th St Los Angeles, CA | 2.0 | 1.0 | 700 | $2,450 | $3.50 | 24d | 1 | 0.55mi |
| 4723 W 17th St Los Angeles, CA | 2.0 | 1.0 | 1325 | $2,800 | $2.11 | 5d | 1 | 0.57mi |
| 2401 S Sycamore Ave Unit 6 Los Angeles, CA | 2.0 | 1.0 | 1000 | $2,595 | $2.60 | 7d | 1 | 0.61mi |
| 2240 Crenshaw Blvd Unit C Los Angeles, CA | 2.0 | 2.0 | 850 | $2,700 | $3.18 | 7d | 1 | 0.62mi |
| 1855 S Victoria Ave Unit 1 & 2 Los Angeles, CA | 1.0 | 1.0 | 776 | $1,895 | $2.44 | 43d | 1 | 0.62mi |
| 1876 1/2 Redondo Blvd Los Angeles, CA | 2.0 | 1.0 | 1500 | $3,495 | $2.33 | 43d | 1 | 0.63mi |
| 1874 Redondo Blvd Unit 1876 Los Angeles, CA | 2.0 | 2.0 | 1500 | $3,495 | $2.33 | 43d | 1 | 0.63mi |
| 1874 Redondo Blvd Unit 1874 Los Angeles, CA | 2.0 | 1.0 | 1500 | $3,195 | $2.13 | 43d | 1 | 0.63mi |
| 2132 S Cloverdale Ave Los Angeles, CA | 2.0 | 1.0 | 1200 | $2,895 | $2.41 | 14d | 1 | 0.68mi |
| 4617 Lomita St Unit 6 Los Angeles, CA | 1.0 | 1.0 | 700 | $1,675 | $2.39 | 22d | 1 | 0.70mi |
| 2818 S Bronson Ave Los Angeles, CA | 2.0 | 2.0 | 950 | $2,875 | $3.03 | 43d | 1 | 0.70mi |
| 1666 La Fayette Rd Unit 1670 Los Angeles, CA | 1.0 | 1.0 | 725 | $2,400 | $3.31 | 43d | 1 | 0.71mi |
| 4135 W 22nd Pl Unit 4137 Los Angeles, CA | 2.0 | 1.0 | 850 | $2,895 | $3.41 | 43d | 1 | 0.71mi |
| 4135 W 22nd Pl Unit 2202 Los Angeles, CA | 2.0 | 1.0 | 850 | $2,995 | $3.52 | 43d | 1 | 0.71mi |
| 3035 West Blvd Unit 204 Los Angeles, CA | 2.0 | 1.0 | 900 | $2,695 | $2.99 | 24d | 1 | 0.72mi |
| 1890 S Cochran Ave #13 Los Angeles, CA | 2.0 | 1.5 | 1066 | $3,200 | $3.00 | 44d | 1 | 0.72mi |
| 2515 Alsace Ave Los Angeles, CA | 2.0 | 2.0 | 1450 | $3,499 | $2.41 | 7d | 1 | 0.73mi |
| 5042 Ferndale St Los Angeles, CA | 2.0 | 1.0 | 1200 | $2,600 | $2.17 | 43d | 1 | 0.73mi |
| 5181 W Adams Blvd Los Angeles, CA | 1.0 | 1.0 | 665 | $2,895 | $4.35 | 7d | 3 | 0.74mi |
| 1815 S Cloverdale Ave Los Angeles, CA | 2.0 | 2.0 | 1270 | $3,900 | $3.07 | 43d | 1 | 0.75mi |
| 3031 Wellington Rd Los Angeles, CA | 2.0 | 1.0 | 1199 | $3,099 | $2.58 | 3d | 1 | 0.75mi |
| 1642 La Fayette Rd Los Angeles, CA | 1.0 | 1.0 | 770 | $2,695 | $3.50 | 43d | 1 | 0.75mi |
| 1429 S Sycamore Ave Unit 1429 Los Angeles, CA | 2.0 | 2.0 | 900 | $2,775 | $3.08 | 43d | 1 | 0.77mi |
| 5217 W Adams Blvd Los Angeles, CA | 1.0–2.0 | 1.0–2.0 | 807 | $2,650 | $3.28 | 7d | 20 | 0.79mi |
| 4036 Mont Clair St Los Angeles, CA | 1.0 | 1.0 | 739 | $1,795 | $2.43 | 3d | 1 | 0.80mi |
| 4037 W 28th St Los Angeles, CA | 1.0–3.0 | 1.0–2.0 | 1000 | $1,950 | $1.95 | 7d | 2 | 0.80mi |
Listing history 35 events
-
2026-06-18days on market $1,395,000 Active 233 DOM
-
2026-06-17days on market $1,395,000 Active 232 DOM
-
2026-06-16days on market $1,395,000 Active 231 DOM
-
2026-06-15days on market $1,395,000 Active 230 DOM
-
2026-06-13days on market $1,395,000 Active 228 DOM
-
2026-06-09days on market $1,395,000 Active 224 DOM
-
2026-06-08days on market $1,395,000 Active 223 DOM
-
2026-06-07days on market $1,395,000 Active 222 DOM
-
2026-06-04days on market $1,395,000 Active 219 DOM
-
2026-06-03days on market $1,395,000 Active 218 DOM
-
2026-06-02days on market $1,395,000 Active 217 DOM
-
2026-06-01days on market $1,395,000 Active 216 DOM
-
2026-05-31days on market $1,395,000 Active 215 DOM
-
2026-04-08price $1,325,777 665-char remark
Show marketing remark (665 chars)
Welcome to this incredible value in Mid City, Fantastic investment opportunity in the rapidly growing Mid City market! This well-maintained 5 units feature over 5000 square feet of unique construction, creating strong value-add potential, 2 units were recently fully renovated the property is strategically positioned in the most appealing, high growth areas from Downtown L. A. to Culver City's Tech Hub, the neighborhood is experiencing a rapid growth of multifamily development. This property offers amazing tenant convenience Located in a high-demand rental market, this property is ideal for investors seeking steady income and long-term growth.
-
2026-01-27price $1,350,777 665-char remark
Show marketing remark (665 chars)
Welcome to this incredible value in Mid City, Fantastic investment opportunity in the rapidly growing Mid City market! This well-maintained 5 units feature over 5000 square feet of unique construction, creating strong value-add potential, 2 units were recently fully renovated the property is strategically positioned in the most appealing, high growth areas from Downtown L. A. to Culver City's Tech Hub, the neighborhood is experiencing a rapid growth of multifamily development. This property offers amazing tenant convenience Located in a high-demand rental market, this property is ideal for investors seeking steady income and long-term growth.
-
2025-10-28$1,395,000 Active 665-char remark
Show marketing remark (703 chars)
Exceptional investment opportunity in the heart of Los Angeles! Welcome to 2116 S Palm Grove Ave, a well-maintained 5-unit multifamily property offering a perfect blend of classic charm and modern updates. Each unit is thoughtfully designed for comfortable living, featuring spacious interiors filled with natural light. The property includes on-site parking and a private outdoor area for tenant enjoyment. Conveniently located near shopping, dining, schools, and major freeways, this prime location offers excellent rental demand and long-term growth potential. Whether you’re an investor expanding your portfolio or looking for an income-producing property, 2116 S Palm Grove Ave is a must-see!
-
2025-10-28$1,395,000 Active 703-char remark
Show marketing remark (703 chars)
Exceptional investment opportunity in the heart of Los Angeles! Welcome to 2116 S Palm Grove Ave, a well-maintained 5-unit multifamily property offering a perfect blend of classic charm and modern updates. Each unit is thoughtfully designed for comfortable living, featuring spacious interiors filled with natural light. The property includes on-site parking and a private outdoor area for tenant enjoyment. Conveniently located near shopping, dining, schools, and major freeways, this prime location offers excellent rental demand and long-term growth potential. Whether you’re an investor expanding your portfolio or looking for an income-producing property, 2116 S Palm Grove Ave is a must-see!
-
2023-08-31soldstatus $1,200,000 Sold
-
2023-08-31soldstatus $1,200,000
-
2023-07-28status Pending
-
2023-06-06$1,250,000 Active
-
2020-09-01status Pending
-
2020-08-31soldstatus $1,530,000 Sold
-
2020-08-31soldstatus $1,530,000
-
2020-02-08$1,400,000 Active
-
2019-09-09historical Withdrawn
-
2019-09-09historical
-
2018-09-10price
-
2018-08-15Active
-
2018-08-15$1,400,000
-
2015-11-03status Pending
-
2015-11-03historical Cancelled
-
2015-11-03historical
-
2015-10-23Active
-
2015-10-23$825,000
ⓘ Source: listings_history table (triggers on properties + properties_extension) + one-shot
backfill from property_details.listing_events for pre-trigger history.
Tax reassessment forecast CA · Resets to sale price
- Current annual tax
- $17,256 · $1,438/mo
- Projected year-2 tax
- $17,256 · $1,438/mo
- Expected delta
- $0/yr ($0/mo · 0.0%)
ⓘ Screening estimate from a state-policy table — verify with the county assessor before closing.
Climate risk First Street
- Flood 1/10 Low FEMA zone X (unshaded) · 0% chance over 30 yrs
- Wildfire 1/10 Low
- Heat 6/10 Major 7 d/yr ≥89°F today · 21 d/yr by 30 yrs out
- Wind 1/10 Low
- Air quality 5/10 Major 7 unhealthy d/yr today · 7 by 30 yrs out
Nearby sold comps map
Loading sold comps map…
Walkable amenities ~0.75 mi
Loading nearby amenities…
Taxation est. · year 1
- Rental income
- $397,944
- − Mortgage interest
- −$78,142
- − Property taxes
- −$17,256
- − Insurance
- −$6,975
- − Repairs & maintenance
- −$31,836
- − Management
- −$31,836
- − Depreciation
- −$40,582
- Taxable income
- $191,319
- Est. tax owed @ 24.0%
- −$45,917
- After-tax cash flow
- $156,442/yr
For passive investors: Depreciation is non-cash, so a rental often shows a tax loss while cash-flowing — sheltering income. Rental losses are passive: they offset passive income freely, and up to $25,000/yr can offset ordinary (W-2) income if you actively participate and your MAGI is under $100k (phasing out to $0 by $150k); unused losses carry forward. On sale, claimed depreciation is recaptured at up to 25%, and gains may owe capital-gains tax (a 1031 exchange can defer both). Figures are a year-1 estimate at your 24.0% rate — not tax advice; consult a CPA.
Schools (NCES district)
- District
- Los Angeles Unified
- NCES district ID
- 0622710
- Math proficiency
- 29% ▼ -4.00%
- Reading proficiency
- 54% ▲ 10.00%
- Median HH income
- $50,403
- Composite
- 35.67/100
- National rank
- #4875
- State rank
- #223 of 517 in CA
Livability — Los Angeles
- Score
- 68/100
- State rank
- #273
- US rank
- #9237
Category grades
Schools grade is shown separately in the Schools card above.
Census & demographics
- Census place
- Los Angeles, CA
- County
- Los Angeles County · 9,444,647 people
- City population
- 3,838,149
- Metro
- Los Angeles-Long Beach-Anaheim, CA
- Population (ZIP)
- 46,457
- Household income
- $73,516
- Rent vs Own
- Severe rent burden
- 3450.0
Population outlook (Los Angeles County) Hauer SSP2
- Today (2025)
- 10,940,515 people
- By 2030
- 11,256,481 · +2.9%
- By 2040
- 11,729,929 · +7.2%
- By 2050
- 11,948,407 · +9.2%
- By 2075
- 11,818,114 · +8.0%
- By 2100
- 10,842,928 · -0.9%
Race, ethnicity, and origin ACS 2023
- Neighborhood character
- Diverse neighborhood (Simpson 0.64)
- Race & ethnicity
- Hispanic / Latino 52% Black 27% Two or more races 18% White 12% Asian 4%
- Hispanic origin (detail)
- Mexican 34%
- Common ancestry
- British 1% Scotch-Irish 1% Romanian 1%
- Foreign-born
- 30% · Canada, South Korea, China
- Languages at home
- 47% English-only · Spanish 47% French/Haitian/Cajun 1% Chinese 1%
Political lean MEDSL · Los Angeles
- 2024 margin
- Solid D (+32.9) · D 64.8% · R 31.9% · Other 3.3%
- 2008→2024 swing
- -7.4pp toward R · 2008: 40.4pp · 2024: 32.9pp
- All cycles
- 2024: D+32.9 2020: D+44.2 2016: D+48.0 2012: D+40.0 2008: D+40.4
Not yet ingested
- Civics
- —
Market trends
- HPI YoY
- ▼ -991.94%
- Current HPI
- 584.0673
- Rent YoY
- ▲ 1.12%
- Metro
- Los Angeles-Long Beach-Anaheim, CA
- State GDP YoY
- ▲ 3.21%
- F500 in state
- 116
Industry mix (Fortune 500 HQ in CA)
| Industry | F500 HQs | Revenue |
|---|---|---|
| Technology | 27 | $1,492B |
|
||
| Financial Services | 3 | $174B |
|
||
| Retail | 3 | $44B |
|
||
| Insurance | 3 | $26B |
|
||
| Media / Entertainment | 2 | $115B |
|
||
| Pharmaceuticals / Biotech | 2 | $62B |
|
||
Price history
+60.7% since first listed22 events — show timeline
- 2026-04-08 Price Changed $1,325,777 CRMLS
- 2026-01-27 Price Changed $1,350,777 CRMLS
- 2025-10-28 Listed $1,395,000 CRMLS
- 2025-10-28 Listed $1,395,000 CRMLS
- 2023-08-31 Sold (Public Records) $1,200,000 Public Records
- 2023-08-31 Sold (MLS) $1,200,000 TheMLS
- 2023-07-28 Pending — TheMLS
- 2023-06-06 Listed $1,250,000 TheMLS
- 2020-09-01 Pending — TheMLS
- 2020-08-31 Sold (Public Records) $1,530,000 Public Records
- 2020-08-31 Sold (MLS) $1,530,000 TheMLS
- 2020-02-08 Listed $1,400,000 TheMLS
- 2019-09-09 Listing Removed — SDMLS
- 2019-09-09 Delisted — TheMLS
- 2018-09-10 Price Changed — TheMLS
- 2018-08-15 Listed $1,400,000 SDMLS
- 2018-08-15 Listed — TheMLS
- 2015-11-03 Pending — TheMLS
- 2015-11-03 Listing Removed — SDMLS
- 2015-11-03 Delisted — TheMLS
- 2015-10-23 Listed — TheMLS
- 2015-10-23 Listed $825,000 SDMLS
Property tax history
+16.5%/yrLatest (2025): $17,256 · +11.9% YoY. Source: county tax records.
Cash-flow waterfall
monthlySold comps — $/sqft
last 12 mo · ≤1 miLoading sold comps…