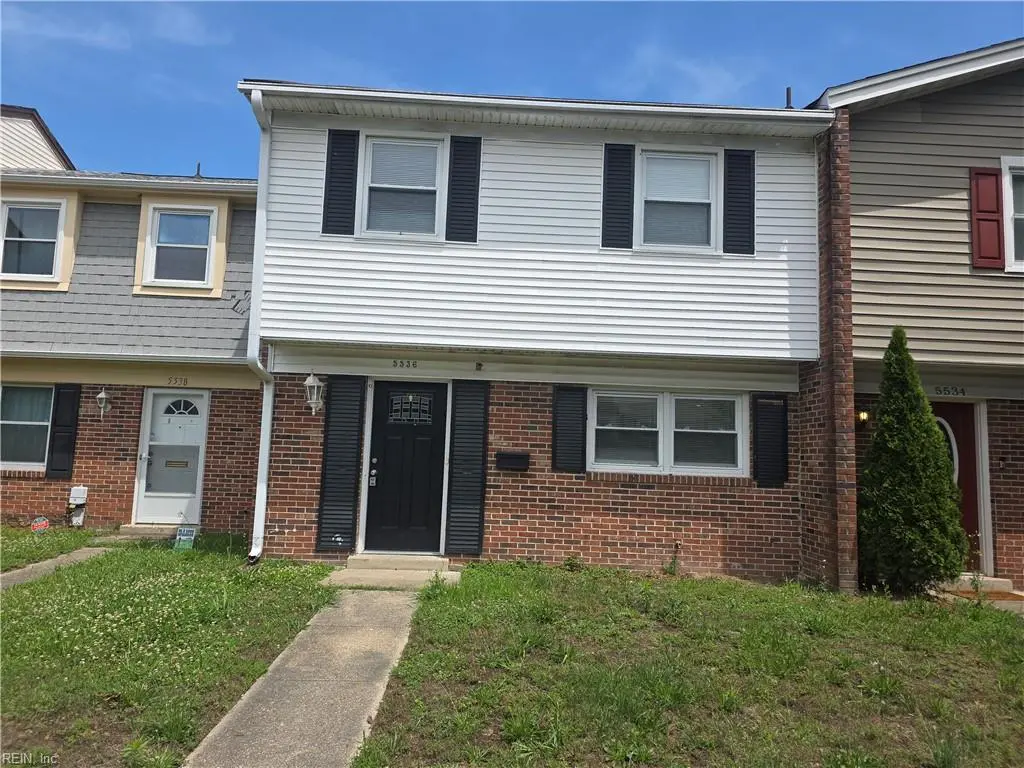
5536 New Colony Dr · Virginia Beach, VA
Flood risk 1/10 · Minimal
- FEMA flood zone
- X (unshaded)
- Chance of flooding over 30 yrs
- 0.0%
- Est. flood insurance / yr
- $507 – $1,088
Fire risk 1/10 · Minimal
- Est. fire insurance / yr
- $666 – $1,236
Heat risk 9/10 · Severe
- Hot days now (above 105°F)
- 7 days/yr
- Hot days in 30 yrs
- 16 days/yr
Wind risk 8/10 · Major
- Chance of severe wind over 30 yrs
- 80.0%
Air-quality risk 5/10 · Moderate
- Unhealthy air days now
- 7 days/yr
- Unhealthy air days in 30 yrs
- 7 days/yr
Risk factors via First Street. Map © Google.
Why this score? — see what drove the D grade
The composite is a weighted blend of 9 inputs, each scored 0–100. Each bar is that input's sub-score; the figure is the points it added to the 100-point composite (weight × sub-score).
- Cash flow +11.1/30.0
- ARV discount +8.1/15.0
- Schools +6.4/10.0
- Livability +4.2/5.0
- Rent growth +4.1/5.0
- DSCR +3.2/10.0
- 1% rule +2.6/10.0
- Condition / age +2.5/5.0
- Appreciation +0.0/10.0
$274,000
🖨 Deal sheet 📄 Offer letter ✓ Due diligence
Listing remarks
Beautiful townhome in nice area of VA Beach. This spacious townhouse is in great area with great schools. Perfect for first time home owners.
Key facts
- 2 parking spots
- Built 1972
- Listed 18 days
Property features AI
Finance
- HOA & community: No HOA/POA fees listed
Exterior
- Parking: Off-street parking; Driveway spaces (2 total)
- Utilities: City/County water; City/County sewer; Electric water heater; Electric power
- Home design: Attached property; Contemporary style; Two stories (two living levels); Entry level: not listed
- Construction: Brick and vinyl siding; Asphalt shingle roof; Slab foundation
- Exterior features: Patio; Back privacy wood fence
Interior
- Kitchen: Electric range; Microwave; Refrigerator; Dishwasher
- Bedrooms: Master bedroom with ensuite; Additional bedroom
- Flooring: Carpet; Ceramic; Laminate
- Bathrooms: Two full bathrooms; One half bathroom
- Heating & cooling: Heat pump; Central air
- Interior features: Window treatments
- Laundry & utility: Washer hookup; Dryer hookup; Utility room
Neighborhood map
What this means for you Summary
Snapshot
- This is a 3-bed/2.5-bath townhouse listed at $274k.
Deal economics
- At list price, monthly cash flow is $-111 ($-1k/yr) — negative.
- To cash-flow at today's rent, offer at most $254k (7.2% below list).
- To meet the 1% rule (rent ≥ 1% of price), the offer needs to be $207k (24.3% below list).
- Recommended offer: $207k (24.3% below list) — sets the bar for 1% rule.
- Cap rate 5.8% vs local median 3.5% in Virginia Beach — top-decile yield for the area; either an underpriced asset or a hidden risk that comps aren't pricing in. Stress-test before assuming the spread holds.
Location & tenants
- Location reads 83/100 on livability (#38 in VA, #880 nationally) — a professional / high-income tenant draw. Strengths: amenities A+, employment A+, housing A+; Watch: cost of living C-, commute F.
- Va Beach City Public School District (urban): math 69% / reading 78% proficiency, ranked #10 of 131 in VA (top 8%) — strong family-tenant draw, lease renewals of 3-5y typical.
- Zoned schools: Fairfield Elementary (math 67% / reading 75%, grade A-, #303 of 1,108 statewide, top 28%, 477 students, 42% FRL); Tallwood High (math 81% / reading 88%, grade A, #23 of 319 statewide, top 8%, 1,861 students, 44% FRL).
- Market conditions: Rents rising fast (+6.4%/yr); 225 active listings in the ZIP; 10 comparable units currently listed for rent nearby; rentals at typical pace (median 24d on market — plan ~3-4 weeks tenant-placement turnaround); solid renter incomes; 666 units permitted in Virginia Beach city in 2024 (347 in 5+ unit buildings).
Forward outlook
- Local home prices are declining (-3.0%/yr); year-one equity from $2k of loan paydown is wiped out by about $8k of value loss. Plan a longer hold.
- Virginia Beach County population projected at +6% by 2050 — modest demand growth; plan on rents tracking national, not racing it.
Negotiation context
- It's been on market 18 days — a 2% lower offer ($270k) is reasonable based on typical stale-listing flexibility.
Risks & watch-outs
- Climate carrying-cost: severe wind risk, 80% chance of damaging wind over 30y; extreme-heat days projected 7→16/yr by 2055 (HVAC capex compounding) — expect insurance premiums to compound above CPI over the hold.
Questions for the listing agent
- What do current leases actually rent for vs. the listed asking? Can we see a recent rent roll and the last 12 months of T-12 income?
- Built in 1972 — when were the roof, HVAC, electrical panel, plumbing, and water heater last replaced?
- Is there a deadline driving the sale (1031 exchange, divorce, estate, relocation)? That informs how much negotiation room exists.
- Schools are A-rated — typically a magnet for longer-tenancy family renters. What's the average tenant stay here, and is there a school-zone premium baked into asking?
- The area grade is low — what's the realistic commute time and amenity access for the typical tenant pool here? Any planned neighborhood developments (good or bad) we should know about?
- What's the average days-on-market for RENTAL listings here right now (not sales)? A rising rental-DOM trend means longer vacancies and softer asking-rent achievability than the comps imply.
- What's the recent tenant-quality profile in this submarket — average credit score on applications, eviction rate, late-payment / NSF rate, and stable-employment percentage? A property-management company in the area should have these aggregated.
- How much new for-sale + rental construction is in the pipeline within 1–3 miles? Heavy new supply typically softens prices + rents 12–24 months out; constrained supply supports both.
Investment metrics
- 1% rule
- 0.76% ✗
- Cap rate
- 5.81%
- Cash-on-cash
- -1.74%
- DSCR
- 0.92
- GRM
- 11.0
CMA / ARV
- ARV (on-the-fly)
- $277,830
- Comps found
- 8
Show comp detail 8 sales within ~0.75 mi
| Address | Dist | Beds/Ba | Sqft | Sold | Price | $/sf | Match |
|---|---|---|---|---|---|---|---|
| 5623 Gates Landing Rd | 0.13mi | 3/2.5 | 1,454 (-1%) | 10mo | $275,000 | $189 | 84 |
| 888 Jamestown Landing Rd | 0.11mi | 3/2.5 | 1,511 (+3%) | 11mo | $289,000 | $191 | 81 |
| 802 Pepper Mill Pl | 0.11mi | 3/2.5 | 1,511 (+3%) | 13mo | $278,000 | $184 | 80 |
| 5516 Gates Landing Rd | 0.18mi | 3/2.5 | 1,500 (+2%) | 12mo | $150,000 | $100 | 78 |
| 701 Skipwith Rd | 0.13mi | 3/2.0 | 1,554 (+6%) | 6mo | $315,000 | $203 | 77 |
| 806 Westport Pl | 0.07mi | 3/2.5 | 1,636 (+11%) | 2mo | $305,000 | $186 | 76 |
| 5630 Gates Landing Rd | 0.15mi | 2/1.5 (-1) | 1,377 (-6%) | 7mo | $205,000 | $149 | 68 |
| 5645 Gates Landing Rd | 0.11mi | 2/1.5 (-1) | 1,257 (-14%) | 8mo | $270,000 | $215 | 55 |
Match score weights: distance 35% · size 25% · config 20% · recency 20%. Top-matched comps best support the ARV.
Projected returns pro-forma
-3.0% appreciation · 6.36% rent growth · sell at horizon
- IRR
- -15.8%
- Equity multiple
- 0.42×
- Total profit
- $-44,291
- Equity at exit
- $40,854
- IRR
- -2.7%
- Equity multiple
- 0.79×
- Total profit
- $-16,042
- Equity at exit
- $23,691
Cash invested: $76,720 (down + closing). Projections, not guarantees.
Landlord ↔ Tenant lean methodology
- Overall (STATE)
- 55 Moderately Landlord-Leaning
- State Virginia
- 55 Moderately Landlord-Leaning · D+2
- County
- — inherits STATE
- City
- — inherits STATE
ZIP-level market 23464
- Rents YoY
- 6.4%
- Active inventory
- 225
- Price-to-rent
- 11.0×
Monthly cashflow live
- Estimated rent
- $2,075 high interval (Pro) →
- Mortgage (P&I)
- −$1,437
- Tax from tax record
- −$199 /mo · $2,390/yr
- Insurance
- −$114
- HOA
- −$0
- Vacancy / Maint / Mgmt
- −$436
- Net cashflow
- $-111
Break-even live
UW: 25.0% down · 7.5% · 30yr · 1.5% tax · 5.0% vac · 8.0% maint · 8.0% mgmt
Financing live
Cash to close
- Down payment
- $68,500
- Closing costs
- $8,220
- Reserves months
- —
- Total cash needed
- —
Loan-product check · same deal, 3 products live
Conventional
25% down · 7.5% · 30yr
- Down + closing
- —
- Monthly P&I
- —
- Monthly cashflow
- —
- DSCR
- —
- Eligible?
- —
Personal DTI + credit; lowest rate.
DSCR
20% down · 8.5% · 30yr
- Down + closing
- —
- Monthly P&I
- —
- Monthly cashflow
- —
- DSCR
- —
- Eligible?
- —
No personal income docs; deal must DSCR.
Hard money
10% down · 12.0% · 12mo
- Down + closing
- —
- Monthly P&I
- —
- Monthly cashflow
- —
- DSCR
- —
- Eligible?
- —
Short-term bridge; refi at stabilization.
Rent comps 10 comps
| Address | Beds | Baths | Sqft | Rent | $/sqft | DOM | Units | Dist |
|---|---|---|---|---|---|---|---|---|
| 806 Jamestowne Dr Virginia Beach, VA | 3.0 | 2.5 | 1700 | $2,000 | $1.18 | 21d | 1 | 0.02mi |
| 5519 New Colony Dr Virginia Beach, VA | 3.0 | 2.5 | 1470 | $1,795 | $1.22 | 23d | 1 | 0.07mi |
| 658 Oleander Cir Virginia Beach, VA | 2.0 | 2.5 | 1254 | $2,050 | $1.63 | 23d | 1 | 0.86mi |
| 5485 Glenville Cir Virginia Beach, VA | 3.0 | 2.5 | 1588 | $2,500 | $1.57 | 23d | 1 | 0.92mi |
| 611 Oleander Cir Virginia Beach, VA | 2.0 | 2.0 | 1250 | $1,900 | $1.52 | 14d | 1 | 0.99mi |
| 1048 Commonwealth Pl Virginia Beach, VA | 3.0 | 1.5 | 1242 | $2,150 | $1.73 | 23d | 1 | 1.19mi |
| 5313 Sir Barton Dr Virginia Beach, VA | 3.0 | 2.0 | 1556 | $2,750 | $1.77 | 23d | 1 | 1.25mi |
| 1102 Clear Springs Rd Virginia Beach, VA | 3.0 | 1.5 | 1280 | $1,695 | $1.32 | 23d | 1 | 1.25mi |
| 1101 Craftsman Dr Virginia Beach, VA | 1.0–2.0 | 1.0–2.0 | 1014 | $1,909 | $1.88 | 2d | 22 | 1.40mi |
| 6308 Blakely Sq Virginia Beach, VA | 1.0–3.0 | 1.0–2.0 | 1036 | $2,629 | $2.54 | 3d | 17 | 1.42mi |
Listing history 12 events
-
2026-06-18days on market $274,000 Active 18 DOM
-
2026-06-17days on market $274,000 Active 17 DOM
-
2026-06-16pricedays on market $274,000 Active 16 DOM
-
2026-06-15days on market $279,000 Active 15 DOM
-
2026-06-13days on market $279,000 Active 13 DOM
-
2026-06-09days on market $279,000 Active 9 DOM
-
2026-06-08days on market $279,000 Active 8 DOM
-
2026-06-07days on market $279,000 Active 7 DOM
-
2026-06-03days on market $279,000 Active 3 DOM
-
2026-06-02days on market $279,000 Active 2 DOM
-
2026-06-01remarks 141-char remark
-
2026-06-01$279,000 Active 1 DOM
ⓘ Source: listings_history table (triggers on properties + properties_extension) + one-shot
backfill from property_details.listing_events for pre-trigger history.
Tax reassessment forecast VA · Resets to sale price
- Current annual tax
- $2,390 · $199/mo
- Projected year-2 tax
- $2,390 · $199/mo
- Expected delta
- $0/yr ($0/mo · 0.0%)
ⓘ Screening estimate from a state-policy table — verify with the county assessor before closing.
Climate risk First Street
- Flood 1/10 Low FEMA zone X (unshaded) · 0% chance over 30 yrs
- Wildfire 1/10 Low
- Heat 9/10 Extreme 7 d/yr ≥105°F today · 16 d/yr by 30 yrs out
- Wind 8/10 Severe 80% chance of damaging wind over 30 yrs
- Air quality 5/10 Major 7 unhealthy d/yr today · 7 by 30 yrs out
Nearby sold comps map
Loading sold comps map…
Walkable amenities ~0.75 mi
Loading nearby amenities…
Taxation est. · year 1
- Rental income
- $24,896
- − Mortgage interest
- −$15,348
- − Property taxes
- −$2,390
- − Insurance
- −$1,370
- − Repairs & maintenance
- −$1,992
- − Management
- −$1,992
- − Depreciation
- −$7,971
- Taxable loss
- −$6,167
- Est. tax savings @ 24.0%
- +$1,480
- After-tax cash flow
- $145/yr
For passive investors: Depreciation is non-cash, so a rental often shows a tax loss while cash-flowing — sheltering income. Rental losses are passive: they offset passive income freely, and up to $25,000/yr can offset ordinary (W-2) income if you actively participate and your MAGI is under $100k (phasing out to $0 by $150k); unused losses carry forward. On sale, claimed depreciation is recaptured at up to 25%, and gains may owe capital-gains tax (a 1031 exchange can defer both). Figures are a year-1 estimate at your 24.0% rate — not tax advice; consult a CPA.
Schools (NCES district)
- District
- Va Beach City Public School District
- NCES district ID
- 5103840
- Math proficiency
- 69% ▼ -19.00%
- Reading proficiency
- 78% ▼ -7.00%
- Median HH income
- $66,452
- Composite
- 63.81/100
- National rank
- #594
- State rank
- #10 of 131 in VA
Livability — Virginia Beach
- Score
- 83/100
- State rank
- #38
- US rank
- #880
Category grades
Schools grade is shown separately in the Schools card above.
Census & demographics
- Census place
- Virginia Beach, VA
- County
- Virginia Beach City · 448,227 people
- City population
- 448,227
- Metro
- Virginia Beach-Norfolk-Newport News, VA-NC
- Population (ZIP)
- 75,061
- Household income
- $92,468
- Rent vs Own
- Severe rent burden
- 1929.0
Population outlook (Virginia Beach County) Hauer SSP2
- Today (2025)
- 480,401 people
- By 2030
- 491,221 · +2.3%
- By 2040
- 504,882 · +5.1%
- By 2050
- 508,847 · +5.9%
- By 2075
- 504,831 · +5.1%
- By 2100
- 465,867 · -3.0%
Race, ethnicity, and origin ACS 2023
- Neighborhood character
- Diverse neighborhood (Simpson 0.68)
- Race & ethnicity
- White 50% Black 23% Asian 10% Two or more races 9% Hispanic / Latino 9%
- Hispanic origin (detail)
- Mexican 2% Puerto Rican 3%
- Common ancestry
- Slovak 2% Lithuanian 2% Italian 2%
- Foreign-born
- 11% · Canada, Vietnam, China
- Languages at home
- 85% English-only · Tagalog/Filipino 5% Spanish 5% Other Asian/Pacific 1%
Political lean MEDSL · Virginia Beach
- 2024 margin
- Toss-up / Even · D 50.7% · R 48.0% · Other 1.3%
- 2008→2024 swing
- +3.4pp toward D · 2008: -0.7pp · 2024: 2.6pp
- All cycles
- 2024: D+2.6 2020: D+5.4 2016: R+4.5 2012: R+2.5 2008: R+0.7
Not yet ingested
- Civics
- —
Market trends
- HPI YoY
- ▼ -271.27%
- Current HPI
- 324.1854
- Rent YoY
- ▲ 6.36%
- Metro
- Virginia Beach-Norfolk-Newport News, VA-NC
- State GDP YoY
- ▲ 2.40%
- F500 in state
- 50
Industry mix (Fortune 500 HQ in VA)
| Industry | F500 HQs | Revenue |
|---|---|---|
| Aerospace / Defense | 4 | $236B |
|
||
| Technology / Defense | 3 | $32B |
|
||
| Financial Services | 2 | $176B |
|
||
| Utilities | 2 | $27B |
|
||
| Insurance | 2 | $25B |
|
||
| Technology | 2 | $15B |
|
||
Price history
+402.7% since first listed6 events — show timeline
- 2026-05-31 Listed $279,000 REINMLS
- 2019-09-23 Sold (Public Records) $390,000 Public Records
- 2013-12-20 Price Changed $109,900 REINMLS
- 2013-08-09 Price Changed $129,900 REINMLS
- 2006-11-29 Sold (Public Records) $194,000 Public Records
- 1987-06-15 Sold (Public Records) $55,500 Public Records
Property tax history
+6.2%/yrLatest (2025): $2,390 · +6.3% YoY. Source: county tax records.
Cash-flow waterfall
monthlySold comps — $/sqft
last 12 mo · ≤1 miLoading sold comps…