905 S Sunfish Ave · Inverness, FL
Flood risk 1/10 · Minimal
- FEMA flood zone
- X (shaded)
- Chance of flooding over 30 yrs
- 0.0%
- Est. flood insurance / yr
- $507 – $1,088
Fire risk 4/10 · Minor
- Est. fire insurance / yr
- $947 – $1,759
Heat risk 9/10 · Severe
- Hot days now (above 107°F)
- 7 days/yr
- Hot days in 30 yrs
- 23 days/yr
Wind risk 9/10 · Severe
- Chance of severe wind over 30 yrs
- 99.0%
Air-quality risk 1/10 · Minimal
- Unhealthy air days now
- 0 days/yr
- Unhealthy air days in 30 yrs
- 0 days/yr
Risk factors via First Street. Map © Google.
Why this score? — see what drove the B- grade
The composite is a weighted blend of 9 inputs, each scored 0–100. Each bar is that input's sub-score; the figure is the points it added to the 100-point composite (weight × sub-score).
- Cash flow +29.9/30.0
- DSCR +10.0/10.0
- 1% rule +8.0/10.0
- ARV discount +7.5/15.0
- Schools +4.1/10.0
- Livability +3.4/5.0
- Rent growth +2.5/5.0
- Condition / age +2.5/5.0
- Appreciation +0.0/10.0
$129,900
🖨 Deal sheet 📄 Offer letter ✓ Due diligence
Listing remarks
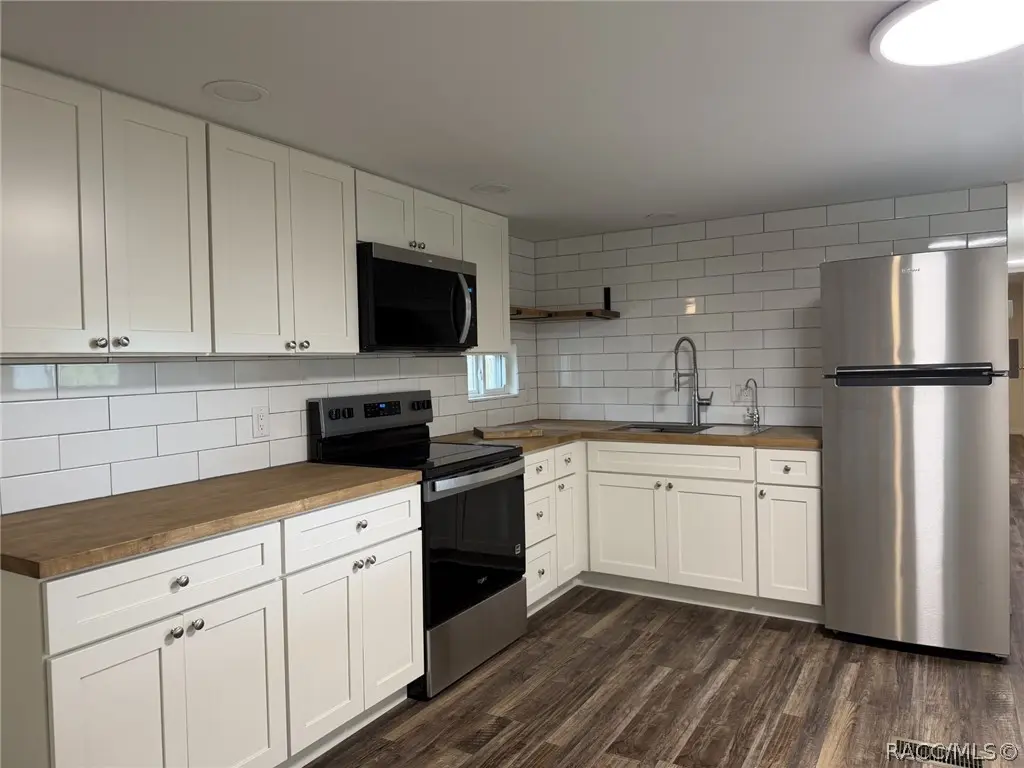
.Move-in ready and beautifully updated, this immaculate home has been completely redone from top to bottom with care. It truly feels brand new, featuring updated plumbing, flooring, appliances, and lighting throughout. Every inch has been refreshed, and it’s offered at a fantastic price. Even with the current drought, you can still look forward to fishing and boating—this canal leads directly to the chain of lakes, giving you effortless access to days of fun on Lake Henderson.
Key facts
- Updated appliances
- Canal access
- Updated flooring
Tags
Property features AI
Exterior
- Parking: Private driveway; Attached carport; Concrete parking surfaces; 1 total parking space
- Security: Smoke detector(s)
- Utilities: Private well water; Septic tank
- Home design: Manufactured home (single wide); Residential property
- Construction: Metal roof; Crawl space foundation
- Exterior features: Corner lot; Wooded lot; Waterfront lot with canal access; Canal front; County road frontage
Interior
- Kitchen: Electric oven; Microwave; Refrigerator
- Bathrooms: 2 full bathrooms
- Heating & cooling: Central heating (electric); Central air conditioning (electric)
- Interior features: Water softener (owned); Water heater; Smoke detector(s)
Neighborhood map
What this means for you Summary
Snapshot
- This is a 3-bed/2.0-bath manufactured listed at $130k.
Deal economics
- At list price, monthly cash flow is $480 ($6k/yr) — positive.
- The deal already cash-flows at list — no discount required.
- Meets the 1% rule at list price ($2k rent vs $130k).
- Recommended offer: $126k (3.0% below list) — sets the bar for market timing.
- Cap rate 10.7% vs local median 4.9% in Inverness — top-decile yield for the area; either an underpriced asset or a hidden risk that comps aren't pricing in. Stress-test before assuming the spread holds.
Location & tenants
- Location reads 67/100 on livability (#564 in FL) — a middle-class / working-renter tenant base. Strengths: cost of living A+, housing A-; Watch: health & safety C-, amenities F, commute F.
- Citrus (rural): math 49% / reading 50% proficiency, ranked #44 of 73 in FL (top 60%) — families likely to look elsewhere, expect single-tenant / working-renter base with shorter leases.
- Zoned schools: Inverness Primary School (math 54% / reading 55%, grade C, #892 of 2,144 statewide, top 44%, 683 students, 65% FRL); Inverness Middle School (math 52% / reading 48%, grade C, #254 of 571 statewide, top 45%, 1,017 students, 60% FRL); Citrus High School (math 34% / reading 51%, grade F, #264 of 667 statewide, top 41%, 1,503 students, 54% FRL) — zoned schools at 60% FRL track the district average.
- Market conditions: 208 active listings in the ZIP; 2,443 units permitted in Citrus County in 2024 (0 in 5+ unit buildings).
Forward outlook
- Local home prices are declining (-3.0%/yr); year-one equity from $898 of loan paydown is wiped out by about $4k of value loss. Plan a longer hold.
- Citrus County population projected to shrink 10% by 2050 — rents likely to lag national; underwrite the cash flow, not the appreciation.
- At projected returns (-3.0% appreciation + 3.0% rent growth), your $36k cash investment doubles in ~8 years — after that, you're playing with house money.
Negotiation context
- It's been on market 54 days — a 3% lower offer ($126k) is reasonable based on typical stale-listing flexibility.
- 3 sale attempts since 2y ago with the ask held roughly flat each time — persistent listings suggest the price (not the market) is what's stuck; bring a comps-based counter.
- Current owner paid $45k; list at $130k implies a 189% gain — meaningful room to come down on a strong offer.
Risks & watch-outs
- Climate carrying-cost: severe wind risk, 99% chance of damaging wind over 30y; extreme-heat days projected 7→23/yr by 2055 (HVAC capex compounding) — expect insurance premiums to compound above CPI over the hold.
Questions for the listing agent
- It's been on market 54 days. Have you received any prior offers? Is the seller open to a 3% concession, seller financing, or rate buy-down credit?
- Built in 1973 — when were the roof, HVAC, electrical panel, plumbing, and water heater last replaced?
- Is there a deadline driving the sale (1031 exchange, divorce, estate, relocation)? That informs how much negotiation room exists.
- Schools are B-rated — typically a magnet for longer-tenancy family renters. What's the average tenant stay here, and is there a school-zone premium baked into asking?
- What's the average days-on-market for RENTAL listings here right now (not sales)? A rising rental-DOM trend means longer vacancies and softer asking-rent achievability than the comps imply.
- What's the recent tenant-quality profile in this submarket — average credit score on applications, eviction rate, late-payment / NSF rate, and stable-employment percentage? A property-management company in the area should have these aggregated.
- How much new for-sale + rental construction is in the pipeline within 1–3 miles? Heavy new supply typically softens prices + rents 12–24 months out; constrained supply supports both.
Investment metrics
- 1% rule
- 1.30% ✓
- Cap rate
- 10.72%
- Cash-on-cash
- 15.83%
- DSCR
- 1.70
- GRM
- 6.4
CMA / ARV
- ARV (on-the-fly)
- $84,864
- Comps found
- 2
Show comp detail 2 sales within ~0.75 mi
| Address | Dist | Beds/Ba | Sqft | Sold | Price | $/sf | Match |
|---|---|---|---|---|---|---|---|
| 736 S Eden Gardens Ave | 0.57mi | 2/1.5 (-1) | 880 (+8%) | 19mo | $75,000 | $85 | 38 |
| 10520 E Faith Ct | 0.66mi | 2/1.0 (-1) | 708 (-13%) | 11mo | $73,900 | $104 | 29 |
Match score weights: distance 35% · size 25% · config 20% · recency 20%. Top-matched comps best support the ARV.
Projected returns pro-forma
-3.0% appreciation · 3.0% rent growth · sell at horizon
- IRR
- 6.7%
- Equity multiple
- 1.26×
- Total profit
- $9,505
- Equity at exit
- $19,369
- IRR
- 16.0%
- Equity multiple
- 2.31×
- Total profit
- $47,624
- Equity at exit
- $11,231
Cash invested: $36,372 (down + closing). Projections, not guarantees.
Landlord ↔ Tenant lean methodology
- Overall (STATE)
- 87 Strongly Landlord-Friendly
- State Florida
- 87 Strongly Landlord-Friendly · R+3
- County
- — inherits STATE
- City
- — inherits STATE
ZIP-level market 34450
- Home prices YoY
- -18.7%
- Active inventory
- 208
- Price-to-rent
- 6.4×
Monthly cashflow live
- Estimated rent
- $1,694 medium interval (Pro) →
- Mortgage (P&I)
- −$681
- Tax from tax record
- −$124 /mo · $1,483/yr
- Insurance
- −$54
- HOA
- −$0
- Vacancy / Maint / Mgmt
- −$356
- Net cashflow
- $480
Break-even live
UW: 25.0% down · 7.5% · 30yr · 1.5% tax · 5.0% vac · 8.0% maint · 8.0% mgmt
Financing live
Cash to close
- Down payment
- $32,475
- Closing costs
- $3,897
- Reserves months
- —
- Total cash needed
- —
Loan-product check · same deal, 3 products live
Conventional
25% down · 7.5% · 30yr
- Down + closing
- —
- Monthly P&I
- —
- Monthly cashflow
- —
- DSCR
- —
- Eligible?
- —
Personal DTI + credit; lowest rate.
DSCR
20% down · 8.5% · 30yr
- Down + closing
- —
- Monthly P&I
- —
- Monthly cashflow
- —
- DSCR
- —
- Eligible?
- —
No personal income docs; deal must DSCR.
Hard money
10% down · 12.0% · 12mo
- Down + closing
- —
- Monthly P&I
- —
- Monthly cashflow
- —
- DSCR
- —
- Eligible?
- —
Short-term bridge; refi at stabilization.
Listing history 36 events
-
2026-06-19days on market $129,900 Active 54 DOM
-
2026-06-18days on market $129,900 Active 53 DOM
-
2026-06-17days on market $129,900 Active 52 DOM
-
2026-06-16days on market $129,900 Active 51 DOM
-
2026-06-15days on market $129,900 Active 50 DOM
-
2026-06-14days on market $129,900 Active 48 DOM
-
2026-06-13days on market $129,900 Active 47 DOM
-
2026-06-09days on market $129,900 Active 44 DOM
-
2026-06-08days on market $129,900 Active 43 DOM
-
2026-06-07remarks 481-char remark
-
2026-06-07days on market $129,900 Active 42 DOM
-
2026-06-03days on market $129,900 Active 38 DOM
-
2026-06-02days on market $129,900 Active 37 DOM
-
2026-06-01days on market $129,900 Active 36 DOM
-
2026-05-31days on market $129,900 Active 35 DOM
-
2026-05-30days on market $129,900 Active 34 DOM
-
2026-04-27$129,900 Active
-
2026-04-21historical
-
2026-03-19price $145,000
-
2026-03-19price $145,000
-
2026-02-16price $149,900
-
2026-02-16price $149,900
-
2026-01-23price $153,000
-
2026-01-23price $153,000
-
2026-01-07price $155,000
-
2026-01-07price $155,000
-
2025-12-09price $157,900
-
2025-11-07$159,900 Active
-
2025-01-17soldstatus $45,000 Closed
-
2025-01-06soldstatus $45,000
-
2024-12-05status Pending
-
2024-12-04$50,000 Active
-
2010-04-06soldstatus $50,000
-
2007-01-11soldstatus $80,000
-
2005-12-02soldstatus $69,900
-
1995-08-01soldstatus $15,000
ⓘ Source: listings_history table (triggers on properties + properties_extension) + one-shot
backfill from property_details.listing_events for pre-trigger history.
Tax reassessment forecast FL · Resets to sale price
- Current annual tax
- $1,483 · $124/mo
- Projected year-2 tax
- $1,483 · $124/mo
- Expected delta
- $0/yr ($0/mo · 0.0%)
ⓘ Screening estimate from a state-policy table — verify with the county assessor before closing.
Climate risk First Street
- Flood 1/10 Low FEMA zone X (shaded) · 0% chance over 30 yrs
- Wildfire 4/10 Moderate
- Heat 9/10 Extreme 7 d/yr ≥107°F today · 23 d/yr by 30 yrs out
- Wind 9/10 Extreme 99% chance of damaging wind over 30 yrs
- Air quality 1/10 Low 0 unhealthy d/yr today · 0 by 30 yrs out
Nearby sold comps map
Loading sold comps map…
Walkable amenities ~0.75 mi
Loading nearby amenities…
Taxation est. · year 1
- Rental income
- $20,334
- − Mortgage interest
- −$7,276
- − Property taxes
- −$1,483
- − Insurance
- −$650
- − Repairs & maintenance
- −$1,627
- − Management
- −$1,627
- − Depreciation
- −$3,779
- Taxable income
- $3,892
- Est. tax owed @ 24.0%
- −$934
- After-tax cash flow
- $4,822/yr
For passive investors: Depreciation is non-cash, so a rental often shows a tax loss while cash-flowing — sheltering income. Rental losses are passive: they offset passive income freely, and up to $25,000/yr can offset ordinary (W-2) income if you actively participate and your MAGI is under $100k (phasing out to $0 by $150k); unused losses carry forward. On sale, claimed depreciation is recaptured at up to 25%, and gains may owe capital-gains tax (a 1031 exchange can defer both). Figures are a year-1 estimate at your 24.0% rate — not tax advice; consult a CPA.
Schools (NCES district)
- District
- Citrus
- NCES district ID
- 1200270
- Math proficiency
- 49% ▼ -10.00%
- Reading proficiency
- 50% ▼ -6.00%
- Median HH income
- $38,618
- Composite
- 41.28/100
- National rank
- #3519
- State rank
- #44 of 73 in FL
Livability — Inverness
- Score
- 67/100
- State rank
- #564
- US rank
- #10791
Category grades
Schools grade is shown separately in the Schools card above.
Census & demographics
- City population
- 10,621
- Population (ZIP)
- 10,408
Population outlook (Citrus County) Hauer SSP2
- Today (2025)
- 138,622 people
- By 2030
- 136,886 · -1.3%
- By 2040
- 132,009 · -4.8%
- By 2050
- 125,196 · -9.7%
- By 2075
- 108,570 · -21.7%
- By 2100
- 84,454 · -39.1%
Race, ethnicity, and origin ACS 2023
- Neighborhood character
- Predominantly White (81%)
- Race & ethnicity
- White 81% Two or more races 10% Hispanic / Latino 8% Asian 3% Black 1%
- Hispanic origin (detail)
- Mexican 3% Puerto Rican 3%
- Common ancestry
- Romanian 4% Slovak 3% Lithuanian 2%
- Foreign-born
- 8% · Canada
- Languages at home
- 90% English-only · Spanish 4% Other Indo-European 3% Tagalog/Filipino 1%
Political lean MEDSL · Citrus
- 2024 margin
- Solid R (+45.9) · D 26.8% · R 72.6%
- 2008→2024 swing
- -29.8pp toward R · 2008: -16.1pp · 2024: -45.9pp
- All cycles
- 2024: R+45.9 2020: R+41.0 2016: R+39.7 2012: R+21.9 2008: R+16.1
Not yet ingested
- Civics
- —
Market trends
- HPI YoY
- ▼ -72.56%
- Current HPI
- 315.9725
- Rent YoY
- —
- Metro
- —
- State GDP YoY
- ▲ 3.28%
- F500 in state
- 36
Industry mix (Fortune 500 HQ in FL)
| Industry | F500 HQs | Revenue |
|---|---|---|
| Industrial Technology | 2 | $29B |
|
||
| Insurance | 2 | $17B |
|
||
| Retail | 1 | $60B |
|
||
| Technology Distribution | 1 | $58B |
|
||
| Homebuilding | 1 | $35B |
|
||
| Technology Manufacturing | 1 | $35B |
|
||
Price history
+766.0% since first listed20 events — show timeline
- 2026-04-27 Listed $129,900 RACC
- 2026-04-21 Listing Removed — Stellar MLS as Distributed by MLS Grid
- 2026-03-19 Price Changed $145,000 RACC
- 2026-03-19 Price Changed $145,000 Stellar MLS as Distributed by MLS Grid
- 2026-02-16 Price Changed $149,900 RACC
- 2026-02-16 Price Changed $149,900 Stellar MLS as Distributed by MLS Grid
- 2026-01-23 Price Changed $153,000 RACC
- 2026-01-23 Price Changed $153,000 Stellar MLS as Distributed by MLS Grid
- 2026-01-07 Price Changed $155,000 Stellar MLS as Distributed by MLS Grid
- 2026-01-07 Price Changed $155,000 RACC
- 2025-12-09 Price Changed $157,900 RACC
- 2025-11-07 Listed $159,900 Stellar MLS as Distributed by MLS Grid
- 2025-01-17 Sold (MLS) $45,000 RACC
- 2025-01-06 Sold (Public Records) $45,000 Public Records
- 2024-12-05 Pending — RACC
- 2024-12-04 Listed $50,000 RACC
- 2010-04-06 Sold (Public Records) $50,000 Public Records
- 2007-01-11 Sold (Public Records) $80,000 Public Records
- 2005-12-02 Sold (Public Records) $69,900 Public Records
- 1995-08-01 Sold (Public Records) $15,000 Public Records
Property tax history
+6.7%/yrLatest (2025): $1,483 · +16.8% YoY. Source: county tax records.
Cash-flow waterfall
monthlySold comps — $/sqft
last 12 mo · ≤1 miLoading sold comps…