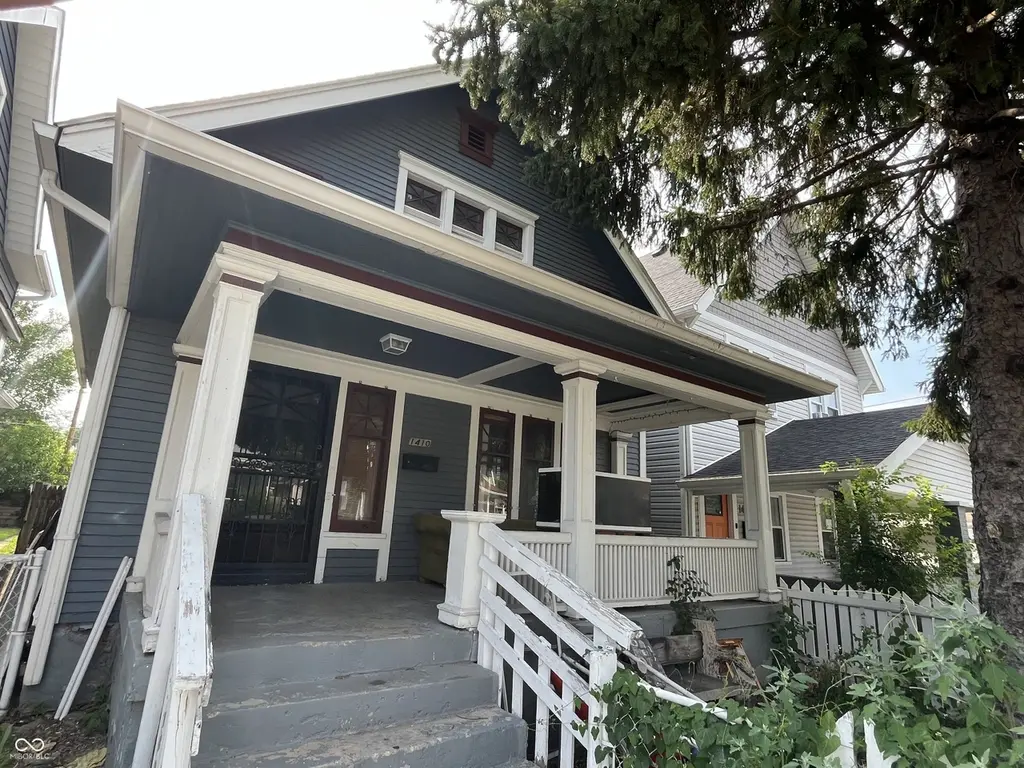
1410 Union St · Indianapolis city (balance), IN
Flood risk 6/10 · Moderate
- FEMA flood zone
- X (unshaded)
- Chance of flooding over 30 yrs
- 0.7%
- Est. flood insurance / yr
- $473 – $860
Fire risk 1/10 · Minimal
- Est. fire insurance / yr
- $717 – $1,331
Heat risk 4/10 · Minor
- Hot days now (above 101°F)
- 7 days/yr
- Hot days in 30 yrs
- 19 days/yr
Wind risk 2/10 · Minimal
- Chance of severe wind over 30 yrs
- —
Air-quality risk 3/10 · Minor
- Unhealthy air days now
- 2 days/yr
- Unhealthy air days in 30 yrs
- 3 days/yr
Risk factors via First Street. Map © Google.
Why this score? — see what drove the C grade
The composite is a weighted blend of 9 inputs, each scored 0–100. Each bar is that input's sub-score; the figure is the points it added to the 100-point composite (weight × sub-score).
- Cash flow +20.9/30.0
- ARV discount +15.0/15.0
- DSCR +6.6/10.0
- 1% rule +6.0/10.0
- Rent growth +5.0/5.0
- Livability +2.5/5.0
- Condition / age +2.5/5.0
- Schools +1.4/10.0
- Appreciation +0.0/10.0
$175,000
🖨 Deal sheet 📄 Offer letter ✓ Due diligence
Listing remarks MLS
Old South Side: Stunning Queen Anne Victiorian cottage with all the original architecture preserved. Hardwoods throughout the main floor, 10" stained trim, functioning pocket door, and original fireplace/ mantel/ and tile hearth, all in pristine condition. Open eat-in kitchen with large island/ breakfast bar. Each bedroom has large closets and it's own bathroom--secondary bedroom's bathroom also has a second door into a common area. Fully fenced back yard. **Important: Seller aquired and ingress easment along the north edge of the backyard, providing access for a garage if you wish to build one.
Key facts
- Original fireplace
- 3,006 sq ft lot
- Built 1890
Tags
Neighborhood map
What this means for you Summary
Snapshot
- This is a 3-bed/2.0-bath single-family listed at $175k.
Deal economics
- At list price, monthly cash flow is $243 ($3k/yr) — positive.
- The deal already cash-flows at list — no discount required.
- Meets the 1% rule at list price ($2k rent vs $175k).
- Recommended offer: $154k (12.0% below list) — sets the bar for market timing.
- Cap rate 8.0% vs local median 4.4% in Indianapolis city (balance) — top-decile yield for the area; either an underpriced asset or a hidden risk that comps aren't pricing in. Stress-test before assuming the spread holds.
Location & tenants
- Location reads: area grade C — affects rentability + tenant quality, not the cash-flow math above.
- Indianapolis Public Schools (urban): math 14% / reading 20% proficiency, ranked #286 of 301 in IN (top 95%) — low school quality limits family demand, transient renter base, plan for 1-2y turnover; 77% free/reduced lunch — lower-income household profile, screen leases tightly.
- Market conditions: Rents rising fast (+11.0%/yr); 129 active listings in the ZIP; 40 comparable units currently listed for rent nearby; rentals at typical pace (median 24d on market — plan ~3-4 weeks tenant-placement turnaround); 1,906 units permitted in Marion County in 2024 (621 in 5+ unit buildings).
- This rent runs 42% of the median local income ($55k/yr) — at the standard rent-burdened threshold; future hikes will face affordability resistance.
Forward outlook
- Local home prices are declining (-3.0%/yr); year-one equity from $1k of loan paydown is wiped out by about $5k of value loss. Plan a longer hold.
- Marion County population projected at +18% by 2050 — long-run rental-demand tailwind backs the buy-and-hold thesis.
- At projected returns (-3.0% appreciation + 8.0% rent growth), your $49k cash investment doubles in ~9 years — after that, you're playing with house money.
Negotiation context
- It's been on market 153 days — a 12% lower offer ($154k) is reasonable based on typical stale-listing flexibility.
- 5 sale attempts since 22y ago; this cycle's ask has dropped $15k (8%) from the opening price — seller is motivated, your offer sets the floor, not the list.
- Current owner paid $22k; list at $175k implies a 678% gain — meaningful room to come down on a strong offer.
Risks & watch-outs
- Watch-outs: built in 1890 — expect roof / HVAC / electrical / plumbing capex.
- Climate carrying-cost: major flood risk — expect insurance premiums to compound above CPI over the hold.
Questions for the listing agent
- It's been on market 153 days. Have you received any prior offers? Is the seller open to a 12% concession, seller financing, or rate buy-down credit?
- Built in 1890 — when were the roof, HVAC, electrical panel, plumbing, and water heater last replaced?
- Why hasn't it sold? Are there any deal-killer items the seller is aware of (foundation, flood, title, zoning, code violations)?
- Is there a deadline driving the sale (1031 exchange, divorce, estate, relocation)? That informs how much negotiation room exists.
- What's the average days-on-market for RENTAL listings here right now (not sales)? A rising rental-DOM trend means longer vacancies and softer asking-rent achievability than the comps imply.
- What's the recent tenant-quality profile in this submarket — average credit score on applications, eviction rate, late-payment / NSF rate, and stable-employment percentage? A property-management company in the area should have these aggregated.
- How much new for-sale + rental construction is in the pipeline within 1–3 miles? Heavy new supply typically softens prices + rents 12–24 months out; constrained supply supports both.
Investment metrics
- 1% rule
- 1.10% ✓
- Cap rate
- 7.96%
- Cash-on-cash
- 5.94%
- DSCR
- 1.26
- GRM
- 7.6
CMA / ARV
- ARV (median comp)
- $273,866
- List price
- $175,000
- Delta
- -36.10%
- Verdict
- UNDERPRICED
- Comps
- 20 within 1.0 mi
Show comp detail 12 sales within ~0.75 mi
| Address | Dist | Beds/Ba | Sqft | Sold | Price | $/sf | Match |
|---|---|---|---|---|---|---|---|
| 1214 S Talbott St | 0.21mi | 3/2.0 | 1,638 (-2%) | 4mo | $270,000 | $165 | 82 |
| 1750 Union St | 0.38mi | 4/2.0 (+1) | 1,641 (-2%) | 4mo | $229,000 | $140 | 70 |
| 1250 Union St | 0.14mi | 3/1.5 | 1,440 (-14%) | 1mo | $200,000 | $139 | 67 |
| 227 Sanders St | 0.28mi | 3/3.5 | 1,819 (+8%) | 2mo | $335,000 | $184 | 66 |
| 746 Parkway Ave | 0.63mi | 3/2.0 | 1,628 (-3%) | 2mo | $251,000 | $154 | 64 |
| 2134 S Delaware St | 0.70mi | 3/3.0 | 1,680 (0%) | 2mo | $195,000 | $116 | 62 |
| 619 Prospect St | 0.57mi | 3/1.5 | 1,564 (-7%) | 1mo | $264,000 | $169 | 59 |
| 518 Terrace Ave | 0.48mi | 3/2.5 | 1,869 (+11%) | 2mo | $335,000 | $179 | 56 |
| 706 E Minnesota St | 0.63mi | 3/3.5 | 1,589 (-5%) | 3mo | $202,000 | $127 | 53 |
| 711 Terrace Ave | 0.57mi | 3/2.0 | 1,475 (-12%) | 1mo | $323,500 | $219 | 52 |
| 1039 High St | 0.42mi | 2/1.0 (-1) | 1,497 (-11%) | 3mo | $120,000 | $80 | 51 |
| 14 E Regent St | 0.70mi | 3/2.5 | 1,496 (-11%) | 2mo | $270,000 | $180 | 45 |
Match score weights: distance 35% · size 25% · config 20% · recency 20%. Top-matched comps best support the ARV.
Projected returns pro-forma
-3.0% appreciation · 8.0% rent growth · sell at horizon
- IRR
- -1.4%
- Equity multiple
- 0.95×
- Total profit
- $-2,681
- Equity at exit
- $26,093
- IRR
- 13.2%
- Equity multiple
- 2.31×
- Total profit
- $64,062
- Equity at exit
- $15,131
Cash invested: $49,000 (down + closing). Projections, not guarantees.
Landlord ↔ Tenant lean methodology
- Overall (STATE)
- 90 Strongly Landlord-Friendly
- State Indiana
- 90 Strongly Landlord-Friendly · R+11
- County
- — inherits STATE
- City
- — inherits STATE
ZIP-level market 46225
- Home prices YoY
- -8.2%
- Rents YoY
- 11.0%
- Active inventory
- 129
- Price-to-rent
- 7.6×
Monthly cashflow live
- Estimated rent
- $1,921 high interval (Pro) →
- Mortgage (P&I)
- −$918
- Tax from tax record
- −$285 /mo · $3,417/yr
- Insurance
- −$73
- HOA
- −$0
- Vacancy / Maint / Mgmt
- −$404
- Net cashflow
- $243
Break-even live
UW: 25.0% down · 7.5% · 30yr · 1.5% tax · 5.0% vac · 8.0% maint · 8.0% mgmt
Financing live
Cash to close
- Down payment
- $43,750
- Closing costs
- $5,250
- Reserves months
- —
- Total cash needed
- —
Loan-product check · same deal, 3 products live
Conventional
25% down · 7.5% · 30yr
- Down + closing
- —
- Monthly P&I
- —
- Monthly cashflow
- —
- DSCR
- —
- Eligible?
- —
Personal DTI + credit; lowest rate.
DSCR
20% down · 8.5% · 30yr
- Down + closing
- —
- Monthly P&I
- —
- Monthly cashflow
- —
- DSCR
- —
- Eligible?
- —
No personal income docs; deal must DSCR.
Hard money
10% down · 12.0% · 12mo
- Down + closing
- —
- Monthly P&I
- —
- Monthly cashflow
- —
- DSCR
- —
- Eligible?
- —
Short-term bridge; refi at stabilization.
Rent comps 40 comps
| Address | Beds | Baths | Sqft | Rent | $/sqft | DOM | Units | Dist |
|---|---|---|---|---|---|---|---|---|
| 243 Terrace Ave Indianapolis, IN | 4.0 | 2.0 | 1669 | $2,700 | $1.62 | 18d | 1 | 0.30mi |
| 1713 S Delaware St Indianapolis, IN | 2.0 | 2.0 | 1785 | $1,700 | $0.95 | 44d | 1 | 0.38mi |
| 406 Orange St Indianapolis, IN | 3.0 | 2.5 | 1820 | $2,250 | $1.24 | 44d | 1 | 0.38mi |
| 1436 S New Jersey St Unit A Indianapolis, IN | 3.0 | 2.5 | 1300 | $2,100 | $1.62 | 24d | 1 | 0.40mi |
| 915 S Meridian St Indianapolis, IN | 2.0 | 1.0–2.0 | 829 | $2,551 | $3.08 | 2d | 42 | 0.43mi |
| 224 Iowa St Indianapolis, IN | 3.0 | 1.0 | 1254 | $1,450 | $1.16 | 24d | 1 | 0.44mi |
| 1439 South East St Indianapolis, IN | 2.0 | 2.0 | 1114 | $1,425 | $1.28 | 20d | 1 | 0.48mi |
| 1437 S East St Indianapolis, IN | 2.0 | 2.0 | 1114 | $1,425 | $1.28 | 44d | 1 | 0.49mi |
| 614 Parkway Ave Indianapolis, IN | 3.0 | 2.0 | 1360 | $1,900 | $1.40 | 22d | 1 | 0.53mi |
| 518 Prospect St Unit 1357365P Indianapolis, IN | 3.0 | 2.0 | 1614 | $2,594 | $1.61 | 7d | 1 | 0.53mi |
| 518 Prospect St Unit 1353834P Indianapolis, IN | 3.0 | 2.0 | 1603 | $2,442 | $1.52 | 15d | 1 | 0.53mi |
| 704 Sanders St Indianapolis, IN | 2.0 | 1.0 | 1290 | $1,275 | $0.99 | 24d | 1 | 0.58mi |
| 726 Parkway Ave Indianapolis, IN | 3.0 | 2.0 | 1150 | $2,195 | $1.91 | 17d | 1 | 0.61mi |
| 728 Cottage Ave Indianapolis, IN | 3.0 | 2.5 | 1831 | $2,550 | $1.39 | 24d | 1 | 0.62mi |
| 734 Parkway Ave Indianapolis, IN | 3.0 | 2.0 | 2110 | $2,299 | $1.09 | 24d | 1 | 0.62mi |
| 736 E Morris St Indianapolis, IN | 2.0 | 1.5 | 1500 | $1,195 | $0.80 | 4d | 1 | 0.64mi |
| 752 Cottage Ave Indianapolis, IN | 3.0 | 2.0 | 1548 | $1,750 | $1.13 | 15d | 1 | 0.66mi |
| 438 E Beecher St Indianapolis, IN | 3.0 | 2.5 | 1500 | $1,450 | $0.97 | 24d | 1 | 0.66mi |
| 1247 Wright St Indianapolis, IN | 3.0 | 1.5 | 1247 | $1,750 | $1.40 | 18d | 1 | 0.68mi |
| 1247 Wright St Indianapolis, IN | 3.0 | 1.5 | 1809 | $1,750 | $0.97 | 44d | 1 | 0.68mi |
| 714 Buchanan St Indianapolis, IN | 2.0 | 2.0 | 1100 | $1,995 | $1.81 | 15d | 1 | 0.70mi |
| 1830 Orleans St Indianapolis, IN | 3.0 | 2.5 | 1586 | $1,995 | $1.26 | 44d | 1 | 0.71mi |
| 835 Weghorst St Unit 837 Indianapolis, IN | 3.0 | 1.5 | 1500 | $1,399 | $0.93 | 24d | 1 | 0.73mi |
| 1833 Orleans St Unit 1 Indianapolis, IN | 3.0 | 1.0 | 1260 | $1,350 | $1.07 | 44d | 1 | 0.73mi |
| 620 E Beecher St Indianapolis, IN | 3.0 | 2.0 | 1072 | $1,639 | $1.53 | 20d | 1 | 0.75mi |
| 1835 Applegate St Indianapolis, IN | 4.0 | 3.0 | 2024 | $2,300 | $1.14 | 44d | 1 | 0.78mi |
| 907 Prospect St Unit 907 Prospect NO AMI Indianapolis, IN | 3.0 | 1.5 | 1121 | $1,400 | $1.25 | 24d | 1 | 0.82mi |
| 1514 Ringgold Ave Indianapolis, IN | 3.0 | 1.0 | 1064 | $1,295 | $1.22 | 44d | 1 | 0.82mi |
| 932 E Morris St Indianapolis, IN | 2.0 | 2.0 | 1483 | $1,900 | $1.28 | 3d | 1 | 0.84mi |
| 2109 Singleton St Indianapolis, IN | 3.0 | 2.0 | 1340 | $2,100 | $1.57 | 7d | 1 | 0.87mi |
| 1035 Sanders St Unit 163 Indianapolis, IN | 2.0 | 1.0 | 1481 | $1,921 | $1.30 | 44d | 1 | 0.91mi |
| 1012 Prospect St Unit 1527 Indianapolis, IN | 3.0 | 1.5 | 1150 | $1,200 | $1.04 | 44d | 1 | 0.92mi |
| 1012 Prospect St Unit 512 State 120% AMI Indianapolis, IN | 3.0 | 1.0 | 1200 | $1,400 | $1.17 | 44d | 1 | 0.92mi |
| 1012 Prospect St Unit 907 Prospect NO AMI Indianapolis, IN | 3.0 | 1.5 | 1121 | $1,400 | $1.25 | 44d | 1 | 0.92mi |
| 1045 Orange St Indianapolis, IN | 2.0 | 1.0 | 1232 | $2,000 | $1.62 | 24d | 1 | 0.93mi |
| 1045 Orange St Indianapolis, IN | 2.0 | 1.0 | 1232 | $2,200 | $1.79 | 44d | 1 | 0.93mi |
| 1140 Shelby St Apt 515 Indianapolis, IN | 2.0 | 2.0 | 1181 | $2,090 | $1.77 | 24d | 1 | 0.97mi |
| 2283 Union St Indianapolis, IN | 3.0 | 2.0 | 1824 | $1,820 | $1.00 | 24d | 1 | 0.97mi |
| 1012 Hosbrook St Indianapolis, IN | 2.0 | 2.5 | 1728 | $2,400 | $1.39 | 24d | 1 | 0.99mi |
| 229 S Delaware St Indianapolis, IN | 3.0 | 1.0–3.5 | 1207 | $4,758 | $3.94 | 2d | 54 | 1.00mi |
Listing history 25 events
-
2026-06-18days on market $175,000 Active 153 DOM
-
2026-06-17days on market $175,000 Active 152 DOM
-
2026-06-16days on market $175,000 Active 151 DOM
-
2026-06-15days on market $175,000 Active 150 DOM
-
2026-06-13days on market $175,000 Active 148 DOM
-
2026-06-13days on market $175,000 Active 147 DOM
-
2026-06-09days on market $175,000 Active 144 DOM
-
2026-06-08days on market $175,000 Active 143 DOM
-
2026-06-07days on market $175,000 Active 142 DOM
-
2026-06-03days on market $175,000 Active 138 DOM
-
2026-06-02days on market $175,000 Active 137 DOM
-
2026-06-01days on market $175,000 Active 136 DOM
-
2026-05-31days on market $175,000 Active 135 DOM
-
2026-01-16$189,900 Active 607-char remark
Show marketing remark (607 chars)
Old South Side: Stunning Queen Anne Victiorian cottage with all the original architecture preserved. Hardwoods throughout the main floor, 10" stained trim, functioning pocket door, and original fireplace/ mantel/ and tile hearth, all in pristine condition. Open eat-in kitchen with large island/ breakfast bar. Each bedroom has large closets and it's own bathroom--secondary bedroom's bathroom also has a second door into a common area. Fully fenced back yard. **Important: Seller aquired and ingress easment along the north edge of the backyard, providing access for a garage if you wish to build one.
-
2014-09-25historical 189-char remark
Show marketing remark (189 chars)
Charming Historic 1890's home! Gourmet kitchen, living room with fireplace, pocket doors with craftsmen detailing. Two Master Ensuites as well! Preferred downtown location. Won't last long!
-
2014-09-19soldstatus $22,500 189-char remark
Show marketing remark (189 chars)
Charming Historic 1890's home! Gourmet kitchen, living room with fireplace, pocket doors with craftsmen detailing. Two Master Ensuites as well! Preferred downtown location. Won't last long!
-
2014-07-07$29,500 189-char remark
Show marketing remark (189 chars)
Charming Historic 1890's home! Gourmet kitchen, living room with fireplace, pocket doors with craftsmen detailing. Two Master Ensuites as well! Preferred downtown location. Won't last long!
-
2010-09-18historical
-
2010-02-22$79,000
-
2009-03-17historical
-
2009-03-16soldstatus $13,500
-
2008-09-22$19,900
-
2005-02-28historical
-
2004-09-08$68,000
-
2001-03-09soldstatus $66,500
ⓘ Source: listings_history table (triggers on properties + properties_extension) + one-shot
backfill from property_details.listing_events for pre-trigger history.
Tax reassessment forecast IN · Partial reset (capped growth)
- Current annual tax
- $3,417 · $285/mo
- Projected year-2 tax
- $3,417 · $285/mo
- Expected delta
- $0/yr ($0/mo · 0.0%)
ⓘ Screening estimate from a state-policy table — verify with the county assessor before closing.
Climate risk First Street
- Flood 6/10 Major FEMA zone X (unshaded) · 70% chance over 30 yrs
- Wildfire 1/10 Low
- Heat 4/10 Moderate 7 d/yr ≥101°F today · 19 d/yr by 30 yrs out
- Wind 2/10 Low
- Air quality 3/10 Moderate 2 unhealthy d/yr today · 3 by 30 yrs out
Nearby sold comps map
Loading sold comps map…
Walkable amenities ~0.75 mi
Loading nearby amenities…
Taxation est. · year 1
- Rental income
- $23,058
- − Mortgage interest
- −$9,803
- − Property taxes
- −$3,417
- − Insurance
- −$875
- − Repairs & maintenance
- −$1,845
- − Management
- −$1,845
- − Depreciation
- −$5,091
- Taxable income
- $183
- Est. tax owed @ 24.0%
- −$44
- After-tax cash flow
- $2,867/yr
For passive investors: Depreciation is non-cash, so a rental often shows a tax loss while cash-flowing — sheltering income. Rental losses are passive: they offset passive income freely, and up to $25,000/yr can offset ordinary (W-2) income if you actively participate and your MAGI is under $100k (phasing out to $0 by $150k); unused losses carry forward. On sale, claimed depreciation is recaptured at up to 25%, and gains may owe capital-gains tax (a 1031 exchange can defer both). Figures are a year-1 estimate at your 24.0% rate — not tax advice; consult a CPA.
Schools (NCES district)
- District
- Indianapolis Public Schools
- NCES district ID
- 1804770
- Math proficiency
- 14% ▼ -7.00%
- Reading proficiency
- 20% ▼ -3.00%
- Median HH income
- $32,034
- Composite
- 13.69/100
- National rank
- #9499
- State rank
- #286 of 301 in IN
Livability — Indianapolis city (balance)
No livability data for this city. (Only ~50 U.S. cities are tracked.)
Census & demographics
- Census place
- Indianapolis city (balance), IN
- County
- Marion County · 998,460 people
- City population
- 881,119
- Metro
- Indianapolis-Carmel-Anderson, IN
- Population (ZIP)
- 6,037
- Household income
- $55,190
- Rent vs Own
- Severe rent burden
- 311.0
Population outlook (Marion County) Hauer SSP2
- Today (2025)
- 1,025,572 people
- By 2030
- 1,065,727 · +3.9%
- By 2040
- 1,141,577 · +11.3%
- By 2050
- 1,208,920 · +17.9%
- By 2075
- 1,367,288 · +33.3%
- By 2100
- 1,438,201 · +40.2%
Race, ethnicity, and origin ACS 2023
- Neighborhood character
- Predominantly White (68%)
- Race & ethnicity
- White 68% Two or more races 12% Black 11% Hispanic / Latino 10% Asian 2%
- Hispanic origin (detail)
- Mexican 6%
- Common ancestry
- Romanian 2% Italian 2% Slovak 1%
- Foreign-born
- 9% · Canada
- Languages at home
- 88% English-only · Spanish 10% German/W. Germanic 1%
Political lean MEDSL · Marion
- 2024 margin
- Strong D (+27.7) · D 63.0% · R 35.3% · Other 1.7%
- 2008→2024 swing
- -0.7pp no change · 2008: 28.4pp · 2024: 27.7pp
- All cycles
- 2024: D+27.7 2020: D+29.1 2016: D+22.8 2012: D+22.2 2008: D+28.4
Not yet ingested
- Civics
- —
Market trends
- HPI YoY
- ▼ -36.19%
- Current HPI
- 403.9271
- Rent YoY
- ▲ 10.98%
- Metro
- Indianapolis-Carmel-Anderson, IN
- State GDP YoY
- ▲ 2.90%
- F500 in state
- 18
Industry mix (Fortune 500 HQ in IN)
| Industry | F500 HQs | Revenue |
|---|---|---|
| Industrial Machinery | 2 | $37B |
|
||
| Healthcare | 1 | $177B |
|
||
| Pharmaceuticals | 1 | $45B |
|
||
| Metals / Steel | 1 | $18B |
|
||
| Agriculture | 1 | $17B |
|
||
| Packaging | 1 | $12B |
|
||
Price history
+185.6% since first listed12 events — show timeline
- 2026-01-16 Listed $189,900 MIBOR as Distributed by MLS Grid
- 2014-09-25 Listing Removed — MIBOR as Distributed by MLS Grid
- 2014-09-19 Sold (MLS) $22,500 MIBOR as Distributed by MLS Grid
- 2014-07-07 Listed $29,500 MIBOR as Distributed by MLS Grid
- 2010-09-18 Listing Removed — MIBOR as Distributed by MLS Grid
- 2010-02-22 Listed $79,000 MIBOR as Distributed by MLS Grid
- 2009-03-17 Listing Removed — MIBOR as Distributed by MLS Grid
- 2009-03-16 Sold (MLS) $13,500 MIBOR as Distributed by MLS Grid
- 2008-09-22 Listed $19,900 MIBOR as Distributed by MLS Grid
- 2005-02-28 Listing Removed — MIBOR as Distributed by MLS Grid
- 2004-09-08 Listed $68,000 MIBOR as Distributed by MLS Grid
- 2001-03-09 Sold (Public Records) $66,500 Public Records
Property tax history
+7.8%/yrLatest (2025): $3,417 · +7.4% YoY. Source: county tax records.
Cash-flow waterfall
monthlySold comps — $/sqft
last 12 mo · ≤1 miLoading sold comps…