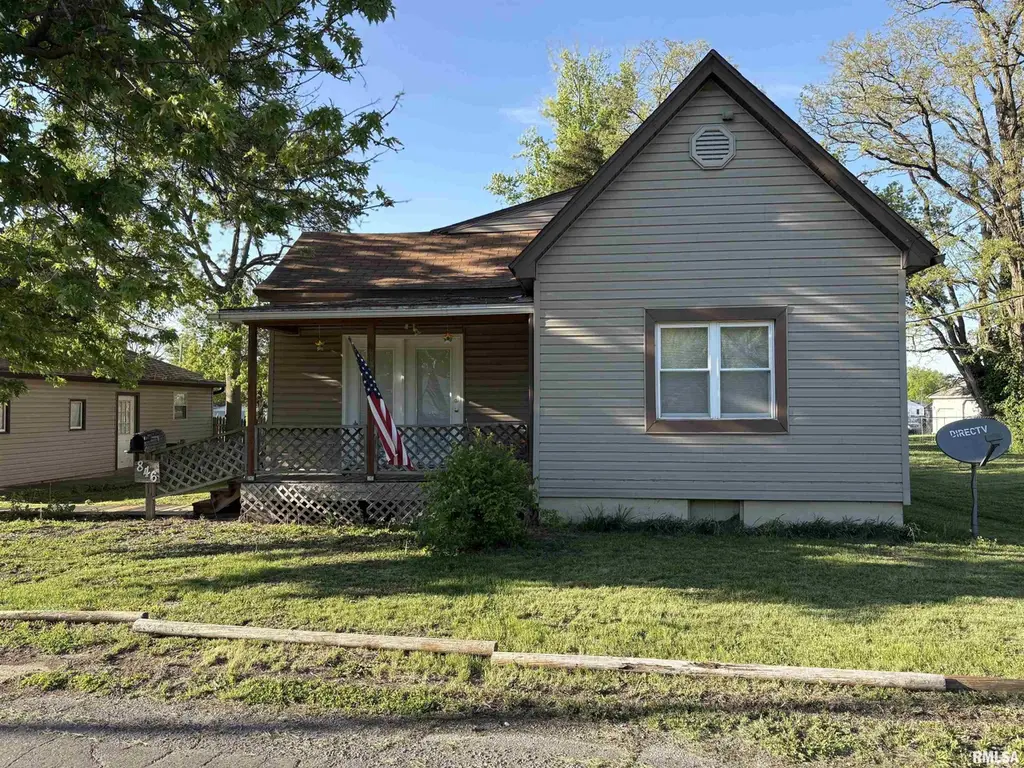
846 W Railroad St · Jacksonville, IL
Flood risk 1/10 · Minimal
- FEMA flood zone
- X (unshaded)
- Chance of flooding over 30 yrs
- 0.0%
- Est. flood insurance / yr
- $473 – $860
Fire risk 1/10 · Minimal
- Est. fire insurance / yr
- $804 – $1,492
Heat risk 4/10 · Minor
- Hot days now (above 105°F)
- 7 days/yr
- Hot days in 30 yrs
- 19 days/yr
Wind risk 2/10 · Minimal
- Chance of severe wind over 30 yrs
- 2.0%
Air-quality risk 2/10 · Minimal
- Unhealthy air days now
- 1 days/yr
- Unhealthy air days in 30 yrs
- 2 days/yr
Risk factors via First Street. Map © Google.
Why this score? — see what drove the B grade
The composite is a weighted blend of 9 inputs, each scored 0–100. Each bar is that input's sub-score; the figure is the points it added to the 100-point composite (weight × sub-score).
- Cash flow +28.0/30.0
- ARV discount +15.0/15.0
- DSCR +10.0/10.0
- 1% rule +8.2/10.0
- Livability +3.8/5.0
- Rent growth +2.5/5.0
- Condition / age +2.5/5.0
- Schools +1.9/10.0
- Appreciation +0.0/10.0
$65,500
🖨 Deal sheet 📄 Offer letter ✓ Due diligence
Listing remarks MLS
Cute starter home for single or couple. Lots of work done, newer roof, flooring, huge bath/laundry room with walk in closet, siding and windows all newer. Oversized 2.5 car garage with office space. Nice corner lot. 2nd bedroom is possible wwith addition of closet space. Large deck with some fencing.
Key facts
- Fenced back yard
- Deck
- Corner lot
Tags
Property features AI
Exterior
- Parking: Detached oversized garage on gravel — about 2.5 garage spaces
- Utilities: Public water; Public sewer
- Home design: Single family residence; Built in 1930; Total living area reported as 828
- Construction: Shingle roof; Not new construction
- Exterior features: Level lot; Lot dimensions approximately 112 x 100
Interior
- Kitchen: Kitchen on main level (vinyl flooring) — approximately 11.6 x 15 ft
- Bedrooms: 1 bedroom (main level) with egress window — approximately 11.6 x 14 ft; Additional room used as a 2nd bedroom (main level) — approximately 9 x 9.6 ft
- Flooring: Carpet in primary bedroom and living room; Vinyl in kitchen and additional room
- Bathrooms: One half bath
- Heating & cooling: Forced air heating; Window unit(s) for cooling
- Interior features: Cellar basement; No fireplaces
- Laundry & utility: Laundry area (currently used as bedroom 2)
Neighborhood map
What this means for you Summary
Snapshot
- This is a 1-bed/0.5-bath other listed at $66k.
Deal economics
- At list price, monthly cash flow is $204 ($2k/yr) — positive.
- The deal already cash-flows at list — no discount required.
- Meets the 1% rule at list price ($866 rent vs $66k).
- Recommended offer: $64k (3.0% below list) — sets the bar for market timing.
- Cap rate 10.0% vs local median 5.4% in Jacksonville — top-decile yield for the area; either an underpriced asset or a hidden risk that comps aren't pricing in. Stress-test before assuming the spread holds.
Location & tenants
- Location reads 76/100 on livability (#187 in IL, #3,543 nationally) — a middle-class / working-renter tenant base. Strengths: cost of living A+, housing A+, health & safety A+; Watch: crime C-, amenities C-, schools D.
- Jacksonville SD 117 (town): math 20% / reading 23% proficiency, ranked #407 of 620 in IL (top 66%) — low school quality limits family demand, transient renter base, plan for 1-2y turnover.
- Market conditions: 141 active listings in the ZIP; 2 comparable units currently listed for rent nearby; 3 units permitted in Morgan County in 2024 (0 in 5+ unit buildings).
Forward outlook
- Local home prices are declining (-3.0%/yr); year-one equity from $453 of loan paydown is wiped out by about $2k of value loss. Plan a longer hold.
- Morgan County population projected at -20% by 2050 — secular population decline; favor cash flow + early exit over multi-decade hold.
- At projected returns (-3.0% appreciation + 3.0% rent growth), your $18k cash investment doubles in ~9 years — after that, you're playing with house money.
Negotiation context
- It's been on market 50 days — a 3% lower offer ($64k) is reasonable based on typical stale-listing flexibility.
- 2 sale attempts since 16y ago; this cycle's ask has dropped $13k (17%) from the opening price — seller is motivated, your offer sets the floor, not the list.
- Current owner paid $26k; list at $66k implies a 152% gain — meaningful room to come down on a strong offer.
Risks & watch-outs
- Watch-outs: built in 1930 — expect roof / HVAC / electrical / plumbing capex.
Questions for the listing agent
- It's been on market 50 days. Have you received any prior offers? Is the seller open to a 3% concession, seller financing, or rate buy-down credit?
- Built in 1930 — when were the roof, HVAC, electrical panel, plumbing, and water heater last replaced?
- Is there a deadline driving the sale (1031 exchange, divorce, estate, relocation)? That informs how much negotiation room exists.
- Schools are D-rated, which usually means shorter tenancies and higher turnover. Who's the typical renter profile here, and what's been the actual vacancy rate?
- What's the average days-on-market for RENTAL listings here right now (not sales)? A rising rental-DOM trend means longer vacancies and softer asking-rent achievability than the comps imply.
- What's the recent tenant-quality profile in this submarket — average credit score on applications, eviction rate, late-payment / NSF rate, and stable-employment percentage? A property-management company in the area should have these aggregated.
- How much new for-sale + rental construction is in the pipeline within 1–3 miles? Heavy new supply typically softens prices + rents 12–24 months out; constrained supply supports both.
Investment metrics
- 1% rule
- 1.32% ✓
- Cap rate
- 10.04%
- Cash-on-cash
- 13.37%
- DSCR
- 1.60
- GRM
- 6.3
CMA / ARV
- ARV (median comp)
- $88,738
- List price
- $65,500
- Delta
- -26.19%
- Verdict
- UNDERPRICED
- Comps
- 20 within 1.0 mi
Projected returns pro-forma
-3.0% appreciation · 3.0% rent growth · sell at horizon
- IRR
- 3.4%
- Equity multiple
- 1.13×
- Total profit
- $2,435
- Equity at exit
- $9,766
- IRR
- 13.0%
- Equity multiple
- 2.04×
- Total profit
- $19,005
- Equity at exit
- $5,663
Cash invested: $18,340 (down + closing). Projections, not guarantees.
Landlord ↔ Tenant lean methodology
- Overall (STATE)
- 43 Moderately Tenant-Leaning
- State Illinois
- 43 Moderately Tenant-Leaning · D+7
- County
- — inherits STATE
- City
- — inherits STATE
ZIP-level market 62650
- Active inventory
- 141
- Price-to-rent
- 6.3×
Monthly cashflow live
- Estimated rent
- $866 medium interval (Pro) →
- Mortgage (P&I)
- −$343
- Tax from tax record
- −$109 /mo · $1,308/yr
- Insurance
- −$27
- HOA
- −$0
- Vacancy / Maint / Mgmt
- −$182
- Net cashflow
- $204
Break-even live
UW: 25.0% down · 7.5% · 30yr · 1.5% tax · 5.0% vac · 8.0% maint · 8.0% mgmt
Financing live
Cash to close
- Down payment
- $16,375
- Closing costs
- $1,965
- Reserves months
- —
- Total cash needed
- —
Loan-product check · same deal, 3 products live
Conventional
25% down · 7.5% · 30yr
- Down + closing
- —
- Monthly P&I
- —
- Monthly cashflow
- —
- DSCR
- —
- Eligible?
- —
Personal DTI + credit; lowest rate.
DSCR
20% down · 8.5% · 30yr
- Down + closing
- —
- Monthly P&I
- —
- Monthly cashflow
- —
- DSCR
- —
- Eligible?
- —
No personal income docs; deal must DSCR.
Hard money
10% down · 12.0% · 12mo
- Down + closing
- —
- Monthly P&I
- —
- Monthly cashflow
- —
- DSCR
- —
- Eligible?
- —
Short-term bridge; refi at stabilization.
Rent comps 2 comps
| Address | Beds | Baths | Sqft | Rent | $/sqft | DOM | Units | Dist |
|---|---|---|---|---|---|---|---|---|
| 328 E State St Unit 2 Jacksonville, IL | — | 1.0 | 750 | $975 | $1.30 | 43d | 1 | 1.02mi |
| 800 Illinois Ave Jacksonville, IL | 1.0 | 1.0 | 625 | $700 | $1.12 | 43d | 1 | 1.30mi |
Listing history 19 events
-
2026-06-18days on market $65,500 Active 50 DOM
-
2026-06-17days on market $65,500 Active 49 DOM
-
2026-06-16days on market $65,500 Active 48 DOM
-
2026-06-15days on market $65,500 Active 47 DOM
-
2026-06-13days on market $65,500 Active 45 DOM
-
2026-06-12days on market $65,500 Active 44 DOM
-
2026-06-09days on market $65,500 Active 41 DOM
-
2026-06-08days on market $65,500 Active 40 DOM
-
2026-06-07days on market $65,500 Active 39 DOM
-
2026-06-07days on market $65,500 Active 38 DOM
-
2026-06-04days on market $65,500 Active 35 DOM
-
2026-06-02days on market $65,500 Active 34 DOM
-
2026-06-01days on market $65,500 Active 33 DOM
-
2026-05-31days on market $65,500 Active 32 DOM
-
2026-05-31days on market $65,500 Active 31 DOM
-
2026-05-08price $65,500 860-char remark
-
2026-04-28$78,500 Active 860-char remark
-
2010-12-22soldstatus $26,000 301-char remark
Show marketing remark (301 chars)
Cute starter home for single or couple. Lots of work done, newer roof, flooring, huge bath/laundry room with walk in closet, siding and windows all newer. Oversized 2.5 car garage with office space. Nice corner lot. 2nd bedroom is possible wwith addition of closet space. Large deck with some fencing.
-
2010-10-28$25,900 301-char remark
Show marketing remark (301 chars)
Cute starter home for single or couple. Lots of work done, newer roof, flooring, huge bath/laundry room with walk in closet, siding and windows all newer. Oversized 2.5 car garage with office space. Nice corner lot. 2nd bedroom is possible wwith addition of closet space. Large deck with some fencing.
ⓘ Source: listings_history table (triggers on properties + properties_extension) + one-shot
backfill from property_details.listing_events for pre-trigger history.
Tax reassessment forecast IL · Partial reset (capped growth)
- Current annual tax
- $1,308 · $109/mo
- Projected year-2 tax
- $1,397 · $116/mo
- Expected delta
- +$90/yr (+$7/mo · 6.8%)
ⓘ Screening estimate from a state-policy table — verify with the county assessor before closing.
Climate risk First Street
- Flood 1/10 Low FEMA zone X (unshaded) · 0% chance over 30 yrs
- Wildfire 1/10 Low
- Heat 4/10 Moderate 7 d/yr ≥105°F today · 19 d/yr by 30 yrs out
- Wind 2/10 Low 2% chance of damaging wind over 30 yrs
- Air quality 2/10 Low 1 unhealthy d/yr today · 2 by 30 yrs out
Nearby sold comps map
Loading sold comps map…
Walkable amenities ~0.75 mi
Loading nearby amenities…
Taxation est. · year 1
- Rental income
- $10,392
- − Mortgage interest
- −$3,669
- − Property taxes
- −$1,308
- − Insurance
- −$328
- − Repairs & maintenance
- −$831
- − Management
- −$831
- − Depreciation
- −$1,905
- Taxable income
- $1,520
- Est. tax owed @ 24.0%
- −$365
- After-tax cash flow
- $2,088/yr
For passive investors: Depreciation is non-cash, so a rental often shows a tax loss while cash-flowing — sheltering income. Rental losses are passive: they offset passive income freely, and up to $25,000/yr can offset ordinary (W-2) income if you actively participate and your MAGI is under $100k (phasing out to $0 by $150k); unused losses carry forward. On sale, claimed depreciation is recaptured at up to 25%, and gains may owe capital-gains tax (a 1031 exchange can defer both). Figures are a year-1 estimate at your 24.0% rate — not tax advice; consult a CPA.
Schools (NCES district)
- District
- Jacksonville SD 117
- NCES district ID
- 1720280
- Math proficiency
- 20% ▼ -3.00%
- Reading proficiency
- 23% ▼ -6.00%
- Median HH income
- $44,909
- Composite
- 18.66/100
- National rank
- #8888
- State rank
- #407 of 620 in IL
Livability — Jacksonville
- Score
- 76/100
- State rank
- #187
- US rank
- #3543
Category grades
Schools grade is shown separately in the Schools card above.
Census & demographics
- Census place
- Jacksonville, IL
- City population
- 24,318
- Population (ZIP)
- 24,318
Population outlook (Morgan County) Hauer SSP2
- Today (2025)
- 32,874 people
- By 2030
- 31,698 · -3.6%
- By 2040
- 29,050 · -11.6%
- By 2050
- 26,381 · -19.8%
- By 2075
- 20,235 · -38.4%
- By 2100
- 14,324 · -56.4%
Race, ethnicity, and origin ACS 2023
- Neighborhood character
- Predominantly White (85%)
- Race & ethnicity
- White 85% Black 7% Two or more races 5% Hispanic / Latino 3%
- Common ancestry
- Lithuanian 2% Slovak 1% Iranian 1%
- Foreign-born
- 1% · Canada, South Korea
- Languages at home
- 97% English-only · Spanish 2%
Political lean MEDSL · Morgan
- 2024 margin
- Solid R (+32.5) · D 33.1% · R 65.6% · Other 1.3%
- 2008→2024 swing
- -31.7pp toward R · 2008: -0.8pp · 2024: -32.5pp
- All cycles
- 2024: R+32.5 2020: R+31.8 2016: R+29.9 2012: R+15.4 2008: R+0.8
Not yet ingested
- Civics
- —
Market trends
- HPI YoY
- ▼ -84.33%
- Current HPI
- 126.5712
- Rent YoY
- —
- Metro
- —
- State GDP YoY
- ▲ 1.59%
- F500 in state
- 60
Industry mix (Fortune 500 HQ in IL)
| Industry | F500 HQs | Revenue |
|---|---|---|
| Insurance | 4 | $201B |
|
||
| Consumer Goods | 4 | $87B |
|
||
| Industrial Machinery | 3 | $64B |
|
||
| Healthcare | 2 | $55B |
|
||
| Retail / Pharmacy | 1 | $148B |
|
||
| Agriculture / Food | 1 | $86B |
|
||
Price history
+152.9% since first listed4 events — show timeline
- 2026-05-08 Price Changed $65,500 RMLSA as Distributed by MLS Grid
- 2026-04-28 Listed $78,500 RMLSA as Distributed by MLS Grid
- 2010-12-22 Sold (MLS) $26,000 RMLSA as Distributed by MLS Grid
- 2010-10-28 Listed $25,900 RMLSA as Distributed by MLS Grid
Property tax history
+9.7%/yrLatest (2025): $1,308 · +7.3% YoY. Source: county tax records.
Cash-flow waterfall
monthlySold comps — $/sqft
last 12 mo · ≤1 miLoading sold comps…