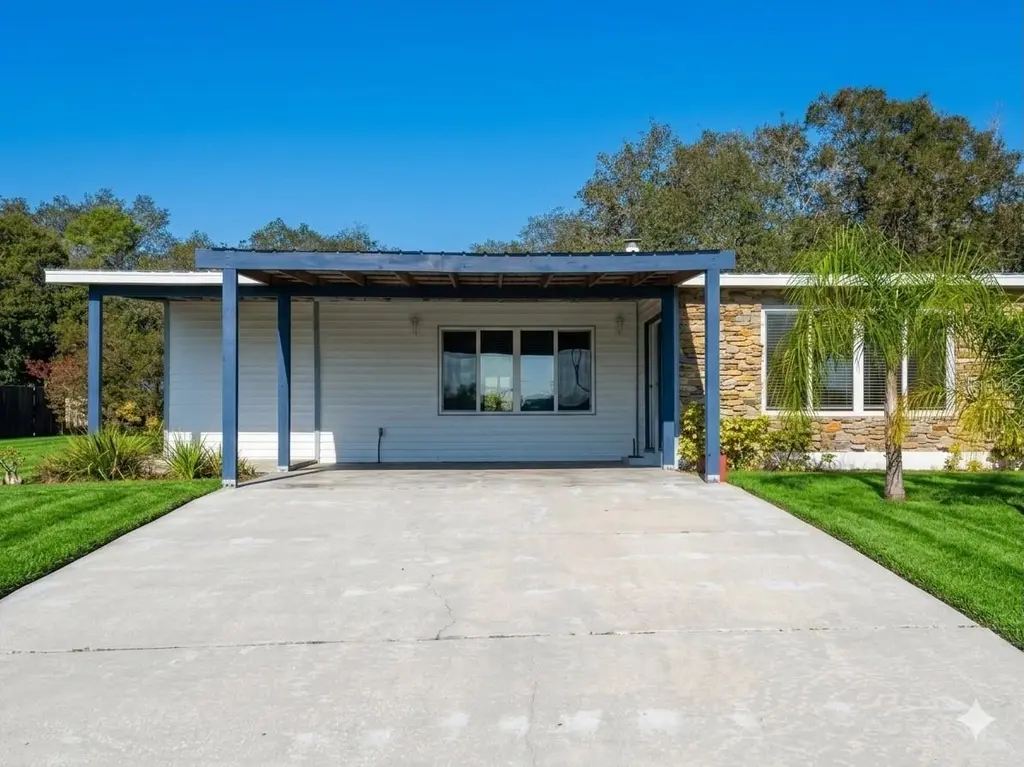
6423 Old Oak Ave · Sebring, FL
Flood risk 1/10 · Minimal
- FEMA flood zone
- X (unshaded)
- Chance of flooding over 30 yrs
- 0.0%
- Est. flood insurance / yr
- $507 – $1,088
Fire risk 6/10 · Moderate
- Est. fire insurance / yr
- $947 – $1,759
Heat risk 8/10 · Major
- Hot days now (above 108°F)
- 7 days/yr
- Hot days in 30 yrs
- 25 days/yr
Wind risk 10/10 · Severe
- Chance of severe wind over 30 yrs
- 99.0%
Air-quality risk 2/10 · Minimal
- Unhealthy air days now
- 1 days/yr
- Unhealthy air days in 30 yrs
- 1 days/yr
Risk factors via First Street. Map © Google.
Why this score? — see what drove the C grade
The composite is a weighted blend of 9 inputs, each scored 0–100. Each bar is that input's sub-score; the figure is the points it added to the 100-point composite (weight × sub-score).
- Cash flow +17.1/30.0
- ARV discount +15.0/15.0
- DSCR +5.3/10.0
- Appreciation +5.0/10.0
- Schools +3.6/10.0
- 1% rule +3.4/10.0
- Livability +3.3/5.0
- Rent growth +2.5/5.0
- Condition / age +2.5/5.0
$141,900
🖨 Deal sheet (PDF) 📄 Offer letter ✓ Due diligence
Listing remarks
Under contract-accepting backup offers. Located in the quiet Oakwood neighborhood of Sebring, Florida, 6423 Old Oak Avenue is a well-proportioned manufactured home that combines functional living with a generous outdoor footprint. This property is an excellent opportunity for those seeking a primary residence or a seasonal Florida retreat in a region known for its pristine lakes and world-class racing. Spacious Interior: This 3-bedroom, 2-bathroom home offers approximately 1,288 square feet of living space, featuring an open and practical one-story layout. Large Lot: Situated on a 0.34-acre (approx. 15,000 sq. ft. ) lot, providing ample room for outdoor activities, gardening, or potential p
Key facts
- Metal roof
- Large lot
- Masonry foundation
Tags
Property features AI
Finance
- Other: Approximately 0.34-acre lot (1/4 to less than 1/2 acre)
- Financial info: Homestead exemption recorded; No lease restrictions indicated
- HOA & community: No association
Exterior
- Parking: Carport with 2 spaces
- Utilities: Public water; Septic tank; Electricity connected; Cable available; Broadband/high-speed internet available
- Home design: Manufactured double-wide home; One story; North-facing
- Construction: Metal siding and stone exterior; Metal roof; Slab foundation; Built as a manufactured home
- Exterior features: Private mailbox; Sliding doors; Paved road access; Lot dimensions approximately 100 x 140
Interior
- Kitchen: Range; Microwave; Refrigerator; Electric water heater
- Bedrooms: 3 bedrooms
- Flooring: Laminate; Tile
- Bathrooms: 2 full bathrooms
- Heating & cooling: Central heating; Central air conditioning
- Interior features: Open floorplan; Living room/dining room combo; Split bedroom layout; Fireplace in family room
- Laundry & utility: Washer; Dryer; Laundry room inside
Neighborhood map
What this means for you Summary
Snapshot
- This is a 3-bed/2.0-bath manufactured listed at $142k.
Deal economics
- At list price, monthly cash flow is $98 ($1k/yr) — positive.
- The deal already cash-flows at list — no discount required.
- To meet the 1% rule (rent ≥ 1% of price), the offer needs to be $120k (15.7% below list).
- Recommended offer: $120k (15.7% below list) — sets the bar for 1% rule.
- Cap rate 7.1% vs local median 4.3% in Sebring — top-decile yield for the area; either an underpriced asset or a hidden risk that comps aren't pricing in. Stress-test before assuming the spread holds.
Location & tenants
- Location reads 66/100 on livability (#618 in FL) — a middle-class / working-renter tenant base. Strengths: cost of living A+, housing A+, health & safety A; Watch: amenities F, commute F, employment F.
- Highlands (other): math 45% / reading 43% proficiency, ranked #54 of 73 in FL (top 74%) — families likely to look elsewhere, expect single-tenant / working-renter base with shorter leases; 68% free/reduced lunch — lower-income household profile, screen leases tightly.
- Zoned schools: Cracker Trail Elementary School (math 60% / reading 58%, grade B-, #722 of 2,144 statewide, top 34%, 692 students, 62% FRL); Sebring Middle School (math 52% / reading 40%, grade D+, #300 of 571 statewide, top 53%, 815 students, 64% FRL); Sebring High School (math 32% / reading 48%, grade F, #296 of 667 statewide, top 45%, 1,809 students, 56% FRL).
- Market conditions: 211 active listings in the ZIP; 980 units permitted in Highlands County in 2024 (80 in 5+ unit buildings).
Forward outlook
- In year one you build about $982 of equity ($981 loan paydown + $1 appreciation (0.0% local appreciation)).
- At projected returns (0.0% appreciation + 3.0% rent growth), your $40k cash investment doubles in ~10 years — after that, you're playing with house money.
Negotiation context
- It's been on market 62 days — a 6% lower offer ($133k) is reasonable based on typical stale-listing flexibility.
- 2 sale attempts; this cycle's ask has dropped $10k (7%) from the opening price — seller is motivated, your offer sets the floor, not the list.
- Current owner paid $14k; list at $142k implies a 951% gain — meaningful room to come down on a strong offer.
Risks & watch-outs
- Climate carrying-cost: severe wind risk, 99% chance of damaging wind over 30y; major wildfire risk; extreme-heat days projected 7→25/yr by 2055 (HVAC capex compounding) — expect insurance premiums to compound above CPI over the hold.
Questions for the listing agent
- It's been on market 62 days. Have you received any prior offers? Is the seller open to a 16% concession, seller financing, or rate buy-down credit?
- Why hasn't it sold? Are there any deal-killer items the seller is aware of (foundation, flood, title, zoning, code violations)?
- Is there a deadline driving the sale (1031 exchange, divorce, estate, relocation)? That informs how much negotiation room exists.
- Schools are D-rated, which usually means shorter tenancies and higher turnover. Who's the typical renter profile here, and what's been the actual vacancy rate?
- What's the average days-on-market for RENTAL listings here right now (not sales)? A rising rental-DOM trend means longer vacancies and softer asking-rent achievability than the comps imply.
- What's the recent tenant-quality profile in this submarket — average credit score on applications, eviction rate, late-payment / NSF rate, and stable-employment percentage? A property-management company in the area should have these aggregated.
- How much new for-sale + rental construction is in the pipeline within 1–3 miles? Heavy new supply typically softens prices + rents 12–24 months out; constrained supply supports both.
Investment metrics
- 1% rule
- 0.84% ✗
- Cap rate
- 7.12%
- Cash-on-cash
- 2.95%
- DSCR
- 1.13
- GRM
- 9.9
CMA / ARV
- ARV (on-the-fly)
- $186,760
- Comps found
- 2
Show comp detail 2 sales within ~0.75 mi
| Address | Dist | Beds/Ba | Sqft | Sold | Price | $/sf | Match |
|---|---|---|---|---|---|---|---|
| 6439 Oceanside Ave | 0.14mi | 3/2.0 | 1,404 (+9%) | 24mo | $179,900 | $128 | 59 |
| 6604 County Road 17 S | 0.45mi | 2/2.0 (-1) | 1,272 (-1%) | 23mo | $185,000 | $145 | 52 |
Match score weights: distance 35% · size 25% · config 20% · recency 20%. Top-matched comps best support the ARV.
Projected returns pro-forma
0.0% appreciation · 3.0% rent growth · sell at horizon
- IRR
- 1.1%
- Equity multiple
- 1.05×
- Total profit
- $2,016
- Equity at exit
- $41,210
- IRR
- 6.5%
- Equity multiple
- 1.71×
- Total profit
- $28,133
- Equity at exit
- $49,543
Cash invested: $39,732 (down + closing). Projections, not guarantees.
Landlord ↔ Tenant lean methodology
- Overall (STATE)
- 87 Strongly Landlord-Friendly
- State Florida
- 87 Strongly Landlord-Friendly · R+3
- County
- — inherits STATE
- City
- — inherits STATE
ZIP-level market 33876
- Home prices YoY
- 0.0%
- Active inventory
- 211
- Price-to-rent
- 9.9×
Monthly cashflow live
- Estimated rent
- $1,196 medium interval (Pro) →
- Mortgage (P&I)
- −$744
- Tax from tax record
- −$44 /mo · $522/yr
- Insurance
- −$59
- HOA
- −$0
- Vacancy / Maint / Mgmt
- −$251
- Net cashflow
- $98
Break-even live
Sensitivity live
| Price | -10% $178 | -5% $138 | +0% $98 | +5% $58 | +10% $17 |
|---|---|---|---|---|---|
| Rent | -10% $3 | -5% $51 | +0% $98 | +5% $145 | +10% $192 |
| Rate | -1.0pp $169 | -0.5pp $134 | base $98 | +0.5pp $61 | +1.0pp $24 |
UW: 25.0% down · 7.5% · 30yr · 1.5% tax · 5.0% vac · 8.0% maint · 8.0% mgmt
Financing live
Cash to close
- Down payment
- $35,475
- Closing costs
- $4,257
- Reserves months
- —
- Total cash needed
- —
Loan-product check · same deal, 3 products live
Conventional
25% down · 7.5% · 30yr
- Down + closing
- —
- Monthly P&I
- —
- Monthly cashflow
- —
- DSCR
- —
- Eligible?
- —
Personal DTI + credit; lowest rate.
DSCR
20% down · 8.5% · 30yr
- Down + closing
- —
- Monthly P&I
- —
- Monthly cashflow
- —
- DSCR
- —
- Eligible?
- —
No personal income docs; deal must DSCR.
Hard money
10% down · 12.0% · 12mo
- Down + closing
- —
- Monthly P&I
- —
- Monthly cashflow
- —
- DSCR
- —
- Eligible?
- —
Short-term bridge; refi at stabilization.
Listing history 8 events
-
2026-06-01statusdays on market $141,900 Pending 62 DOM
-
2026-05-31days on market $141,900 Active 61 DOM
-
2026-05-30days on market $141,900 Active 60 DOM
-
2026-05-07price $141,900
-
2026-04-20status Active
-
2026-04-16status Pending
-
2026-03-27$151,900 Active
-
1993-04-01soldstatus $13,500
ⓘ Source: listings_history table (triggers on properties + properties_extension) + one-shot
backfill from property_details.listing_events for pre-trigger history.
Tax reassessment forecast FL · Resets to sale price
- Current annual tax
- $522 · $44/mo
- Projected year-2 tax
- $1,178 · $98/mo
- Expected delta
- +$656/yr (+$55/mo · 125.6%)
ⓘ Screening estimate from a state-policy table — verify with the county assessor before closing.
Climate risk First Street
- Flood 1/10 Low FEMA zone X (unshaded) · 0% chance over 30 yrs
- Wildfire 6/10 Major
- Heat 8/10 Severe 7 d/yr ≥108°F today · 25 d/yr by 30 yrs out
- Wind 10/10 Extreme 99% chance of damaging wind over 30 yrs
- Air quality 2/10 Low 1 unhealthy d/yr today · 1 by 30 yrs out
Nearby sold comps map
Loading sold comps map…
Walkable amenities ~0.75 mi
Loading nearby amenities…
Taxation est. · year 1
- Rental income
- $14,347
- − Mortgage interest
- −$7,949
- − Property taxes
- −$522
- − Insurance
- −$710
- − Repairs & maintenance
- −$1,148
- − Management
- −$1,148
- − Depreciation
- −$4,128
- Taxable loss
- −$1,257
- Est. tax savings @ 24.0%
- +$302
- After-tax cash flow
- $1,474/yr
For passive investors: Depreciation is non-cash, so a rental often shows a tax loss while cash-flowing — sheltering income. Rental losses are passive: they offset passive income freely, and up to $25,000/yr can offset ordinary (W-2) income if you actively participate and your MAGI is under $100k (phasing out to $0 by $150k); unused losses carry forward. On sale, claimed depreciation is recaptured at up to 25%, and gains may owe capital-gains tax (a 1031 exchange can defer both). Figures are a year-1 estimate at your 24.0% rate — not tax advice; consult a CPA.
Schools (NCES district)
- District
- Highlands
- NCES district ID
- 1200840
- Math proficiency
- 45% ▼ -7.00%
- Reading proficiency
- 43% ▼ -3.00%
- Median HH income
- $35,276
- Composite
- 36.42/100
- National rank
- #4672
- State rank
- #54 of 73 in FL
Livability — Sebring
- Score
- 66/100
- State rank
- #618
- US rank
- #11992
Category grades
Schools grade is shown separately in the Schools card above.
Census & demographics
- City population
- 50,797
- Population (ZIP)
- 7,378
Population outlook (Highlands County) Hauer SSP2
- Today (2025)
- 99,674 people
- By 2030
- 99,615 · -0.1%
- By 2040
- 99,342 · -0.3%
- By 2050
- 98,242 · -1.4%
- By 2075
- 93,291 · -6.4%
- By 2100
- 79,894 · -19.8%
Race, ethnicity, and origin ACS 2023
- Neighborhood character
- Predominantly White (71%)
- Race & ethnicity
- White 71% Hispanic / Latino 20% Two or more races 11% Black 3%
- Hispanic origin (detail)
- Mexican 12% Puerto Rican 3% Cuban 4%
- Common ancestry
- Scotch-Irish 4% Lithuanian 3% Iranian 2%
- Foreign-born
- 8% · Canada
- Languages at home
- 82% English-only · Spanish 17% Tagalog/Filipino 0%
Political lean MEDSL · Highlands
- 2024 margin
- Solid R (+40.8) · D 29.3% · R 70.1%
- 2008→2024 swing
- -22.7pp toward R · 2008: -18.1pp · 2024: -40.8pp
- All cycles
- 2024: R+40.8 2020: R+34.4 2016: R+32.0 2012: R+23.0 2008: R+18.1
Not yet ingested
- Civics
- —
Market trends
- HPI YoY
- ▬ 0.00%
- Current HPI
- 269.3526
- Rent YoY
- —
- Metro
- —
- State GDP YoY
- ▲ 3.28%
- F500 in state
- 36
Industry mix (Fortune 500 HQ in FL)
| Industry | F500 HQs | Revenue |
|---|---|---|
| Industrial Technology | 2 | $29B |
|
||
| Insurance | 2 | $17B |
|
||
| Retail | 1 | $60B |
|
||
| Technology Distribution | 1 | $58B |
|
||
| Homebuilding | 1 | $35B |
|
||
| Technology Manufacturing | 1 | $35B |
|
||
Price history
+951.1% since first listed5 events — show timeline
- 2026-05-07 Price Changed $141,900 Stellar MLS as Distributed by MLS Grid
- 2026-04-20 Relisted — Stellar MLS as Distributed by MLS Grid
- 2026-04-16 Pending — Stellar MLS as Distributed by MLS Grid
- 2026-03-27 Listed $151,900 Stellar MLS as Distributed by MLS Grid
- 1993-04-01 Sold (Public Records) $13,500 Public Records
Property tax history
+5.8%/yrLatest (2025): $522 · +4.4% YoY. Source: county tax records.
Cash-flow waterfall
monthlySold comps — $/sqft
last 12 mo · ≤1 miLoading sold comps…