0 Third St · Leakey, TX
Flood risk No data
- FEMA flood zone
- —
- Chance of flooding over 30 yrs
- —
- Est. flood insurance / yr
- —
Fire risk No data
- Est. fire insurance / yr
- —
Heat risk No data
- Hot days now (above threshold)
- —
- Hot days in 30 yrs
- —
Wind risk No data
- Chance of severe wind over 30 yrs
- —
Air-quality risk No data
- Unhealthy air days now
- —
- Unhealthy air days in 30 yrs
- —
Risk factors via First Street. Map © Google.
Why this score? — see what drove the D- grade
The composite is a weighted blend of 9 inputs, each scored 0–100. Each bar is that input's sub-score; the figure is the points it added to the 100-point composite (weight × sub-score).
- ARV discount +7.5/15.0
- Cash flow +7.2/30.0
- Appreciation +6.5/10.0
- Schools +3.8/10.0
- Livability +2.7/5.0
- Rent growth +2.5/5.0
- Condition / age +2.5/5.0
- 1% rule +2.0/10.0
- DSCR +1.3/10.0
$145,000
🖨 Deal sheet (PDF) 📄 Offer letter ✓ Due diligence
Listing remarks MLS
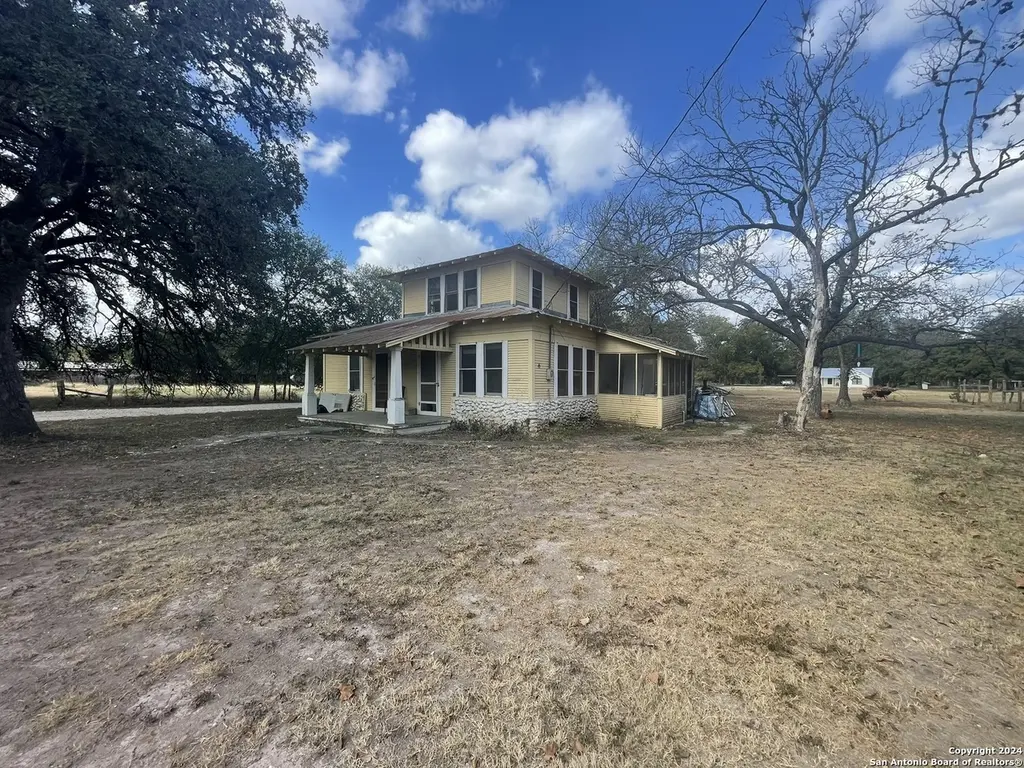
Quintessential elements abounding throughout this historic 1900's home located on .3 of acre lot TBS in Leakey Texas. Sears & Roebuck catalog home with some TLC can make someone a forever home. Large pecan tree in the back yard with all city utilities available. The home consists of 2 bedrooms 1bath and approximately 1200 sq ft. Fireplace, large front porch and some other features make this home feel cozy, warm and with the right touches of preserving some history, this home could be in a historic
Key facts
- Large pecan tree
- Large front porch
- Historic home
Tags
Neighborhood map
What this means for you Summary
Snapshot
- This is a 2-bed/1.0-bath single-family listed at $145k.
Deal economics
- At list price, monthly cash flow is $-202 ($-2k/yr) — negative.
- To cash-flow at today's rent, offer at most $116k (20.2% below list).
- To meet the 1% rule (rent ≥ 1% of price), the offer needs to be $101k (30.2% below list).
- Recommended offer: $101k (30.2% below list) — sets the bar for 1% rule.
- Cap rate 4.6% vs local median 0.2% in Leakey — top-decile yield for the area; either an underpriced asset or a hidden risk that comps aren't pricing in. Stress-test before assuming the spread holds.
Location & tenants
- Location reads 53/100 on livability (#1,432 in TX) — a working-class tenant base; expect higher turnover. Strengths: cost of living A+; Watch: housing C-, schools F, crime D-.
- Leakey ISD (rural): math 35% / reading 50% proficiency, ranked #673 of 1,141 in TX (top 59%) — families likely to look elsewhere, expect single-tenant / working-renter base with shorter leases.
- Market conditions: 94 active listings in the ZIP.
Forward outlook
- In year one you build about $5k of equity ($1k loan paydown + $4k appreciation (3.0% local appreciation)).
- Real County population projected at -10% by 2050 — secular population decline; favor cash flow + early exit over multi-decade hold.
- By year 7, paydown + projected appreciation supports a ~$34k cash-out refi (75% LTV) — recoverable capital for the next deal without selling this one.
Negotiation context
- It's been on market 168 days — a 12% lower offer ($128k) is reasonable based on typical stale-listing flexibility.
- 3 sale attempts since 2y ago with the ask held roughly flat each time — persistent listings suggest the price (not the market) is what's stuck; bring a comps-based counter.
Questions for the listing agent
- What do current leases actually rent for vs. the listed asking? Can we see a recent rent roll and the last 12 months of T-12 income?
- It's been on market 168 days. Have you received any prior offers? Is the seller open to a 30% concession, seller financing, or rate buy-down credit?
- Why hasn't it sold? Are there any deal-killer items the seller is aware of (foundation, flood, title, zoning, code violations)?
- Is there a deadline driving the sale (1031 exchange, divorce, estate, relocation)? That informs how much negotiation room exists.
- Schools are F-rated, which usually means shorter tenancies and higher turnover. Who's the typical renter profile here, and what's been the actual vacancy rate?
- Crime grade is D in this area — have there been break-ins, vandalism, or insurance claims at this property in the last 3 years? What carrier currently insures it and at what premium?
- The area grade is low — what's the realistic commute time and amenity access for the typical tenant pool here? Any planned neighborhood developments (good or bad) we should know about?
- What's the average days-on-market for RENTAL listings here right now (not sales)? A rising rental-DOM trend means longer vacancies and softer asking-rent achievability than the comps imply.
- What's the recent tenant-quality profile in this submarket — average credit score on applications, eviction rate, late-payment / NSF rate, and stable-employment percentage? A property-management company in the area should have these aggregated.
- How much new for-sale + rental construction is in the pipeline within 1–3 miles? Heavy new supply typically softens prices + rents 12–24 months out; constrained supply supports both.
Investment metrics
- 1% rule
- 0.70% ✗
- Cap rate
- 4.62%
- Cash-on-cash
- -5.97%
- DSCR
- 0.73
- GRM
- 11.9
CMA / ARV
- ARV (median comp)
- $335,500
- List price
- $145,000
- Delta
- -56.78%
- Verdict
- UNDERPRICED
- Comps
- 10 within 1.0 mi
Show comp detail 2 sales within ~0.75 mi
| Address | Dist | Beds/Ba | Sqft | Sold | Price | $/sf | Match |
|---|---|---|---|---|---|---|---|
| 151 Mountain St | 0.17mi | 3/1.0 (+1) | 1,140 (-5%) | 11mo | $230,000 | $202 | 70 |
| 62 Timbers Ln | 0.58mi | 3/2.0 (+1) | 1,225 (+2%) | 2mo | $252,000 | $206 | 59 |
Match score weights: distance 35% · size 25% · config 20% · recency 20%. Top-matched comps best support the ARV.
Projected returns pro-forma
3.02% appreciation · 3.0% rent growth · sell at horizon
- IRR
- 2.0%
- Equity multiple
- 1.12×
- Total profit
- $4,770
- Equity at exit
- $65,371
- IRR
- 5.6%
- Equity multiple
- 1.86×
- Total profit
- $34,868
- Equity at exit
- $100,880
Cash invested: $40,600 (down + closing). Projections, not guarantees.
Landlord ↔ Tenant lean methodology
- Overall (STATE)
- 87 Strongly Landlord-Friendly
- State Texas
- 87 Strongly Landlord-Friendly · R+5
- County
- — inherits STATE
- City
- — inherits STATE
ZIP-level market 78873
- Home prices YoY
- 2.1%
- Active inventory
- 94
- Price-to-rent
- 11.9×
Monthly cashflow live
- Estimated rent
- $1,013 medium interval (Pro) →
- Mortgage (P&I)
- −$760
- Tax est. 1.5%
- −$181 /mo · $2,175/yr
- Insurance
- −$60
- HOA
- −$0
- Vacancy / Maint / Mgmt
- −$213
- Net cashflow
- $-202
Break-even live
Sensitivity live
| Price | -10% $-102 | -5% $-152 | +0% $-202 | +5% $-252 | +10% $-302 |
|---|---|---|---|---|---|
| Rent | -10% $-282 | -5% $-242 | +0% $-202 | +5% $-162 | +10% $-122 |
| Rate | -1.0pp $-129 | -0.5pp $-165 | base $-202 | +0.5pp $-240 | +1.0pp $-278 |
UW: 25.0% down · 7.5% · 30yr · 1.5% tax · 5.0% vac · 8.0% maint · 8.0% mgmt
Financing live
Cash to close
- Down payment
- $36,250
- Closing costs
- $4,350
- Reserves months
- —
- Total cash needed
- —
Loan-product check · same deal, 3 products live
Conventional
25% down · 7.5% · 30yr
- Down + closing
- —
- Monthly P&I
- —
- Monthly cashflow
- —
- DSCR
- —
- Eligible?
- —
Personal DTI + credit; lowest rate.
DSCR
20% down · 8.5% · 30yr
- Down + closing
- —
- Monthly P&I
- —
- Monthly cashflow
- —
- DSCR
- —
- Eligible?
- —
No personal income docs; deal must DSCR.
Hard money
10% down · 12.0% · 12mo
- Down + closing
- —
- Monthly P&I
- —
- Monthly cashflow
- —
- DSCR
- —
- Eligible?
- —
Short-term bridge; refi at stabilization.
Listing history 23 events
-
2026-06-22days on market $145,000 Active 168 DOM
-
2026-06-21days on market $145,000 Active 167 DOM
-
2026-06-21days on market $145,000 Active 166 DOM
-
2026-06-18days on market $145,000 Active 164 DOM
-
2026-06-17days on market $145,000 Active 163 DOM
-
2026-06-16days on market $145,000 Active 162 DOM
-
2026-06-15days on market $145,000 Active 161 DOM
-
2026-06-13days on market $145,000 Active 159 DOM
-
2026-06-12days on market $145,000 Active 158 DOM
-
2026-06-10days on market $145,000 Active 155 DOM
-
2026-06-08days on market $145,000 Active 154 DOM
-
2026-06-08days on market $145,000 Active 153 DOM
-
2026-06-07days on market $145,000 Active 152 DOM
-
2026-06-03days on market $145,000 Active 149 DOM
-
2026-06-02days on market $145,000 Active 148 DOM
-
2026-06-01days on market $145,000 Active 147 DOM
-
2026-05-31days on market $145,000 Active 146 DOM
-
2026-01-05$145,000 New 515-char remark
Show marketing remark (515 chars)
Quintessential elements abounding throughout this historic 1900's home located on .3 of acre lot TBS in Leakey Texas. Sears & Roebuck catalog home with some TLC can make someone a forever home. Large pecan tree in the back yard with all city utilities available. The home consists of 2 bedrooms 1bath and approximately 1200 sq ft. Fireplace, large front porch and some other features make this home feel cozy, warm and with the right touches of preserving some history, this home could be in a historic
-
2025-10-29historical
-
2025-05-19status Back on Market
-
2025-04-29historical
-
2025-02-06price $145,000
-
2024-10-29$150,000 New
ⓘ Source: listings_history table (triggers on properties + properties_extension) + one-shot
backfill from property_details.listing_events for pre-trigger history.
Nearby sold comps map
Loading sold comps map…
Walkable amenities ~0.75 mi
Loading nearby amenities…
Taxation est. · year 1
- Rental income
- $12,151
- − Mortgage interest
- −$8,122
- − Property taxes
- −$2,175
- − Insurance
- −$725
- − Repairs & maintenance
- −$972
- − Management
- −$972
- − Depreciation
- −$4,218
- Taxable loss
- −$5,034
- Est. tax savings @ 24.0%
- +$1,208
- After-tax cash flow
- $-1,218/yr
For passive investors: Depreciation is non-cash, so a rental often shows a tax loss while cash-flowing — sheltering income. Rental losses are passive: they offset passive income freely, and up to $25,000/yr can offset ordinary (W-2) income if you actively participate and your MAGI is under $100k (phasing out to $0 by $150k); unused losses carry forward. On sale, claimed depreciation is recaptured at up to 25%, and gains may owe capital-gains tax (a 1031 exchange can defer both). Figures are a year-1 estimate at your 24.0% rate — not tax advice; consult a CPA.
Schools (NCES district)
- District
- Leakey ISD
- NCES district ID
- 4827000
- Math proficiency
- 35% ▬ 0.00%
- Reading proficiency
- 50% ▲ 15.00%
- Median HH income
- $36,418
- Composite
- 37.57/100
- National rank
- #8855
- State rank
- #673 of 1141 in TX
Livability — Leakey
- Score
- 53/100
- State rank
- #1432
- US rank
- #24474
Category grades
Schools grade is shown separately in the Schools card above.
Census & demographics
- Census place
- Leakey, TX
- Population (ZIP)
- 1,498
Population outlook (Real County) Hauer SSP2
- Today (2025)
- 3,289 people
- By 2030
- 3,225 · -1.9%
- By 2040
- 3,093 · -6.0%
- By 2050
- 2,948 · -10.4%
- By 2075
- 2,678 · -18.6%
- By 2100
- 2,196 · -33.2%
Race, ethnicity, and origin ACS 2023
- Neighborhood character
- Predominantly White (82%)
- Race & ethnicity
- White 82% Hispanic / Latino 16% Black 2% Two or more races 1%
- Hispanic origin (detail)
- Mexican 15%
- Common ancestry
- Serbian 4% Romanian 4% Slovak 3%
- Foreign-born
- 4% · Canada
- Languages at home
- 92% English-only · Spanish 8%
Political lean MEDSL · Real
- 2024 margin
- Solid R (+66.9) · D 16.1% · R 83.0%
- 2008→2024 swing
- -13.9pp toward R · 2008: -53.0pp · 2024: -66.9pp
- All cycles
- 2024: R+66.9 2020: R+66.8 2016: R+66.8 2012: R+62.6 2008: R+53.0
Not yet ingested
- Civics
- —
Market trends
- HPI YoY
- ▲ 3.02%
- Current HPI
- 149.7889
- Rent YoY
- —
- Metro
- —
- State GDP YoY
- ▲ 3.95%
- F500 in state
- 110
Industry mix (Fortune 500 HQ in TX)
| Industry | F500 HQs | Revenue |
|---|---|---|
| Energy | 16 | $1,198B |
|
||
| Technology | 5 | $198B |
|
||
| Engineering / Construction | 4 | $72B |
|
||
| Energy Services | 3 | $60B |
|
||
| Utilities | 3 | $41B |
|
||
| Healthcare | 2 | $330B |
|
||
Price history
-3.3% since first listed6 events — show timeline
- 2026-01-05 Listed $145,000 LERA
- 2025-10-29 Listing Removed — LERA
- 2025-05-19 Relisted — LERA
- 2025-04-29 Listing Removed — LERA
- 2025-02-06 Price Changed $145,000 LERA
- 2024-10-29 Listed $150,000 LERA
Cash-flow waterfall
monthlySold comps — $/sqft
last 12 mo · ≤1 miLoading sold comps…