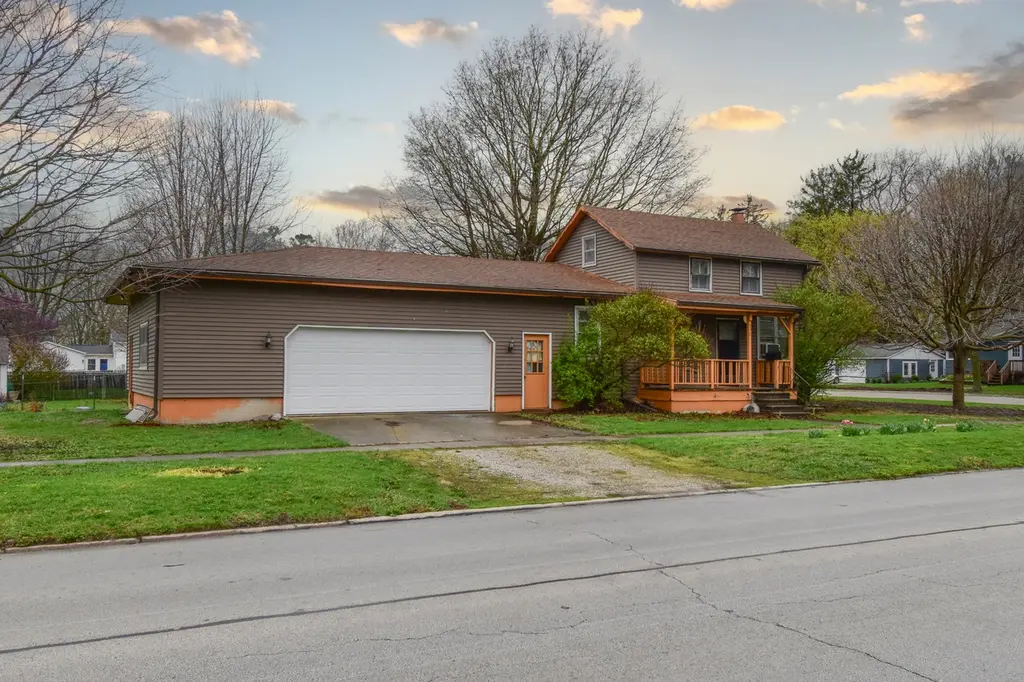
310 N 1st St · Fairbury, IL
Flood risk 1/10 · Minimal
- FEMA flood zone
- X (unshaded)
- Chance of flooding over 30 yrs
- 0.0%
- Est. flood insurance / yr
- $507 – $1,088
Fire risk 2/10 · Minimal
- Est. fire insurance / yr
- $804 – $1,492
Heat risk 3/10 · Minor
- Hot days now (above 104°F)
- 7 days/yr
- Hot days in 30 yrs
- 17 days/yr
Wind risk 2/10 · Minimal
- Chance of severe wind over 30 yrs
- 1.0%
Air-quality risk 2/10 · Minimal
- Unhealthy air days now
- 1 days/yr
- Unhealthy air days in 30 yrs
- 1 days/yr
Risk factors via First Street. Map © Google.
Why this score? — see what drove the C grade
The composite is a weighted blend of 9 inputs, each scored 0–100. Each bar is that input's sub-score; the figure is the points it added to the 100-point composite (weight × sub-score).
- Cash flow +18.3/30.0
- ARV discount +15.0/15.0
- 1% rule +6.1/10.0
- DSCR +5.7/10.0
- Livability +3.8/5.0
- Schools +2.8/10.0
- Rent growth +2.5/5.0
- Condition / age +2.5/5.0
- Appreciation +2.1/10.0
$85,000
🖨 Deal sheet 📄 Offer letter ✓ Due diligence
Listing remarks MLS
Investor alert at a great price. This corner lot residence is going to make a nice rebuild or flip home. Inside you'll find a bedroom and bath on the first floor and a bedroom with a bonus room upstairs. Beautiful brick custom fireplace in the living room. Galley style kitchen and large dining room area. Appliances stay with the home. The home has a newer roof and siding along with a newer furnace and updated wiring. You'll also love the large 27 x 34 garage attached with plenty of room for cars, a golf cart and entertainment. This home is sitting on a double corner lot. Also included is a 10 x 16 steel garden shed. Home is being sold as is.
Key facts
- Large dining room
- Newer furnace
- Newer roof
Tags
Neighborhood map
What this means for you Summary
Snapshot
- This is a 1-bed/1.0-bath single-family listed at $85k.
Deal economics
- At list price, monthly cash flow is $78 ($932/yr) — positive.
- The deal already cash-flows at list — no discount required.
- Meets the 1% rule at list price ($945 rent vs $85k).
- Recommended offer: $80k (6.0% below list) — sets the bar for market timing.
Location & tenants
- Location reads 76/100 on livability (#176 in IL, #3,357 nationally) — a middle-class / working-renter tenant base. Strengths: crime A+, cost of living A+, housing A+; Watch: schools D+, amenities F, commute F.
- Prairie Central CUSD 8 (rural): math 32% / reading 32% proficiency, ranked #223 of 620 in IL (top 36%) — families likely to look elsewhere, expect single-tenant / working-renter base with shorter leases.
- Market conditions: 17 active listings in the ZIP; 35 units permitted in Livingston County in 2024 (0 in 5+ unit buildings).
Forward outlook
- Local home prices are declining (-3.0%/yr); year-one equity from $588 of loan paydown is wiped out by about $3k of value loss. Plan a longer hold.
- Livingston County population projected at -27% by 2050 — secular population decline; favor cash flow + early exit over multi-decade hold.
Negotiation context
- It's been on market 75 days — a 6% lower offer ($80k) is reasonable based on typical stale-listing flexibility.
- 2 sale attempts since 22y ago; this cycle's ask has dropped $25k (23%) from the opening price — seller is motivated, your offer sets the floor, not the list.
- Current owner paid $26k; list at $85k implies a 227% gain — meaningful room to come down on a strong offer.
Risks & watch-outs
- Watch-outs: property tax is 2.6% of price; built in 1890 — expect roof / HVAC / electrical / plumbing capex.
Questions for the listing agent
- It's been on market 75 days. Have you received any prior offers? Is the seller open to a 6% concession, seller financing, or rate buy-down credit?
- Built in 1890 — when were the roof, HVAC, electrical panel, plumbing, and water heater last replaced?
- Property tax is high relative to price — has the assessment been appealed recently, and will the sale trigger a re-assessment?
- Why hasn't it sold? Are there any deal-killer items the seller is aware of (foundation, flood, title, zoning, code violations)?
- Is there a deadline driving the sale (1031 exchange, divorce, estate, relocation)? That informs how much negotiation room exists.
- Schools are D-rated, which usually means shorter tenancies and higher turnover. Who's the typical renter profile here, and what's been the actual vacancy rate?
- What's the average days-on-market for RENTAL listings here right now (not sales)? A rising rental-DOM trend means longer vacancies and softer asking-rent achievability than the comps imply.
- What's the recent tenant-quality profile in this submarket — average credit score on applications, eviction rate, late-payment / NSF rate, and stable-employment percentage? A property-management company in the area should have these aggregated.
- How much new for-sale + rental construction is in the pipeline within 1–3 miles? Heavy new supply typically softens prices + rents 12–24 months out; constrained supply supports both.
Investment metrics
- 1% rule
- 1.11% ✓
- Cap rate
- 7.39%
- Cash-on-cash
- 3.92%
- DSCR
- 1.17
- GRM
- 7.5
CMA / ARV
- ARV (median comp)
- $128,009
- List price
- $85,000
- Delta
- -33.60%
- Verdict
- UNDERPRICED
- Comps
- 20 within 1.0 mi
Show comp detail 3 sales within ~0.75 mi
| Address | Dist | Beds/Ba | Sqft | Sold | Price | $/sf | Match |
|---|---|---|---|---|---|---|---|
| 401 W Walnut St | 0.30mi | 2/1.0 (+1) | 1,024 (-6%) | 6mo | $38,000 | $37 | 66 |
| 205 E Hickory St | 0.29mi | 2/1.0 (+1) | 1,152 (+6%) | 12mo | $92,600 | $80 | 61 |
| 505 E Locust St | 0.59mi | 2/1.0 (+1) | 1,200 (+10%) | 14mo | $144,000 | $120 | 39 |
Match score weights: distance 35% · size 25% · config 20% · recency 20%. Top-matched comps best support the ARV.
Projected returns pro-forma
-3.0% appreciation · 3.0% rent growth · sell at horizon
- IRR
- -10.1%
- Equity multiple
- 0.63×
- Total profit
- $-8,763
- Equity at exit
- $12,674
- IRR
- -0.6%
- Equity multiple
- 0.96×
- Total profit
- $-1,000
- Equity at exit
- $7,349
Cash invested: $23,800 (down + closing). Projections, not guarantees.
Landlord ↔ Tenant lean methodology
- Overall (STATE)
- 43 Moderately Tenant-Leaning
- State Illinois
- 43 Moderately Tenant-Leaning · D+7
- County
- — inherits STATE
- City
- — inherits STATE
ZIP-level market 61739
- Home prices YoY
- -2.3%
- Active inventory
- 17
- Price-to-rent
- 7.5×
Monthly cashflow live
- Estimated rent
- $945 medium interval (Pro) →
- Mortgage (P&I)
- −$446
- Tax from tax record
- −$188 /mo · $2,251/yr
- Insurance
- −$35
- HOA
- −$0
- Vacancy / Maint / Mgmt
- −$198
- Net cashflow
- $78
Break-even live
UW: 25.0% down · 7.5% · 30yr · 1.5% tax · 5.0% vac · 8.0% maint · 8.0% mgmt
Financing live
Cash to close
- Down payment
- $21,250
- Closing costs
- $2,550
- Reserves months
- —
- Total cash needed
- —
Loan-product check · same deal, 3 products live
Conventional
25% down · 7.5% · 30yr
- Down + closing
- —
- Monthly P&I
- —
- Monthly cashflow
- —
- DSCR
- —
- Eligible?
- —
Personal DTI + credit; lowest rate.
DSCR
20% down · 8.5% · 30yr
- Down + closing
- —
- Monthly P&I
- —
- Monthly cashflow
- —
- DSCR
- —
- Eligible?
- —
No personal income docs; deal must DSCR.
Hard money
10% down · 12.0% · 12mo
- Down + closing
- —
- Monthly P&I
- —
- Monthly cashflow
- —
- DSCR
- —
- Eligible?
- —
Short-term bridge; refi at stabilization.
Listing history 20 events
-
2026-06-18days on market $85,000 Active 75 DOM
-
2026-06-17days on market $85,000 Active 74 DOM
-
2026-06-16days on market $85,000 Active 73 DOM
-
2026-06-15days on market $85,000 Active 72 DOM
-
2026-06-13days on market $85,000 Active 70 DOM
-
2026-06-12days on market $85,000 Active 69 DOM
-
2026-06-09days on market $85,000 Active 66 DOM
-
2026-06-08days on market $85,000 Active 65 DOM
-
2026-06-07days on market $85,000 Active 64 DOM
-
2026-06-05days on market $85,000 Active 62 DOM
-
2026-06-04days on market $85,000 Active 60 DOM
-
2026-06-02days on market $85,000 Active 59 DOM
-
2026-06-01days on market $85,000 Active 58 DOM
-
2026-05-31days on market $85,000 Active 57 DOM
-
2026-05-31days on market $85,000 Active 56 DOM
-
2026-04-24price $99,900 658-char remark
Show marketing remark (658 chars)
Investor alert at a great price. This corner lot residence is going to make a nice rebuild or flip home. Inside you'll find a bedroom and bath on the first floor and a bedroom with a bonus room upstairs. Beautiful brick custom fireplace in the living room. Galley style kitchen and large dining room area. Appliances stay with the home. The home has a newer roof and siding along with a newer furnace and updated wiring. You'll also love the large 27 x 34 garage attached with plenty of room for cars, a golf cart and entertainment. This home is sitting on a double corner lot. Also included is a 10 x 16 steel garden shed. Home is being sold as is.
-
2026-04-03$110,000 Active 658-char remark
Show marketing remark (658 chars)
Investor alert at a great price. This corner lot residence is going to make a nice rebuild or flip home. Inside you'll find a bedroom and bath on the first floor and a bedroom with a bonus room upstairs. Beautiful brick custom fireplace in the living room. Galley style kitchen and large dining room area. Appliances stay with the home. The home has a newer roof and siding along with a newer furnace and updated wiring. You'll also love the large 27 x 34 garage attached with plenty of room for cars, a golf cart and entertainment. This home is sitting on a double corner lot. Also included is a 10 x 16 steel garden shed. Home is being sold as is.
-
2004-12-09soldstatus $26,000
-
2004-10-30historical
-
2004-06-01
ⓘ Source: listings_history table (triggers on properties + properties_extension) + one-shot
backfill from property_details.listing_events for pre-trigger history.
Tax reassessment forecast IL · Partial reset (capped growth)
- Current annual tax
- $2,251 · $188/mo
- Projected year-2 tax
- $2,251 · $188/mo
- Expected delta
- $0/yr ($0/mo · 0.0%)
ⓘ Screening estimate from a state-policy table — verify with the county assessor before closing.
Climate risk First Street
- Flood 1/10 Low FEMA zone X (unshaded) · 0% chance over 30 yrs
- Wildfire 2/10 Low
- Heat 3/10 Moderate 7 d/yr ≥104°F today · 17 d/yr by 30 yrs out
- Wind 2/10 Low 100% chance of damaging wind over 30 yrs
- Air quality 2/10 Low 1 unhealthy d/yr today · 1 by 30 yrs out
Nearby sold comps map
Loading sold comps map…
Walkable amenities ~0.75 mi
Loading nearby amenities…
Taxation est. · year 1
- Rental income
- $11,338
- − Mortgage interest
- −$4,761
- − Property taxes
- −$2,251
- − Insurance
- −$425
- − Repairs & maintenance
- −$907
- − Management
- −$907
- − Depreciation
- −$2,473
- Taxable loss
- −$386
- Est. tax savings @ 24.0%
- +$93
- After-tax cash flow
- $1,025/yr
For passive investors: Depreciation is non-cash, so a rental often shows a tax loss while cash-flowing — sheltering income. Rental losses are passive: they offset passive income freely, and up to $25,000/yr can offset ordinary (W-2) income if you actively participate and your MAGI is under $100k (phasing out to $0 by $150k); unused losses carry forward. On sale, claimed depreciation is recaptured at up to 25%, and gains may owe capital-gains tax (a 1031 exchange can defer both). Figures are a year-1 estimate at your 24.0% rate — not tax advice; consult a CPA.
Schools (NCES district)
- District
- Prairie Central CUSD 8
- NCES district ID
- 1700005
- Math proficiency
- 32% ▼ -6.00%
- Reading proficiency
- 32% ▼ -16.00%
- Median HH income
- $52,909
- Composite
- 28.15/100
- National rank
- #6814
- State rank
- #223 of 620 in IL
Livability — Fairbury
- Score
- 76/100
- State rank
- #176
- US rank
- #3357
Category grades
Schools grade is shown separately in the Schools card above.
Census & demographics
- Census place
- Fairbury, IL
- Population (ZIP)
- 4,673
Population outlook (Livingston County) Hauer SSP2
- Today (2025)
- 32,749 people
- By 2030
- 30,848 · -5.8%
- By 2040
- 27,357 · -16.5%
- By 2050
- 24,048 · -26.6%
- By 2075
- 17,574 · -46.3%
- By 2100
- 12,096 · -63.1%
Race, ethnicity, and origin ACS 2023
- Neighborhood character
- Predominantly White (94%)
- Race & ethnicity
- White 94% Hispanic / Latino 3% Two or more races 2% Black 1%
- Common ancestry
- Romanian 2% Iranian 2% German 1%
- Foreign-born
- 1% · Canada
Political lean MEDSL · Livingston
- 2024 margin
- Solid R (+46.3) · D 26.1% · R 72.4% · Other 1.6%
- 2008→2024 swing
- -27.1pp toward R · 2008: -19.2pp · 2024: -46.3pp
- All cycles
- 2024: R+46.3 2020: R+44.2 2016: R+41.0 2012: R+31.5 2008: R+19.2
Not yet ingested
- Civics
- —
Market trends
- HPI YoY
- ▼ -5.83%
- Current HPI
- 251.2057
- Rent YoY
- —
- Metro
- —
- State GDP YoY
- ▲ 1.59%
- F500 in state
- 60
Industry mix (Fortune 500 HQ in IL)
| Industry | F500 HQs | Revenue |
|---|---|---|
| Insurance | 4 | $201B |
|
||
| Consumer Goods | 4 | $87B |
|
||
| Industrial Machinery | 3 | $64B |
|
||
| Healthcare | 2 | $55B |
|
||
| Retail / Pharmacy | 1 | $148B |
|
||
| Agriculture / Food | 1 | $86B |
|
||
Price history
+284.2% since first listed5 events — show timeline
- 2026-04-24 Price Changed $99,900 MRED as Distributed by MLS Grid
- 2026-04-03 Listed $110,000 MRED as Distributed by MLS Grid
- 2004-12-09 Sold (Public Records) $26,000 Public Records
- 2004-10-30 Listing Removed — MRED as Distributed by MLS Grid
- 2004-06-01 Listed — MRED as Distributed by MLS Grid
Property tax history
+11.4%/yrLatest (2024): $2,251 · +7.9% YoY. Source: county tax records.
Cash-flow waterfall
monthlySold comps — $/sqft
last 12 mo · ≤1 miLoading sold comps…