900 Golden Wheel Park Dr #10 · San Jose, CA
Flood risk 9/10 · Severe
- FEMA flood zone
- AO
- Chance of flooding over 30 yrs
- 0.99%
- Est. flood insurance / yr
- $848 – $2,087
Fire risk 1/10 · Minimal
- Est. fire insurance / yr
- $659 – $1,223
Heat risk 5/10 · Moderate
- Hot days now (above 93°F)
- 7 days/yr
- Hot days in 30 yrs
- 14 days/yr
Wind risk 1/10 · Minimal
- Chance of severe wind over 30 yrs
- —
Air-quality risk 8/10 · Major
- Unhealthy air days now
- 14 days/yr
- Unhealthy air days in 30 yrs
- 16 days/yr
Risk factors via First Street. Map © Google.
Why this score? — see what drove the D+ grade
The composite is a weighted blend of 9 inputs, each scored 0–100. Each bar is that input's sub-score; the figure is the points it added to the 100-point composite (weight × sub-score).
- Cash flow +19.5/30.0
- DSCR +6.2/10.0
- Schools +5.5/10.0
- 1% rule +5.2/10.0
- Condition / age +4.0/5.0
- Livability +3.9/5.0
- Rent growth +3.6/5.0
- ARV discount +0.0/15.0
- Appreciation +0.0/10.0
$385,950
🖨 Deal sheet (PDF) 📄 Offer letter ✓ Due diligence
Listing remarks
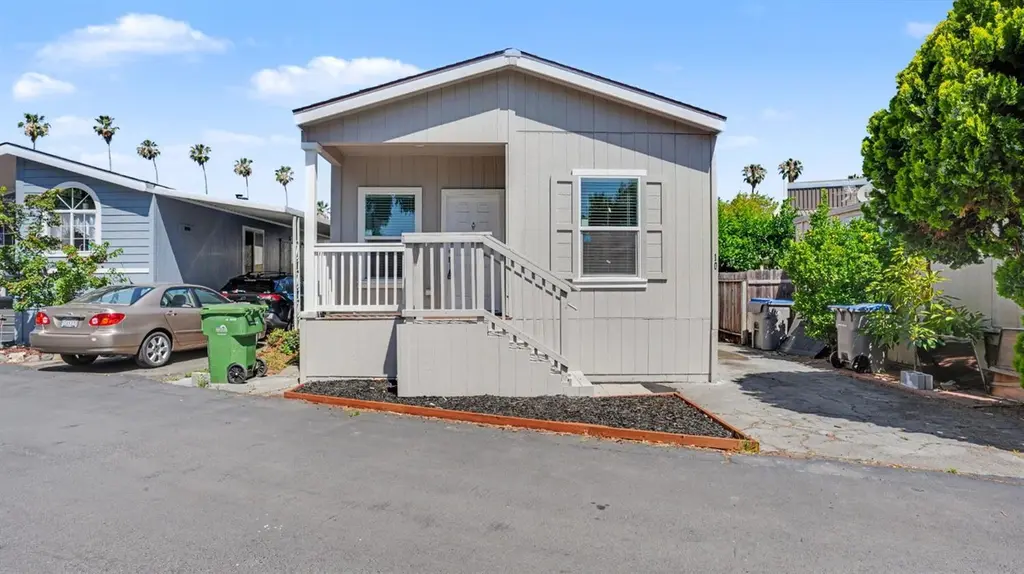
Welcome to Golden Wheel Mobile Home Community! This brand-new Clayton FairPoint double-wide offers modern design and functional living in a convenient San Jose location. Featuring 3 bedrooms and 2 bathrooms, this move-in-ready home offers a bright open-concept floor plan with seamless flow between the living room, dining area, and kitchen. The spacious kitchen features a large center island with farmhouse sink, stainless steel appliances, ample cabinetry, and solid-surface countertops. Additional features include recessed lighting, dual-pane windows, contemporary finishes, a dedicated indoor laundry room, and a spacious primary suite with an ensuite bathroom and generous closet space. Two a
Key facts
- Large center island
- Ample cabinetry
- Modern design
Tags
Property features AI
Finance
- Other: Located in Golden Wheel Mobile Home Community; Address: 900 Golden Wheel Park Dr #10, San Jose, CA 95112; Cross street: Oakland Rd.; Directions: From US-101, exit Oakland Road and head north. Turn right onto Golden Wheel Park Drive and enter Golden Wheel Mobile Home Community. Continue through the community to the subject property.
- Financial info: Land lease: No (listed land lease amount present in source but excluded per instructions)
- HOA & community: No homeowners association; Not a senior community
Exterior
- Parking: Assigned parking
- Utilities: Public water; Public sewer; Electric service: Other; Utilities: See remarks/other
- Home design: Manufactured in park (double wide); Clayton make; CMH Manufacturing West, Inc. manufacturer; Wood skirting; Built in 2025
- Construction: Composition roof; Wood skirting; Manufactured construction (double wide)
- Exterior features: Composition roof
Interior
- Kitchen: Free standing gas range; Free standing gas oven; Free standing refrigerator; Dishwasher; Microwave
- Bedrooms: 3 bedrooms
- Flooring: Carpet; Linoleum
- Bathrooms: 2 full bathrooms; Shower stall(s)
- Heating & cooling: Central heating; Ceiling fans
- Interior features: Stone kitchen counters; Living room with unspecified/other feature; Dining area space in the kitchen; Pets allowed (with number and size limits)
- Laundry & utility: Laundry inside (laundry room)
Neighborhood map
What this means for you Summary
Snapshot
- This is a 3-bed/2.0-bath manufactured listed at $386k. Condition is rated good.
Deal economics
- At list price, monthly cash flow is $318 ($4k/yr) — positive.
- The deal already cash-flows at list — no discount required.
- Meets the 1% rule at list price ($4k rent vs $386k).
- Recommended offer: $380k (1.5% below list) — sets the bar for market timing.
- Cap rate 7.7% vs local median 1.6% in San Jose — top-decile yield for the area; either an underpriced asset or a hidden risk that comps aren't pricing in. Stress-test before assuming the spread holds.
Location & tenants
- Location reads 78/100 on livability (#68 in CA, #2,559 nationally) — a middle-class / working-renter tenant base. Strengths: amenities A+, commute A+, employment A+; Watch: crime F, cost of living F.
- Orchard Elementary (urban): math 51% / reading 60% proficiency, ranked #225 of 1,400 in CA (top 16%) — acceptable for families but not a draw, mixed tenant base, ~2y average lease.
- Market conditions: Rents rising fast (+4.2%/yr); 106 active listings in the ZIP; 14 comparable units currently listed for rent nearby; rentals leasing fast (median 3d on market — plan ~1-2 weeks tenant-placement turnaround); solid renter incomes; 3,838 units permitted in Santa Clara County in 2024 (1,886 in 5+ unit buildings).
- At $3,934/mo this rent would consume 53% of the median local household income ($89k/yr) (locally 4364% of renters already pay >50% of income on rent) — very limited rent-growth headroom before tenants either downsize or default.
Forward outlook
- Local home prices are declining (-3.0%/yr); year-one equity from $3k of loan paydown is wiped out by about $12k of value loss. Plan a longer hold.
- Santa Clara County population projected at +24% by 2050 — long-run rental-demand tailwind backs the buy-and-hold thesis.
Negotiation context
- It's been on market 15 days — a 2% lower offer ($380k) is reasonable based on typical stale-listing flexibility.
Risks & watch-outs
- Watch-outs: flood insurance adds $122/mo.
- Climate carrying-cost: in FEMA flood zone AO (mandatory federal flood insurance); extreme-heat days projected 7→14/yr by 2055 (HVAC capex compounding) — expect insurance premiums to compound above CPI over the hold.
Questions for the listing agent
- What's the actual annual flood-insurance premium (NFIP or private), and is the property in a SFHA with mandatory coverage?
- Is there a deadline driving the sale (1031 exchange, divorce, estate, relocation)? That informs how much negotiation room exists.
- Crime grade is F in this area — have there been break-ins, vandalism, or insurance claims at this property in the last 3 years? What carrier currently insures it and at what premium?
- The area grade is low — what's the realistic commute time and amenity access for the typical tenant pool here? Any planned neighborhood developments (good or bad) we should know about?
- What's the average days-on-market for RENTAL listings here right now (not sales)? A rising rental-DOM trend means longer vacancies and softer asking-rent achievability than the comps imply.
- What's the recent tenant-quality profile in this submarket — average credit score on applications, eviction rate, late-payment / NSF rate, and stable-employment percentage? A property-management company in the area should have these aggregated.
- How much new for-sale + rental construction is in the pipeline within 1–3 miles? Heavy new supply typically softens prices + rents 12–24 months out; constrained supply supports both.
Investment metrics
- 1% rule
- 1.02% ✓
- Cap rate
- 7.66%
- Cash-on-cash
- 4.89%
- DSCR
- 1.22
- GRM
- 8.2
CMA / ARV
- ARV (on-the-fly)
- $296,765
- Comps found
- 8
Show comp detail 8 sales within ~0.75 mi
| Address | Dist | Beds/Ba | Sqft | Sold | Price | $/sf | Match |
|---|---|---|---|---|---|---|---|
| 900 Golden Wheel Park Dr Spc 5 | 0.09mi | 3/2.0 | 1,040 (+7%) | 4mo | $379,000 | $364 | 81 |
| 900 Golden Wheel Park Dr #28 | 0.13mi | 2/2.0 (-1) | 960 (-1%) | 8mo | $325,000 | $339 | 80 |
| 900 Golden Wheel Dr #18 | 0.09mi | 2/2.0 (-1) | 955 (-2%) | 11mo | $299,000 | $313 | 79 |
| 900 Golden Wheel Park Dr #66 | 0.13mi | 3/2.0 | 1,052 (+8%) | 4mo | $315,000 | $299 | 77 |
| 900 Golden Wheel Park Dr #9 | 0.09mi | 3/2.0 | 1,080 (+11%) | 9mo | $329,000 | $305 | 70 |
| 900 Golden Wheel Park Dr Spc 29 | 0.09mi | 3/2.0 | 1,100 (+13%) | 7mo | $300,000 | $273 | 69 |
| 1350 Oakland Rd #147 | 0.27mi | 3/2.0 | 880 (-10%) | 20mo | $265,000 | $301 | 55 |
| 1350 Oakland Rd #15 | 0.27mi | 3/2.0 | 1,062 (+9%) | 22mo | $317,000 | $298 | 54 |
Match score weights: distance 35% · size 25% · config 20% · recency 20%. Top-matched comps best support the ARV.
Projected returns pro-forma
-3.0% appreciation · 4.25% rent growth · sell at horizon
- IRR
- -9.3%
- Equity multiple
- 0.66×
- Total profit
- $-37,127
- Equity at exit
- $57,546
- IRR
- 1.9%
- Equity multiple
- 1.14×
- Total profit
- $15,402
- Equity at exit
- $33,370
Cash invested: $108,066 (down + closing). Projections, not guarantees.
Landlord ↔ Tenant lean methodology
- Overall (CITY)
- 0 Strongly Tenant-Friendly
- State California
- 18 Strongly Tenant-Friendly · D+13
- County
- — inherits STATE
- City San Jose
- 0 Strongly Tenant-Friendly · D+24
ZIP-level market 95112
- Rents YoY
- 4.2%
- Active inventory
- 106
- Price-to-rent
- 8.2×
Monthly cashflow live
- Estimated rent
- $3,934 high interval (Pro) →
- Mortgage (P&I)
- −$2,024
- Tax est. 1.5%
- −$482 /mo · $5,789/yr
- Insurance
- −$161
- Flood insurance flood zone
- −$122 /mo · $1,468/yr
- HOA
- −$0
- Vacancy / Maint / Mgmt
- −$826
- Net cashflow
- $318
Break-even live
Sensitivity live
| Price | -10% $585 | -5% $452 | +0% $318 | +5% $185 | +10% $52 |
|---|---|---|---|---|---|
| Rent | -10% $7 | -5% $163 | +0% $318 | +5% $474 | +10% $629 |
| Rate | -1.0pp $513 | -0.5pp $416 | base $318 | +0.5pp $218 | +1.0pp $116 |
UW: 25.0% down · 7.5% · 30yr · 1.5% tax · 5.0% vac · 8.0% maint · 8.0% mgmt
Financing live
Cash to close
- Down payment
- $96,488
- Closing costs
- $11,578
- Reserves months
- —
- Total cash needed
- —
Loan-product check · same deal, 3 products live
Conventional
25% down · 7.5% · 30yr
- Down + closing
- —
- Monthly P&I
- —
- Monthly cashflow
- —
- DSCR
- —
- Eligible?
- —
Personal DTI + credit; lowest rate.
DSCR
20% down · 8.5% · 30yr
- Down + closing
- —
- Monthly P&I
- —
- Monthly cashflow
- —
- DSCR
- —
- Eligible?
- —
No personal income docs; deal must DSCR.
Hard money
10% down · 12.0% · 12mo
- Down + closing
- —
- Monthly P&I
- —
- Monthly cashflow
- —
- DSCR
- —
- Eligible?
- —
Short-term bridge; refi at stabilization.
Rent comps 14 comps
| Address | Beds | Baths | Sqft | Rent | $/sqft | DOM | Units | Dist |
|---|---|---|---|---|---|---|---|---|
| 1323 Pebble Ct San Jose, CA | 2.0 | 2.0 | 1093 | $3,500 | $3.20 | 18d | 1 | 0.65mi |
| 1331 Lakeshore Cir San Jose, CA | 1.0–3.0 | 1.0–3.0 | 1017 | $4,767 | $4.69 | 2d | 28 | 0.66mi |
| 1625 Parkview Green Cir San Jose, CA | 2.0 | 1.0 | 940 | $3,295 | $3.51 | 2d | 1 | 0.67mi |
| 1542 Thornleaf Way San Jose, CA | 2.0 | 2.0 | 922 | $3,700 | $4.01 | 2d | 1 | 0.71mi |
| 1600 Whitewood Dr San Jose, CA | 1.0–2.0 | 1.0–2.0 | 977 | $3,806 | $3.89 | 2d | 12 | 0.81mi |
| 1501 Berryessa Rd San Jose, CA | 2.0 | 1.0–2.0 | 966 | $4,734 | $4.90 | 2d | 31 | 0.89mi |
| 1700 N 1st St San Jose, CA | 1.0–2.0 | 1.0–2.0 | 941 | $3,667 | $3.90 | 2d | 8 | 1.10mi |
| 1729 N 1st St San Jose, CA | 1.0–2.0 | 1.0–2.0 | 887 | $4,707 | $5.31 | 2d | 12 | 1.25mi |
| 750 N 23rd St San Jose, CA | 1.0–3.0 | 1.0 | 875 | $3,199 | $3.66 | 13d | 1 | 1.30mi |
| 817 N 10th St San Jose, CA | 2.0 | 1.0–2.0 | 851 | $3,749 | $4.40 | 2d | 10 | 1.30mi |
| 263 E Hedding St #1535 San Jose, CA | 1.0–4.0 | 1.0–3.5 | 1629 | $4,770 | $2.93 | 3d | 2 | 1.31mi |
| 756 N 11th St San Jose, CA | 2.0 | 1.0 | 800 | $2,695 | $3.37 | 44d | 1 | 1.36mi |
| 978 N 3rd St San Jose, CA | 2.0 | 1.0 | 1032 | $4,500 | $4.36 | 2d | 1 | 1.39mi |
| 415 E Taylor St San Jose, CA | 2.0 | 1.0–2.0 | 900 | $4,595 | $5.11 | 2d | 11 | 1.41mi |
Listing history 12 events
-
2026-06-19price $385,950 Active 15 DOM
-
2026-06-18days on market $395,950 Active 15 DOM
-
2026-06-17days on market $395,950 Active 14 DOM
-
2026-06-16days on market $395,950 Active 13 DOM
-
2026-06-15days on market $395,950 Active 12 DOM
-
2026-06-13days on market $395,950 Active 10 DOM
-
2026-06-13days on market $395,950 Active 9 DOM
-
2026-06-09days on market $395,950 Active 6 DOM
-
2026-06-08days on market $395,950 Active 5 DOM
-
2026-06-07days on market $395,950 Active 4 DOM
-
2026-06-05remarks 699-char remark
-
2026-06-05$395,950 Active 1 DOM
ⓘ Source: listings_history table (triggers on properties + properties_extension) + one-shot
backfill from property_details.listing_events for pre-trigger history.
Climate risk First Street
- Flood 9/10 Extreme FEMA zone AO · 99% chance over 30 yrs
- Wildfire 1/10 Low
- Heat 5/10 Major 7 d/yr ≥93°F today · 14 d/yr by 30 yrs out
- Wind 1/10 Low
- Air quality 8/10 Severe 14 unhealthy d/yr today · 16 by 30 yrs out
Nearby sold comps map
Loading sold comps map…
Walkable amenities ~0.75 mi
Loading nearby amenities…
Taxation est. · year 1
- Rental income
- $47,206
- − Mortgage interest
- −$21,619
- − Property taxes
- −$5,789
- − Insurance
- −$3,397
- − Repairs & maintenance
- −$3,777
- − Management
- −$3,777
- − Depreciation
- −$11,228
- Taxable loss
- −$2,380
- Est. tax savings @ 24.0%
- +$571
- After-tax cash flow
- $4,390/yr
For passive investors: Depreciation is non-cash, so a rental often shows a tax loss while cash-flowing — sheltering income. Rental losses are passive: they offset passive income freely, and up to $25,000/yr can offset ordinary (W-2) income if you actively participate and your MAGI is under $100k (phasing out to $0 by $150k); unused losses carry forward. On sale, claimed depreciation is recaptured at up to 25%, and gains may owe capital-gains tax (a 1031 exchange can defer both). Figures are a year-1 estimate at your 24.0% rate — not tax advice; consult a CPA.
Condition & rehab AI · 13 photos
This move-in-ready Clayton FairPoint double-wide mobile home is in good condition with modern design and functional living. It offers a bright open-concept floor plan and is located in a convenient San Jose location.
Value-add opportunities
- Both Paint the exterior siding and trim — Enhances curb appeal and value
- Both Replace the carpet with hardwood flooring in the bedrooms — Improves aesthetics and is easier to maintain
- Both Install new kitchen cabinets and countertops — Modernizes the kitchen and adds value
Renovation cost estimate screening
Value-add ROI direction
- Both Paint the exterior siding and trim — Enhances curb appeal and value ↑
- Both Replace the carpet with hardwood flooring in the bedrooms — Improves aesthetics and is easier to maintain ↑
- Both Install new kitchen cabinets and countertops — Modernizes the kitchen and adds value ↑
ⓘ Cost ranges are severity-bucket heuristics (US national rule-of-thumb). Get contractor quotes + a written scope before underwriting a rehab budget.
Schools (NCES district)
- District
- Orchard Elementary
- NCES district ID
- 0628680
- Math proficiency
- 51% ▲ 1.00%
- Reading proficiency
- 60% ▲ 5.00%
- Median HH income
- $108,165
- Composite
- 54.67/100
- National rank
- #2853
- State rank
- #225 of 1400 in CA
Livability — San Jose
- Score
- 78/100
- State rank
- #68
- US rank
- #2559
Category grades
Schools grade is shown separately in the Schools card above.
Census & demographics
- Census place
- San Jose, CA
- County
- Santa Clara County · 1,806,974 people
- City population
- 954,479
- Metro
- San Jose-Sunnyvale-Santa Clara, CA
- Population (ZIP)
- 57,373
- Household income
- $89,103
- Rent vs Own
- Severe rent burden
- 4364.0
Population outlook (Santa Clara County) Hauer SSP2
- Today (2025)
- 2,179,074 people
- By 2030
- 2,301,297 · +5.6%
- By 2040
- 2,528,195 · +16.0%
- By 2050
- 2,712,135 · +24.5%
- By 2075
- 2,998,701 · +37.6%
- By 2100
- 2,931,429 · +34.5%
Race, ethnicity, and origin ACS 2023
- Neighborhood character
- Highly diverse neighborhood (Simpson 0.71)
- Race & ethnicity
- Hispanic / Latino 41% Asian 27% White 22% Two or more races 18% Black 5% Native American 2%
- Hispanic origin (detail)
- Mexican 33%
- Common ancestry
- Slovak 1% Lithuanian 1% Scotch-Irish 1%
- Foreign-born
- 34% · Canada, Vietnam, China
- Languages at home
- 48% English-only · Spanish 29% Vietnamese 9% Chinese 6%
Political lean MEDSL · Santa Clara
- 2024 margin
- Solid D (+40.0) · D 68.1% · R 28.1% · Other 3.8%
- 2008→2024 swing
- -0.9pp no change · 2008: 40.9pp · 2024: 40.0pp
- All cycles
- 2024: D+40.0 2020: D+47.4 2016: D+52.5 2012: D+42.1 2008: D+40.9
Not yet ingested
- Civics
- —
Market trends
- HPI YoY
- ▼ -1025.61%
- Current HPI
- 297.1788
- Rent YoY
- ▲ 4.25%
- Metro
- San Jose-Sunnyvale-Santa Clara, CA
- State GDP YoY
- ▲ 3.21%
- F500 in state
- 116
Industry mix (Fortune 500 HQ in CA)
| Industry | F500 HQs | Revenue |
|---|---|---|
| Technology | 27 | $1,492B |
|
||
| Financial Services | 3 | $174B |
|
||
| Retail | 3 | $44B |
|
||
| Insurance | 3 | $26B |
|
||
| Media / Entertainment | 2 | $115B |
|
||
| Pharmaceuticals / Biotech | 2 | $62B |
|
||
Cash-flow waterfall
monthlySold comps — $/sqft
last 12 mo · ≤1 miLoading sold comps…