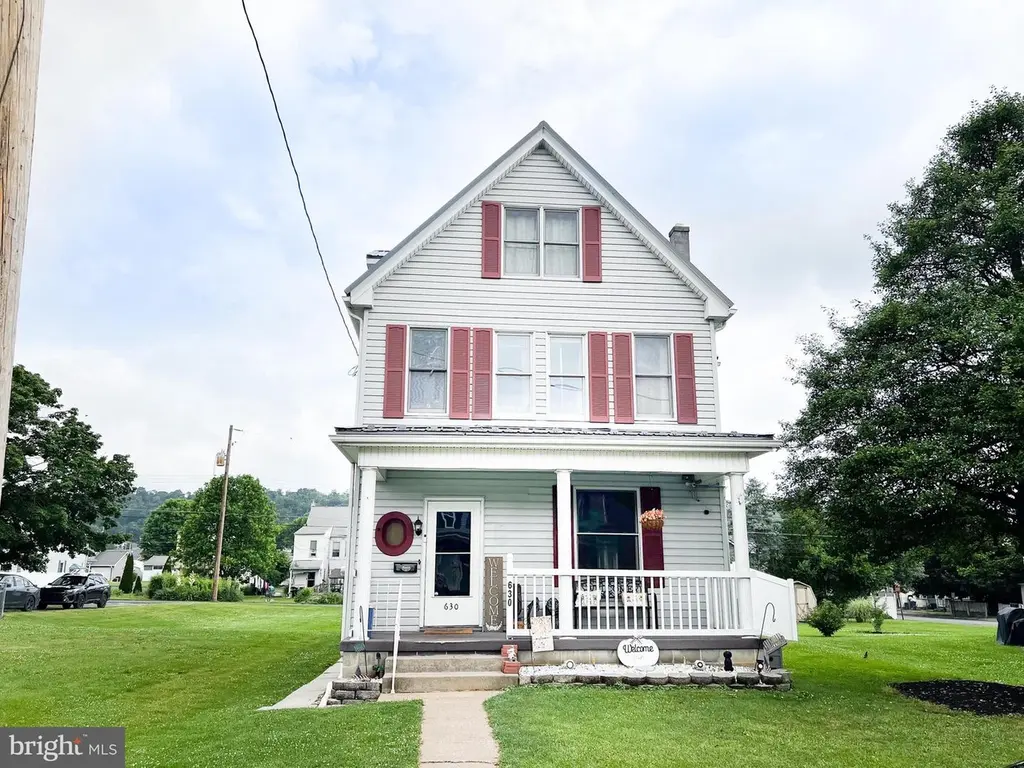
630 Highland Ave · Derry, PA
Flood risk 1/10 · Minimal
- FEMA flood zone
- X (unshaded)
- Chance of flooding over 30 yrs
- 0.0%
- Est. flood insurance / yr
- $473 – $860
Fire risk 3/10 · Minor
- Est. fire insurance / yr
- $511 – $949
Heat risk 4/10 · Minor
- Hot days now (above 98°F)
- 7 days/yr
- Hot days in 30 yrs
- 17 days/yr
Wind risk 2/10 · Minimal
- Chance of severe wind over 30 yrs
- 0.0%
Air-quality risk 2/10 · Minimal
- Unhealthy air days now
- 0 days/yr
- Unhealthy air days in 30 yrs
- 1 days/yr
Risk factors via First Street. Map © Google.
Why this score? — see what drove the D grade
The composite is a weighted blend of 9 inputs, each scored 0–100. Each bar is that input's sub-score; the figure is the points it added to the 100-point composite (weight × sub-score).
- Cash flow +15.9/30.0
- ARV discount +7.5/15.0
- DSCR +4.9/10.0
- 1% rule +3.7/10.0
- Livability +3.4/5.0
- Schools +3.2/10.0
- Rent growth +2.5/5.0
- Condition / age +2.5/5.0
- Appreciation +0.0/10.0
$230,000
🖨 Deal sheet (PDF) 📄 Offer letter ✓ Due diligence
Listing remarks MLS
Charming 2-story home with a convenient location to shops, restaurants, hospital, and easy access to Rte 322. Updated with newer vinyl siding and metal roof and efficient natural gas heat! Walk right in and feel at home in this 4 total bedroom, 1 and one-half bathroom home with 3 bedrooms on the second floor and one-bedroom in the 3rd floor that has a fantastic cathedral ceiling that could be used as a bonus room or more. Original woodwork throughout gives it an amazing character and charm to settle right in and feel at home. Relax and enjoy the sunroom with lots of windows and the added bonus of a fenced backyard and easy accessibility to the detached oversized 2-car garage with extra space for a workshop and more. Lovingly cared for and ready to move right in.
Key facts
- Remodeled kitchen
- Main floor laundry
- Vinyl privacy fence
Tags
Property features AI
Finance
- Other: Not in a federal flood zone; 2+ access exits (accessibility feature)
Exterior
- Parking: Detached garage (rear entry) with 2 spaces; Driveway parking; On-street parking
- Utilities: Public water; Public sewer; Electric service
- Home design: Detached property; Very good condition; Fee simple ownership
- Construction: Vinyl siding; Block foundation; Metal roof; Built (year source: assessor)
- Exterior features: Sidewalks; Enclosed patio/porch; Patio(s); Porch(es); Partial vinyl privacy fencing in rear
Interior
- Kitchen: Kitchen
- Bedrooms: Three bedrooms on the first upper level; One bedroom on the second upper level
- Flooring: Carpet; Luxury vinyl plank
- Bathrooms: One full bathroom on upper level; One half bathroom on main level
- Heating & cooling: Forced air heating; Electric baseboard heating; Natural gas and electric heating fuel; Natural gas hot water; Central air; Ductless/mini-split and central A/C
- Interior features: Traditional floor plan; Formal separate dining room; Drywall walls and ceilings; Daylight, fully finished basement
- Laundry & utility: Main-floor laundry
Neighborhood map
What this means for you Summary
Snapshot
- This is a 3-bed/1.5-bath other listed at $230k.
Deal economics
- At list price, monthly cash flow is $110 ($1k/yr) — positive.
- The deal already cash-flows at list — no discount required.
- To meet the 1% rule (rent ≥ 1% of price), the offer needs to be $200k (13.0% below list).
- Recommended offer: $200k (13.0% below list) — sets the bar for 1% rule.
- Cap rate 6.9% vs local median 3.4% in Derry — top-decile yield for the area; either an underpriced asset or a hidden risk that comps aren't pricing in. Stress-test before assuming the spread holds.
Location & tenants
- Location reads 67/100 on livability (#952 in PA) — a middle-class / working-renter tenant base. Strengths: crime A+, cost of living A+, housing A+; Watch: employment D+, amenities F, commute F.
- Mifflin County SD (town): math 28% / reading 49% proficiency, ranked #380 of 539 in PA (top 70%) — families likely to look elsewhere, expect single-tenant / working-renter base with shorter leases.
- Zoned schools: Lewistown El Sch (math 17% / reading 27%, grade F, #1,221 of 1,518 statewide, top 81%, 486 students, 100% FRL); Mifflin Co Ms (math 16% / reading 51%, grade F, #342 of 512 statewide, top 67%, 689 students, 59% FRL); Mifflin Co Hs (math 76% / reading 24%, grade D+, #133 of 437 statewide, top 30%, 1,086 students, 34% FRL) — zoned schools average 64% FRL vs 44% district-wide (21 pts higher); higher-poverty schools than district average — tighter screening recommended.
- Market conditions: 73 active listings in the ZIP; 1 comparable units currently listed for rent nearby; 58 units permitted in Mifflin County in 2024 (0 in 5+ unit buildings).
Forward outlook
- Local home prices are declining (-3.0%/yr); year-one equity from $2k of loan paydown is wiped out by about $7k of value loss. Plan a longer hold.
- Mifflin County population projected at -18% by 2050 — secular population decline; favor cash flow + early exit over multi-decade hold.
Negotiation context
- Only 10 days on market — expect competitive offers; lowballing is unlikely to land.
- 5 sale attempts since 9y ago with the ask held roughly flat each time — persistent listings suggest the price (not the market) is what's stuck; bring a comps-based counter.
- Current owner paid $141k; list at $230k implies a 63% gain — meaningful room to come down on a strong offer.
Risks & watch-outs
- Watch-outs: built in 1950 — expect roof / HVAC / electrical / plumbing capex.
Questions for the listing agent
- Built in 1950 — when were the roof, HVAC, electrical panel, plumbing, and water heater last replaced?
- Is there a deadline driving the sale (1031 exchange, divorce, estate, relocation)? That informs how much negotiation room exists.
- Schools are B-rated — typically a magnet for longer-tenancy family renters. What's the average tenant stay here, and is there a school-zone premium baked into asking?
- The area grade is low — what's the realistic commute time and amenity access for the typical tenant pool here? Any planned neighborhood developments (good or bad) we should know about?
- What's the average days-on-market for RENTAL listings here right now (not sales)? A rising rental-DOM trend means longer vacancies and softer asking-rent achievability than the comps imply.
- What's the recent tenant-quality profile in this submarket — average credit score on applications, eviction rate, late-payment / NSF rate, and stable-employment percentage? A property-management company in the area should have these aggregated.
- How much new for-sale + rental construction is in the pipeline within 1–3 miles? Heavy new supply typically softens prices + rents 12–24 months out; constrained supply supports both.
Investment metrics
- 1% rule
- 0.87% ✗
- Cap rate
- 6.87%
- Cash-on-cash
- 2.04%
- DSCR
- 1.09
- GRM
- 9.6
CMA / ARV
No comps found within radius.
Projected returns pro-forma
-3.0% appreciation · 3.0% rent growth · sell at horizon
- IRR
- -13.1%
- Equity multiple
- 0.53×
- Total profit
- $-30,327
- Equity at exit
- $34,294
- IRR
- -4.1%
- Equity multiple
- 0.73×
- Total profit
- $-17,588
- Equity at exit
- $19,886
Cash invested: $64,400 (down + closing). Projections, not guarantees.
Landlord ↔ Tenant lean methodology
- Overall (STATE)
- 62 Landlord-Friendly
- State Pennsylvania
- 62 Landlord-Friendly · EVEN
- County
- — inherits STATE
- City
- — inherits STATE
ZIP-level market 17044
- Home prices YoY
- -6.7%
- Active inventory
- 73
- Price-to-rent
- 9.6×
Monthly cashflow live
- Estimated rent
- $2,000 medium interval (Pro) →
- Mortgage (P&I)
- −$1,206
- Tax from tax record
- −$168 /mo · $2,020/yr
- Insurance
- −$96
- HOA
- −$0
- Vacancy / Maint / Mgmt
- −$420
- Net cashflow
- $110
Break-even live
Sensitivity live
| Price | -10% $240 | -5% $175 | +0% $110 | +5% $45 | +10% $-21 |
|---|---|---|---|---|---|
| Rent | -10% $-48 | -5% $31 | +0% $110 | +5% $189 | +10% $268 |
| Rate | -1.0pp $226 | -0.5pp $168 | base $110 | +0.5pp $50 | +1.0pp $-11 |
UW: 25.0% down · 7.5% · 30yr · 1.5% tax · 5.0% vac · 8.0% maint · 8.0% mgmt
Financing live
Cash to close
- Down payment
- $57,500
- Closing costs
- $6,900
- Reserves months
- —
- Total cash needed
- —
Loan-product check · same deal, 3 products live
Conventional
25% down · 7.5% · 30yr
- Down + closing
- —
- Monthly P&I
- —
- Monthly cashflow
- —
- DSCR
- —
- Eligible?
- —
Personal DTI + credit; lowest rate.
DSCR
20% down · 8.5% · 30yr
- Down + closing
- —
- Monthly P&I
- —
- Monthly cashflow
- —
- DSCR
- —
- Eligible?
- —
No personal income docs; deal must DSCR.
Hard money
10% down · 12.0% · 12mo
- Down + closing
- —
- Monthly P&I
- —
- Monthly cashflow
- —
- DSCR
- —
- Eligible?
- —
Short-term bridge; refi at stabilization.
Rent comps 1 comps
| Address | Beds | Baths | Sqft | Rent | $/sqft | DOM | Units | Dist |
|---|---|---|---|---|---|---|---|---|
| 203 4th Ave Burnham, PA | 3.0 | 2.0 | 1960 | $2,000 | $1.02 | 45d | 1 | 1.20mi |
Listing history 9 events
-
2026-06-21days on market $230,000 Active 10 DOM
-
2026-06-21days on market $230,000 Active 9 DOM
-
2026-06-18days on market $230,000 Active 7 DOM
-
2026-06-17days on market $230,000 Active 6 DOM
-
2026-06-16days on market $230,000 Active 5 DOM
-
2026-06-15days on market $230,000 Active 4 DOM
-
2026-06-13days on market $230,000 Active 2 DOM
-
2026-06-12remarks 628-char remark
-
2026-06-12$230,000 Active 1 DOM
ⓘ Source: listings_history table (triggers on properties + properties_extension) + one-shot
backfill from property_details.listing_events for pre-trigger history.
Tax reassessment forecast PA · Partial reset (capped growth)
- Current annual tax
- $2,020 · $168/mo
- Projected year-2 tax
- $2,827 · $236/mo
- Expected delta
- +$807/yr (+$67/mo · 39.9%)
ⓘ Screening estimate from a state-policy table — verify with the county assessor before closing.
Climate risk First Street
- Flood 1/10 Low FEMA zone X (unshaded) · 0% chance over 30 yrs
- Wildfire 3/10 Moderate
- Heat 4/10 Moderate 7 d/yr ≥98°F today · 17 d/yr by 30 yrs out
- Wind 2/10 Low 0% chance of damaging wind over 30 yrs
- Air quality 2/10 Low 0 unhealthy d/yr today · 1 by 30 yrs out
Nearby sold comps map
Loading sold comps map…
Walkable amenities ~0.75 mi
Loading nearby amenities…
Taxation est. · year 1
- Rental income
- $24,000
- − Mortgage interest
- −$12,884
- − Property taxes
- −$2,020
- − Insurance
- −$1,150
- − Repairs & maintenance
- −$1,920
- − Management
- −$1,920
- − Depreciation
- −$6,691
- Taxable loss
- −$2,585
- Est. tax savings @ 24.0%
- +$620
- After-tax cash flow
- $1,936/yr
For passive investors: Depreciation is non-cash, so a rental often shows a tax loss while cash-flowing — sheltering income. Rental losses are passive: they offset passive income freely, and up to $25,000/yr can offset ordinary (W-2) income if you actively participate and your MAGI is under $100k (phasing out to $0 by $150k); unused losses carry forward. On sale, claimed depreciation is recaptured at up to 25%, and gains may owe capital-gains tax (a 1031 exchange can defer both). Figures are a year-1 estimate at your 24.0% rate — not tax advice; consult a CPA.
Schools (NCES district)
- District
- Mifflin County SD
- NCES district ID
- 4215290
- Math proficiency
- 28% ▼ -7.00%
- Reading proficiency
- 49% ▼ -9.00%
- Median HH income
- $40,718
- Composite
- 32.28/100
- National rank
- #5755
- State rank
- #380 of 539 in PA
Livability — Derry
- Score
- 67/100
- State rank
- #952
- US rank
- #10435
Category grades
Schools grade is shown separately in the Schools card above.
Census & demographics
- Census place
- Highland Park, PA
- Population (ZIP)
- 20,526
Population outlook (Mifflin County) Hauer SSP2
- Today (2025)
- 44,611 people
- By 2030
- 43,212 · -3.1%
- By 2040
- 40,197 · -9.9%
- By 2050
- 36,813 · -17.5%
- By 2075
- 28,833 · -35.4%
- By 2100
- 20,296 · -54.5%
Race, ethnicity, and origin ACS 2023
- Neighborhood character
- Predominantly White (92%)
- Race & ethnicity
- White 92% Two or more races 6% Hispanic / Latino 3%
- Common ancestry
- Romanian 2% Polish 2% Serbian 1%
- Foreign-born
- 1%
- Languages at home
- 97% English-only · Spanish 1% German/W. Germanic 1%
Political lean MEDSL · Mifflin
- 2024 margin
- Solid R (+56.4) · D 21.4% · R 77.9%
- 2008→2024 swing
- -22.8pp toward R · 2008: -33.7pp · 2024: -56.4pp
- All cycles
- 2024: R+56.4 2020: R+56.1 2016: R+57.5 2012: R+46.8 2008: R+33.7
Not yet ingested
- Civics
- —
Market trends
- HPI YoY
- ▼ -15.27%
- Current HPI
- 214.2729
- Rent YoY
- —
- Metro
- —
- State GDP YoY
- ▲ 1.68%
- F500 in state
- 34
Industry mix (Fortune 500 HQ in PA)
| Industry | F500 HQs | Revenue |
|---|---|---|
| Healthcare | 2 | $309B |
|
||
| Insurance | 2 | $27B |
|
||
| Telecommunications / Media | 1 | $124B |
|
||
| Industrial Distribution | 1 | $22B |
|
||
| Financial Services | 1 | $20B |
|
||
| Chemicals / Materials | 1 | $18B |
|
||
Price history
+820.0% since first listed12 events — show timeline
- 2026-06-11 Listed $230,000 BRIGHT MLS
- 2025-03-10 Pending — BRIGHT MLS
- 2025-03-10 Listing Removed — BRIGHT MLS
- 2025-02-26 Listed $189,900 BRIGHT MLS
- 2022-09-02 Sold (Public Records) $141,000 Public Records
- 2022-08-29 Sold (MLS) $141,000 BRIGHT MLS
- 2022-06-30 Listed $139,900 BRIGHT MLS
- 2017-07-05 Sold (Public Records) $100,500 Public Records
- 2017-06-29 Sold (MLS) $100,500 BRIGHT MLS
- 2017-05-11 Listed $99,000 BRIGHT MLS
- 2017-05-11 Listed $99,000 BRIGHT MLS
- 1983-11-21 Sold (Public Records) $25,000 Public Records
Property tax history
+0.6%/yrLatest (2026): $2,020 · +0.8% YoY. Source: county tax records.
Cash-flow waterfall
monthlySold comps — $/sqft
last 12 mo · ≤1 miLoading sold comps…