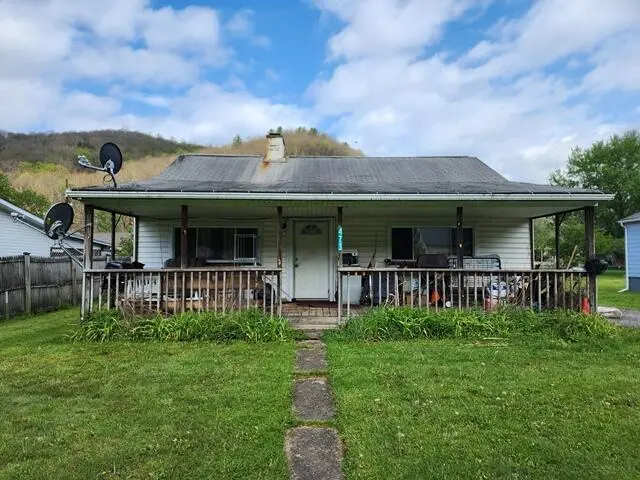
473 Meadow Rd · Shippen, PA
Flood risk 7/10 · Major
- FEMA flood zone
- AE
- Chance of flooding over 30 yrs
- 0.97%
- Est. flood insurance / yr
- $2,026 – $9,024
Fire risk 3/10 · Minor
- Est. fire insurance / yr
- $511 – $949
Heat risk 3/10 · Minor
- Hot days now (above 92°F)
- 9 days/yr
- Hot days in 30 yrs
- 20 days/yr
Wind risk 1/10 · Minimal
- Chance of severe wind over 30 yrs
- —
Air-quality risk 1/10 · Minimal
- Unhealthy air days now
- 0 days/yr
- Unhealthy air days in 30 yrs
- 0 days/yr
Risk factors via First Street. Map © Google.
Why this score? — see what drove the B grade
The composite is a weighted blend of 9 inputs, each scored 0–100. Each bar is that input's sub-score; the figure is the points it added to the 100-point composite (weight × sub-score).
- Cash flow +30.0/30.0
- 1% rule +10.0/10.0
- DSCR +10.0/10.0
- ARV discount +7.5/15.0
- Appreciation +4.9/10.0
- Schools +4.0/10.0
- Rent growth +2.5/5.0
- Livability +2.5/5.0
- Condition / age +2.5/5.0
$32,500
🖨 Deal sheet (PDF) 📄 Offer letter ✓ Due diligence
Listing remarks
2 bedroom, 1 bath, ranch home on a . 20-acre lot with a 2-car detached garage and decent sized back yard. . The home does need TLC, repairs and updates but offers a solid opportunity for investment, downsizing, or affordable homeownership. Property is being sold AS-IS with cash sale only.
Key facts
- 8,712 sq ft lot
- 2 garage spots
- Built 1945
Property features AI
Exterior
- Parking: 2-car garage; Asphalt driveway/parking
- Utilities: Public water; Public sewer
- Home design: Single-family residential; Single-unit property
- Construction: Vinyl siding; Block foundation; Shingle roof
- Exterior features: Deck; 60 x 150 lot (approximately 0.2 acre); Residential zoning
Interior
- Heating & cooling: Forced-air heating; Natural gas heating
- Interior features: Six total rooms
Neighborhood map
What this means for you Summary
Snapshot
- This is a 2-bed/1.0-bath other listed at $32k.
Deal economics
- At list price, monthly cash flow is $-139 ($-2k/yr) — negative.
- To cash-flow at today's rent, offer at most $25k (23.6% below list).
- Meets the 1% rule at list price ($800 rent vs $32k).
- Recommended offer: $25k (23.6% below list) — sets the bar for cash-flow.
Location & tenants
- Location reads: area grade B — affects rentability + tenant quality, not the cash-flow math above.
- Cameron County SD (town): math 36% / reading 61% proficiency, ranked #231 of 539 in PA (top 43%) — families likely to look elsewhere, expect single-tenant / working-renter base with shorter leases.
- Zoned schools: Woodland El Sch (math 47% / reading 72%, grade B-, #377 of 1,518 statewide, top 28%, 263 students, 63% FRL); Cameron County Jshs (math 17% / reading 42%, grade F, #349 of 437 statewide, top 81%, 170 students, 54% FRL) — zoned schools average 58% FRL vs 34% district-wide (24 pts higher); higher-poverty schools than district average — tighter screening recommended.
- Market conditions: 16 active listings in the ZIP; 1 comparable units currently listed for rent nearby.
Forward outlook
- In year one you build about $177 of equity ($225 loan paydown + $-48 appreciation (-0.1% local appreciation)).
- Cameron County population projected at -40% by 2050 — secular population decline; favor cash flow + early exit over multi-decade hold.
Negotiation context
- Only 13 days on market — expect competitive offers; lowballing is unlikely to land.
Risks & watch-outs
- Watch-outs: property tax is 4.7% of price; flood insurance adds $460/mo; built in 1945 — expect roof / HVAC / electrical / plumbing capex.
- Climate carrying-cost: in FEMA flood zone AE (mandatory federal flood insurance) — expect insurance premiums to compound above CPI over the hold.
Questions for the listing agent
- What do current leases actually rent for vs. the listed asking? Can we see a recent rent roll and the last 12 months of T-12 income?
- Built in 1945 — when were the roof, HVAC, electrical panel, plumbing, and water heater last replaced?
- Property tax is high relative to price — has the assessment been appealed recently, and will the sale trigger a re-assessment?
- What's the actual annual flood-insurance premium (NFIP or private), and is the property in a SFHA with mandatory coverage?
- Is there a deadline driving the sale (1031 exchange, divorce, estate, relocation)? That informs how much negotiation room exists.
- What's the average days-on-market for RENTAL listings here right now (not sales)? A rising rental-DOM trend means longer vacancies and softer asking-rent achievability than the comps imply.
- What's the recent tenant-quality profile in this submarket — average credit score on applications, eviction rate, late-payment / NSF rate, and stable-employment percentage? A property-management company in the area should have these aggregated.
- How much new for-sale + rental construction is in the pipeline within 1–3 miles? Heavy new supply typically softens prices + rents 12–24 months out; constrained supply supports both.
Investment metrics
- 1% rule
- 2.46% ✓
- Cap rate
- 18.16%
- Cash-on-cash
- 42.38%
- DSCR
- 2.89
- GRM
- 3.4
CMA / ARV
- ARV (median comp)
- $73,442
- List price
- $32,500
- Delta
- -55.75%
- Verdict
- UNDERPRICED
- Comps
- 3 within 1.0 mi
Projected returns pro-forma
-0.15% appreciation · 3.0% rent growth · sell at horizon
- IRR
- -23.4%
- Equity multiple
- -0.06×
- Total profit
- $-9,683
- Equity at exit
- $9,198
- IRR
- -15.2%
- Equity multiple
- -0.58×
- Total profit
- $-14,409
- Equity at exit
- $10,867
Cash invested: $9,100 (down + closing). Projections, not guarantees.
Landlord ↔ Tenant lean methodology
- Overall (STATE)
- 62 Landlord-Friendly
- State Pennsylvania
- 62 Landlord-Friendly · EVEN
- County
- — inherits STATE
- City
- — inherits STATE
ZIP-level market 15834
- Home prices YoY
- -0.2%
- Active inventory
- 16
- Price-to-rent
- 3.4×
Monthly cashflow live
- Estimated rent
- $800 medium interval (Pro) →
- Mortgage (P&I)
- −$170
- Tax from tax record
- −$127 /mo · $1,520/yr
- Insurance
- −$14
- Flood insurance flood zone
- −$460 /mo · $5,525/yr
- HOA
- −$0
- Vacancy / Maint / Mgmt
- −$168
- Net cashflow
- $-139
Break-even live
Sensitivity live
| Price | -10% $-31 | -5% $-130 | +0% $-139 | +5% $-148 | +10% $-157 |
|---|---|---|---|---|---|
| Rent | -10% $-202 | -5% $-171 | +0% $-139 | +5% $-107 | +10% $-76 |
| Rate | -1.0pp $-123 | -0.5pp $-131 | base $-139 | +0.5pp $-147 | +1.0pp $-156 |
UW: 25.0% down · 7.5% · 30yr · 1.5% tax · 5.0% vac · 8.0% maint · 8.0% mgmt
Financing live
Cash to close
- Down payment
- $8,125
- Closing costs
- $975
- Reserves months
- —
- Total cash needed
- —
Loan-product check · same deal, 3 products live
Conventional
25% down · 7.5% · 30yr
- Down + closing
- —
- Monthly P&I
- —
- Monthly cashflow
- —
- DSCR
- —
- Eligible?
- —
Personal DTI + credit; lowest rate.
DSCR
20% down · 8.5% · 30yr
- Down + closing
- —
- Monthly P&I
- —
- Monthly cashflow
- —
- DSCR
- —
- Eligible?
- —
No personal income docs; deal must DSCR.
Hard money
10% down · 12.0% · 12mo
- Down + closing
- —
- Monthly P&I
- —
- Monthly cashflow
- —
- DSCR
- —
- Eligible?
- —
Short-term bridge; refi at stabilization.
Rent comps 1 comps
| Address | Beds | Baths | Sqft | Rent | $/sqft | DOM | Units | Dist |
|---|---|---|---|---|---|---|---|---|
| 31 W 6th St Emporium, PA | 2.0 | 1.0 | 900 | $800 | $0.89 | 45d | 1 | 1.43mi |
Listing history 1 events
-
2026-05-09$32,500 Active 289-char remark
ⓘ Source: listings_history table (triggers on properties + properties_extension) + one-shot
backfill from property_details.listing_events for pre-trigger history.
Tax reassessment forecast PA · Partial reset (capped growth)
- Current annual tax
- $1,520 · $127/mo
- Projected year-2 tax
- $1,520 · $127/mo
- Expected delta
- $0/yr ($0/mo · 0.0%)
ⓘ Screening estimate from a state-policy table — verify with the county assessor before closing.
Climate risk First Street
- Flood 7/10 Severe FEMA zone AE · 97% chance over 30 yrs
- Wildfire 3/10 Moderate
- Heat 3/10 Moderate 9 d/yr ≥92°F today · 20 d/yr by 30 yrs out
- Wind 1/10 Low
- Air quality 1/10 Low 0 unhealthy d/yr today · 0 by 30 yrs out
Nearby sold comps map
Loading sold comps map…
Walkable amenities ~0.75 mi
Loading nearby amenities…
Taxation est. · year 1
- Rental income
- $9,600
- − Mortgage interest
- −$1,821
- − Property taxes
- −$1,520
- − Insurance
- −$5,688
- − Repairs & maintenance
- −$768
- − Management
- −$768
- − Depreciation
- −$945
- Taxable loss
- −$1,909
- Est. tax savings @ 24.0%
- +$458
- After-tax cash flow
- $-1,210/yr
For passive investors: Depreciation is non-cash, so a rental often shows a tax loss while cash-flowing — sheltering income. Rental losses are passive: they offset passive income freely, and up to $25,000/yr can offset ordinary (W-2) income if you actively participate and your MAGI is under $100k (phasing out to $0 by $150k); unused losses carry forward. On sale, claimed depreciation is recaptured at up to 25%, and gains may owe capital-gains tax (a 1031 exchange can defer both). Figures are a year-1 estimate at your 24.0% rate — not tax advice; consult a CPA.
Schools (NCES district)
- District
- Cameron County SD
- NCES district ID
- 4204830
- Math proficiency
- 36% ▼ -7.00%
- Reading proficiency
- 61% ▼ -9.00%
- Median HH income
- $40,115
- Composite
- 40.49/100
- National rank
- #3714
- State rank
- #231 of 539 in PA
Livability — Shippen
No livability data for this city. (Only ~50 U.S. cities are tracked.)
Census & demographics
- Census place
- Prospect Park, PA
- Population (ZIP)
- 4,086
Population outlook (Cameron County) Hauer SSP2
- Today (2025)
- 4,072 people
- By 2030
- 3,706 · -9.0%
- By 2040
- 3,010 · -26.1%
- By 2050
- 2,443 · -40.0%
- By 2075
- 1,663 · -59.2%
- By 2100
- 1,296 · -68.2%
Race, ethnicity, and origin ACS 2023
- Neighborhood character
- Predominantly White (93%)
- Race & ethnicity
- White 93% Two or more races 5% Hispanic / Latino 2%
- Common ancestry
- Romanian 3% Lithuanian 2% Serbian 2%
- Foreign-born
- 1%
- Languages at home
- 98% English-only · Spanish 1%
Political lean MEDSL · Cameron
- 2024 margin
- Solid R (+50.3) · D 24.2% · R 74.5% · Other 1.2%
- 2008→2024 swing
- -30.5pp toward R · 2008: -19.8pp · 2024: -50.3pp
- All cycles
- 2024: R+50.3 2020: R+46.7 2016: R+50.7 2012: R+29.8 2008: R+19.8
Not yet ingested
- Civics
- —
Market trends
- HPI YoY
- ▼ -0.15%
- Current HPI
- 77.9153
- Rent YoY
- —
- Metro
- —
- State GDP YoY
- ▲ 1.68%
- F500 in state
- 34
Industry mix (Fortune 500 HQ in PA)
| Industry | F500 HQs | Revenue |
|---|---|---|
| Healthcare | 2 | $309B |
|
||
| Insurance | 2 | $27B |
|
||
| Telecommunications / Media | 1 | $124B |
|
||
| Industrial Distribution | 1 | $22B |
|
||
| Financial Services | 1 | $20B |
|
||
| Chemicals / Materials | 1 | $18B |
|
||
Price history
2 events — show timeline
- 2026-05-22 Pending — ECBR
- 2026-05-09 Listed $32,500 ECBR
Property tax history
+0.8%/yrLatest (2026): $1,520 · +0.0% YoY. Source: county tax records.
Cash-flow waterfall
monthlySold comps — $/sqft
last 12 mo · ≤1 miLoading sold comps…