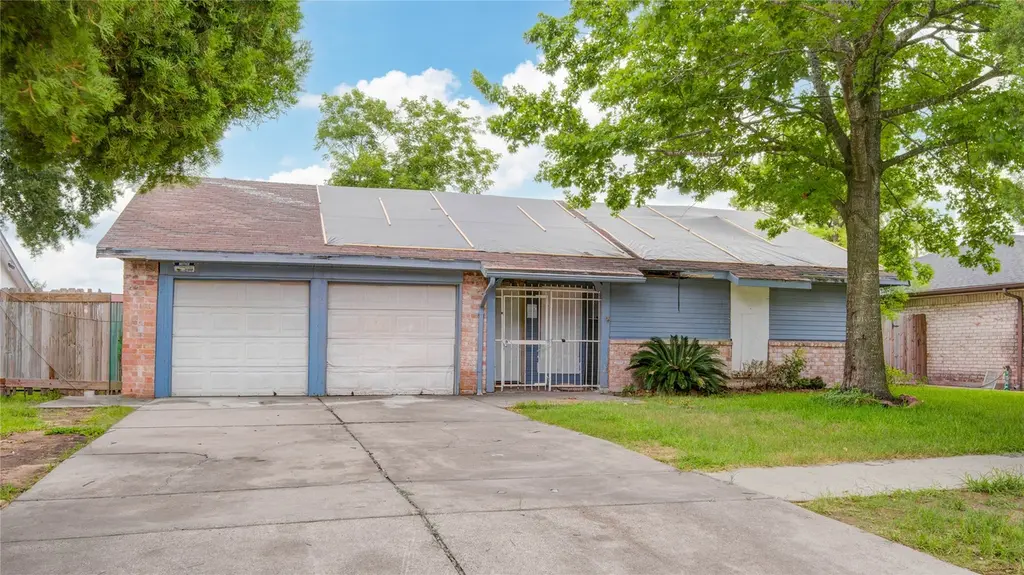
10615 Kirkdale Dr · Houston, TX
Flood risk 3/10 · Minor
- FEMA flood zone
- X (shaded)
- Chance of flooding over 30 yrs
- 0.2%
- Est. flood insurance / yr
- $507 – $1,088
Fire risk 1/10 · Minimal
- Est. fire insurance / yr
- $1,222 – $2,270
Heat risk 9/10 · Severe
- Hot days now (above 109°F)
- 7 days/yr
- Hot days in 30 yrs
- 22 days/yr
Wind risk 9/10 · Severe
- Chance of severe wind over 30 yrs
- 99.0%
Air-quality risk 2/10 · Minimal
- Unhealthy air days now
- 1 days/yr
- Unhealthy air days in 30 yrs
- 2 days/yr
Risk factors via First Street. Map © Google.
Why this score? — see what drove the B- grade
The composite is a weighted blend of 9 inputs, each scored 0–100. Each bar is that input's sub-score; the figure is the points it added to the 100-point composite (weight × sub-score).
- Cash flow +26.8/30.0
- 1% rule +9.8/10.0
- DSCR +9.2/10.0
- ARV discount +7.5/15.0
- Livability +3.7/5.0
- Rent growth +3.4/5.0
- Schools +2.6/10.0
- Condition / age +2.5/5.0
- Appreciation +0.0/10.0
$106,000
🖨 Deal sheet 📄 Offer letter ✓ Due diligence
Listing remarks
* * INVESTOR & HANDYMAN SPECIAL BECAUSE ONCE IT'S GONE, IT'S GONE! * * Whether you're a seasoned investor, first-time flipper, or a homebuyer ready to remodel to your own taste, this blank canvas is priced to move and waiting for the right visionary to unlock the untapped equity hiding inside — bring your tool belt, your imagination, and your best offer before someone else does! This 3-bedroom, 1.5-bath brick home sits on a generous 7,150 SF lot and offers 1,145 SF of pure potential in one of Southeast Houston's most established communities, with unbeatable convenience to I-45 and Beltway 8 (Sam Houston Tollway). Property sold strictly as-is.
Key facts
- 7,148 sq ft lot
- 2 garage spots
- Built 1968
Property features AI
Finance
- HOA & community: Kirkwood Civic Club with an annual fee of $100
Exterior
- Parking: Attached garage with 2 parking spaces
- Utilities: Public water; Public sewer
- Home design: Residential property; Single-story (first-floor living); Slab foundation
- Construction: Brick construction; Composition roof; Built in 1968
- Exterior features: Subdivision lot
Interior
- Bedrooms: Primary bedroom (first floor); 3 possible bedrooms (two additional bedrooms on the first floor)
- Bathrooms: 1 full bathroom; 1 half bathroom
- Heating & cooling: Central heating (gas); Central electric air conditioning
- Interior features: Living room (first floor); 4 total rooms
Neighborhood map
What this means for you Summary
Snapshot
- This is a 3-bed/1.5-bath single-family listed at $106k.
Deal economics
- At list price, monthly cash flow is $289 ($3k/yr) — positive.
- The deal already cash-flows at list — no discount required.
- Meets the 1% rule at list price ($2k rent vs $106k).
- Cap rate 9.6% vs local median 3.2% in Houston — top-decile yield for the area; either an underpriced asset or a hidden risk that comps aren't pricing in. Stress-test before assuming the spread holds.
Location & tenants
- Location reads 74/100 on livability (#184 in TX, #4,771 nationally) — a middle-class / working-renter tenant base. Strengths: amenities A+, cost of living A+, housing A+; Watch: crime F.
- Pasadena ISD (suburban): math 29% / reading 32% proficiency, ranked #612 of 826 in TX (top 74%) — families likely to look elsewhere, expect single-tenant / working-renter base with shorter leases; 71% free/reduced lunch — lower-income household profile, screen leases tightly.
- Zoned schools: Morris Middle (math 32% / reading 33%, grade F, #947 of 1,662 statewide, top 58%, 703 students, 86% FRL); The Summit (High School) (reading 24%, 148 students, 89% FRL) — zoned schools average 88% FRL vs 71% district-wide (16 pts higher); higher-poverty schools than district average — tighter screening recommended.
- Market conditions: Rents rising (+3.5%/yr); 185 active listings in the ZIP; 40 comparable units currently listed for rent nearby; rentals leasing fast (median 10d on market — plan ~1-2 weeks tenant-placement turnaround); solid renter incomes; 29,883 units permitted in Harris County in 2024 (8,621 in 5+ unit buildings).
Forward outlook
- Local home prices are declining (-3.0%/yr); year-one equity from $733 of loan paydown is wiped out by about $3k of value loss. Plan a longer hold.
- Harris County population projected at +47% by 2050 — long-run rental-demand tailwind backs the buy-and-hold thesis.
- At projected returns (-3.0% appreciation + 3.5% rent growth), your $30k cash investment doubles in ~9 years — after that, you're playing with house money.
Negotiation context
- Only 2 days on market — expect competitive offers; lowballing is unlikely to land.
Risks & watch-outs
- Watch-outs: property tax is 3.9% of price.
- Climate carrying-cost: severe wind risk, 99% chance of damaging wind over 30y; extreme-heat days projected 7→22/yr by 2055 (HVAC capex compounding) — expect insurance premiums to compound above CPI over the hold.
Questions for the listing agent
- Built in 1968 — when were the roof, HVAC, electrical panel, plumbing, and water heater last replaced?
- Property tax is high relative to price — has the assessment been appealed recently, and will the sale trigger a re-assessment?
- What does the HOA fee cover, when was the last increase, and are there any pending special assessments or reserve-fund shortfalls?
- Is there a deadline driving the sale (1031 exchange, divorce, estate, relocation)? That informs how much negotiation room exists.
- Schools are D-rated, which usually means shorter tenancies and higher turnover. Who's the typical renter profile here, and what's been the actual vacancy rate?
- Crime grade is F in this area — have there been break-ins, vandalism, or insurance claims at this property in the last 3 years? What carrier currently insures it and at what premium?
- What's the average days-on-market for RENTAL listings here right now (not sales)? A rising rental-DOM trend means longer vacancies and softer asking-rent achievability than the comps imply.
- What's the recent tenant-quality profile in this submarket — average credit score on applications, eviction rate, late-payment / NSF rate, and stable-employment percentage? A property-management company in the area should have these aggregated.
- How much new for-sale + rental construction is in the pipeline within 1–3 miles? Heavy new supply typically softens prices + rents 12–24 months out; constrained supply supports both.
Investment metrics
- 1% rule
- 1.48% ✓
- Cap rate
- 9.56%
- Cash-on-cash
- 11.68%
- DSCR
- 1.52
- GRM
- 5.6
CMA / ARV
- ARV (on-the-fly)
- $212,970
- Comps found
- 12
Show comp detail 12 sales within ~0.75 mi
| Address | Dist | Beds/Ba | Sqft | Sold | Price | $/sf | Match |
|---|---|---|---|---|---|---|---|
| 10606 Kirkdale Dr | 0.04mi | 3/1.5 | 1,125 (-2%) | 1mo | $209,000 | $186 | 94 |
| 10519 Kirkglen Dr | 0.12mi | 3/1.5 | 1,156 (+1%) | 6mo | $179,000 | $155 | 87 |
| 10419 Kirkhill Dr | 0.13mi | 3/1.5 | 1,019 (-11%) | 1mo | $219,900 | $216 | 75 |
| 10502 Kirklane Dr | 0.15mi | 3/1.5 | 1,125 (-2%) | 20mo | $194,500 | $173 | 74 |
| 10327 Southport Dr | 0.69mi | 3/2.0 | 1,125 (-2%) | 2mo | $225,000 | $200 | 61 |
| 10903 Ritow St | 0.61mi | 3/2.0 | 1,046 (-9%) | 1mo | $225,000 | $215 | 54 |
| 10918 Ritow St | 0.61mi | 3/1.0 | 1,050 (-8%) | 4mo | $174,900 | $167 | 52 |
| 10810 Eddyrock St | 0.72mi | 4/2.0 (+1) | 1,200 (+5%) | 3mo | $249,000 | $208 | 49 |
| 10615 Seaford Dr | 0.73mi | 3/1.0 | 1,208 (+6%) | 22mo | $189,900 | $157 | 36 |
| 10335 Rambling Trl | 0.74mi | 3/1.0 | 974 (-15%) | 12mo | $205,000 | $210 | 28 |
| 10331 Southport Dr | 0.69mi | 2/1.0 (-1) | 1,253 (+9%) | 23mo | $199,900 | $160 | 26 |
| 10914 Keese Dr | 0.71mi | 2/1.5 (-1) | 988 (-14%) | 24mo | $164,900 | $167 | 19 |
Match score weights: distance 35% · size 25% · config 20% · recency 20%. Top-matched comps best support the ARV.
Projected returns pro-forma
-3.0% appreciation · 3.48% rent growth · sell at horizon
- IRR
- 1.9%
- Equity multiple
- 1.07×
- Total profit
- $2,142
- Equity at exit
- $15,805
- IRR
- 12.1%
- Equity multiple
- 1.99×
- Total profit
- $29,347
- Equity at exit
- $9,165
Cash invested: $29,680 (down + closing). Projections, not guarantees.
Landlord ↔ Tenant lean methodology
- Overall (STATE)
- 87 Strongly Landlord-Friendly
- State Texas
- 87 Strongly Landlord-Friendly · R+5
- County
- — inherits STATE
- City
- — inherits STATE
ZIP-level market 77089
- Rents YoY
- 3.5%
- Active inventory
- 185
- Price-to-rent
- 5.6×
Monthly cashflow live
- Estimated rent
- $1,567 high interval (Pro) →
- Mortgage (P&I)
- −$556
- Tax from tax record
- −$341 /mo · $4,088/yr
- Insurance
- −$44
- HOA
- −$8
- Vacancy / Maint / Mgmt
- −$329
- Net cashflow
- $289
Break-even live
UW: 25.0% down · 7.5% · 30yr · 1.5% tax · 5.0% vac · 8.0% maint · 8.0% mgmt
Financing live
Cash to close
- Down payment
- $26,500
- Closing costs
- $3,180
- Reserves months
- —
- Total cash needed
- —
Loan-product check · same deal, 3 products live
Conventional
25% down · 7.5% · 30yr
- Down + closing
- —
- Monthly P&I
- —
- Monthly cashflow
- —
- DSCR
- —
- Eligible?
- —
Personal DTI + credit; lowest rate.
DSCR
20% down · 8.5% · 30yr
- Down + closing
- —
- Monthly P&I
- —
- Monthly cashflow
- —
- DSCR
- —
- Eligible?
- —
No personal income docs; deal must DSCR.
Hard money
10% down · 12.0% · 12mo
- Down + closing
- —
- Monthly P&I
- —
- Monthly cashflow
- —
- DSCR
- —
- Eligible?
- —
Short-term bridge; refi at stabilization.
Rent comps 40 comps
| Address | Beds | Baths | Sqft | Rent | $/sqft | DOM | Units | Dist |
|---|---|---|---|---|---|---|---|---|
| 11144 Fuqua St Houston, TX | 1.0–2.0 | 1.0–2.0 | 1066 | $1,959 | $1.84 | 10d | 24 | 0.21mi |
| 10700 Fuqua St Unit 421 Houston, TX | 2.0 | 2.0 | 904 | $1,027 | $1.14 | 5d | 1 | 0.30mi |
| 10925 Beamer Rd Houston, TX | 1.0–2.0 | 1.0–2.0 | 868 | $1,280 | $1.47 | 3d | 25 | 0.30mi |
| 12055 Sabo Rd Houston, TX | 1.0–3.0 | 1.0–2.0 | 970 | $2,067 | $2.13 | 2d | 15 | 0.32mi |
| 11887 Gulf Pointe Dr Houston, TX | 2.0 | 2.0 | 1035 | $1,254 | $1.21 | 43d | 1 | 0.33mi |
| 10931 Beamer Rd Houston, TX | 2.0 | 2.0 | 1012 | $1,125 | $1.11 | 19d | 1 | 0.38mi |
| 10931 Beamer Rd Houston, TX | 2.0 | 2.0 | 1012 | $1,125 | $1.11 | 43d | 1 | 0.38mi |
| 11881 Gulf Pointe Dr Unit 3047 Houston, TX | 3.0 | 2.0 | 1365 | $1,992 | $1.46 | 18d | 1 | 0.39mi |
| 17 Gulf Pointe Dr Houston, TX | 2.0 | 2.0 | 1177 | $1,379 | $1.17 | 43d | 1 | 0.39mi |
| 11881 Gulf Pointe Dr Unit 2162 Houston, TX | 2.0 | 2.0 | 1035 | $1,400 | $1.35 | 5d | 1 | 0.40mi |
| 11881 Gulf Pointe Dr Unit 3174 Houston, TX | 3.0 | 2.0 | 1365 | $2,064 | $1.51 | 10d | 1 | 0.40mi |
| 11881 Gulf Pointe Dr Unit 2112 Houston, TX | 2.0 | 2.0 | 1035 | $1,392 | $1.34 | 2d | 1 | 0.40mi |
| 11881 Gulf Pointe Dr Unit 3112 Houston, TX | 3.0 | 2.0 | 1365 | $2,032 | $1.49 | 2d | 1 | 0.40mi |
| 11881 Gulf Pointe Dr Unit 11914 Houston, TX | 3.0 | 2.0 | 1365 | $2,035 | $1.49 | 43d | 1 | 0.40mi |
| 11881 Gulf Pointe Dr Unit 11918 Houston, TX | 2.0 | 2.0 | 1035 | $1,424 | $1.38 | 10d | 1 | 0.40mi |
| 11881 Gulf Pointe Dr Unit 11938 Houston, TX | 2.0 | 2.0 | 1035 | $1,425 | $1.38 | 43d | 1 | 0.40mi |
| 10701 Sabo Rd Houston, TX | 1.0–2.0 | 1.0–2.0 | 785 | $1,155 | $1.47 | 1d | 29 | 0.41mi |
| 11156 Beamer Rd Houston, TX | 2.0 | 2.0 | 1012 | $1,170 | $1.16 | 43d | 1 | 0.42mi |
| 11666 Gulf Pointe Dr Houston, TX | 1.0–3.0 | 1.0–2.0 | 1129 | $2,101 | $1.86 | 1d | 31 | 0.49mi |
| 10601 Sabo Rd Houston, TX | 1.0–3.0 | 1.0–2.0 | 814 | $1,359 | $1.67 | 24d | 5 | 0.52mi |
| 10601 Sabo Rd Houston, TX | 1.0–3.0 | 1.0–2.0 | 814 | $1,359 | $1.67 | 3d | 11 | 0.52mi |
| 11150 Beamer Rd Apt 422 Houston, TX | 2.0 | 2.0 | 904 | $1,024 | $1.13 | 10d | 1 | 0.55mi |
| 10950 Tanner Park Ct Houston, TX | 2.0–3.0 | 1.0–2.0 | 998 | $1,150 | $1.15 | 2d | 16 | 0.72mi |
| 12807 Roydon Dr Houston, TX | 2.0 | 2.0 | 924 | $1,170 | $1.27 | 43d | 1 | 0.75mi |
| 12801 Roydon Dr Houston, TX | 1.0–2.0 | 1.0–2.0 | 773 | $1,240 | $1.60 | 1d | 18 | 0.79mi |
| 12601 S Green Dr Unit 2047 Houston, TX | 2.0 | 2.0 | 883 | $1,180 | $1.34 | 10d | 1 | 0.84mi |
| 12601 S Green Dr Houston, TX | 1.0–2.0 | 1.0–2.0 | 808 | $1,425 | $1.76 | 43d | 1 | 0.85mi |
| 12601 S Green Dr Unit 2162 Houston, TX | 2.0 | 2.0 | 883 | $1,145 | $1.30 | 5d | 1 | 0.89mi |
| 12601 S Green Dr Unit 12658 Houston, TX | 2.0 | 2.0 | 883 | $1,137 | $1.29 | 2d | 1 | 0.89mi |
| 11717 Beamer Rd Houston, TX | 1.0–2.0 | 1.0–2.0 | 720 | $1,062 | $1.48 | 1d | 16 | 0.89mi |
| 12516 S Green Dr Houston, TX | 3.0 | 2.0 | 1295 | $1,600 | $1.24 | 43d | 1 | 0.91mi |
| 11723 Beamer Rd Houston, TX | 2.0 | 2.0 | 856 | $1,095 | $1.28 | 43d | 1 | 0.94mi |
| 11700 Fuqua St Unit 11757 Houston, TX | 2.0 | 2.0 | 850 | $1,121 | $1.32 | 16d | 1 | 0.97mi |
| 11700 Fuqua St Houston, TX | 1.0–2.0 | 1.0–2.0 | 762 | $1,175 | $1.54 | 1d | 9 | 0.97mi |
| 10418 Sagemeadow Ln Houston, TX | 4.0 | 2.0 | 1429 | $1,950 | $1.36 | 43d | 1 | 1.19mi |
| 11438 Brook Meadow Dr Houston, TX | 3.0 | 2.0 | 1450 | $1,895 | $1.31 | 21d | 1 | 1.20mi |
| 10121 Windmill Lakes Blvd Unit 10158 Houston, TX | 2.0 | 2.0 | 914 | $1,434 | $1.57 | 10d | 1 | 1.34mi |
| 10121 Windmill Lakes Blvd Unit 10178 Houston, TX | 2.0 | 2.0 | 1009 | $1,260 | $1.25 | 21d | 1 | 1.34mi |
| 10121 Windmill Lakes Blvd Unit 2162 Houston, TX | 2.0 | 2.0 | 914 | $1,410 | $1.54 | 5d | 1 | 1.34mi |
| 10121 Windmill Lakes Blvd Unit 2165 Houston, TX | 2.0 | 2.0 | 914 | $1,402 | $1.53 | 2d | 1 | 1.34mi |
HOA detail
- Monthly dues
- $8 · $96/yr
Listing history 3 events
-
2026-06-18days on market $106,000 Active 2 DOM
-
2026-06-17remarks 656-char remark
-
2026-06-17$106,000 Active 1 DOM
ⓘ Source: listings_history table (triggers on properties + properties_extension) + one-shot
backfill from property_details.listing_events for pre-trigger history.
Tax reassessment forecast TX · Resets to sale price
- Current annual tax
- $4,088 · $341/mo
- Projected year-2 tax
- $4,088 · $341/mo
- Expected delta
- $0/yr ($0/mo · 0.0%)
ⓘ Screening estimate from a state-policy table — verify with the county assessor before closing.
Climate risk First Street
- Flood 3/10 Moderate FEMA zone X (shaded) · 20% chance over 30 yrs
- Wildfire 1/10 Low
- Heat 9/10 Extreme 7 d/yr ≥109°F today · 22 d/yr by 30 yrs out
- Wind 9/10 Extreme 99% chance of damaging wind over 30 yrs
- Air quality 2/10 Low 1 unhealthy d/yr today · 2 by 30 yrs out
Nearby sold comps map
Loading sold comps map…
Walkable amenities ~0.75 mi
Loading nearby amenities…
Taxation est. · year 1
- Rental income
- $18,800
- − Mortgage interest
- −$5,938
- − Property taxes
- −$4,088
- − Insurance
- −$530
- − Repairs & maintenance
- −$1,504
- − Management
- −$1,504
- − HOA
- −$96
- − Depreciation
- −$3,084
- Taxable income
- $2,056
- Est. tax owed @ 24.0%
- −$494
- After-tax cash flow
- $2,974/yr
For passive investors: Depreciation is non-cash, so a rental often shows a tax loss while cash-flowing — sheltering income. Rental losses are passive: they offset passive income freely, and up to $25,000/yr can offset ordinary (W-2) income if you actively participate and your MAGI is under $100k (phasing out to $0 by $150k); unused losses carry forward. On sale, claimed depreciation is recaptured at up to 25%, and gains may owe capital-gains tax (a 1031 exchange can defer both). Figures are a year-1 estimate at your 24.0% rate — not tax advice; consult a CPA.
Schools (NCES district)
- District
- Pasadena ISD
- NCES district ID
- 4834320
- Math proficiency
- 29% ▼ -17.00%
- Reading proficiency
- 32% ▼ -9.00%
- Median HH income
- $45,163
- Composite
- 26.15/100
- National rank
- #7275
- State rank
- #612 of 826 in TX
Livability — Houston
- Score
- 74/100
- State rank
- #184
- US rank
- #4771
Category grades
Schools grade is shown separately in the Schools card above.
Census & demographics
- Census place
- Houston, TX
- County
- Harris County · 4,702,590 people
- City population
- 3,226,434
- Metro
- Houston-The Woodlands-Sugar Land, TX
- Population (ZIP)
- 57,741
- Household income
- $88,140
- Rent vs Own
- Severe rent burden
- 1483.0
Population outlook (Harris County) Hauer SSP2
- Today (2025)
- 5,571,493 people
- By 2030
- 6,089,821 · +9.3%
- By 2040
- 7,142,806 · +28.2%
- By 2050
- 8,185,864 · +46.9%
- By 2075
- 10,574,329 · +89.8%
- By 2100
- 12,109,958 · +117.4%
Race, ethnicity, and origin ACS 2023
- Neighborhood character
- Highly diverse neighborhood (Simpson 0.71)
- Race & ethnicity
- Hispanic / Latino 45% Two or more races 22% White 19% Asian 17% Black 16%
- Hispanic origin (detail)
- Mexican 37%
- Common ancestry
- Lithuanian 2% Italian 2% Romanian 1%
- Foreign-born
- 23% · Canada, Vietnam, China
- Languages at home
- 53% English-only · Spanish 33% Vietnamese 7% Other Indo-European 1%
Political lean MEDSL · Harris
- 2024 margin
- Lean D (+5.5) · D 52.0% · R 46.4% · Other 1.6%
- 2008→2024 swing
- +3.9pp toward D · 2008: 1.6pp · 2024: 5.5pp
- All cycles
- 2024: D+5.5 2020: D+13.3 2016: D+12.4 2012: D+0.1 2008: D+1.6
Not yet ingested
- Civics
- —
Market trends
- HPI YoY
- ▼ -156.31%
- Current HPI
- 249.5438
- Rent YoY
- ▲ 3.48%
- Metro
- Houston-The Woodlands-Sugar Land, TX
- State GDP YoY
- ▲ 3.95%
- F500 in state
- 110
Industry mix (Fortune 500 HQ in TX)
| Industry | F500 HQs | Revenue |
|---|---|---|
| Energy | 16 | $1,198B |
|
||
| Technology | 5 | $198B |
|
||
| Engineering / Construction | 4 | $72B |
|
||
| Energy Services | 3 | $60B |
|
||
| Utilities | 3 | $41B |
|
||
| Healthcare | 2 | $330B |
|
||
Price history
2 events — show timeline
- 2026-06-16 Listed $106,000 HARMLS
- 1988-01-02 Sold (Public Records) — Public Records
Property tax history
+6.8%/yrLatest (2025): $4,088 · +1.0% YoY. Source: county tax records.
Cash-flow waterfall
monthlySold comps — $/sqft
last 12 mo · ≤1 miLoading sold comps…