74048 Angels Camp Rd · Palm Desert, CA
Flood risk 1/10 · Minimal
- FEMA flood zone
- X (unshaded)
- Chance of flooding over 30 yrs
- 0.0%
- Est. flood insurance / yr
- $507 – $1,088
Fire risk 1/10 · Minimal
- Est. fire insurance / yr
- $659 – $1,223
Heat risk 9/10 · Severe
- Hot days now (above 114°F)
- 7 days/yr
- Hot days in 30 yrs
- 19 days/yr
Wind risk 1/10 · Minimal
- Chance of severe wind over 30 yrs
- —
Air-quality risk 4/10 · Minor
- Unhealthy air days now
- 5 days/yr
- Unhealthy air days in 30 yrs
- 6 days/yr
Risk factors via First Street. Map © Google.
Why this score? — see what drove the C- grade
The composite is a weighted blend of 9 inputs, each scored 0–100. Each bar is that input's sub-score; the figure is the points it added to the 100-point composite (weight × sub-score).
- Cash flow +22.1/30.0
- ARV discount +7.5/15.0
- DSCR +7.1/10.0
- 1% rule +6.3/10.0
- Schools +3.8/10.0
- Rent growth +2.9/5.0
- Livability +2.6/5.0
- Condition / age +2.5/5.0
- Appreciation +0.0/10.0
$419,000
🖨 Deal sheet (PDF) 📄 Offer letter ✓ Due diligence
Listing remarks
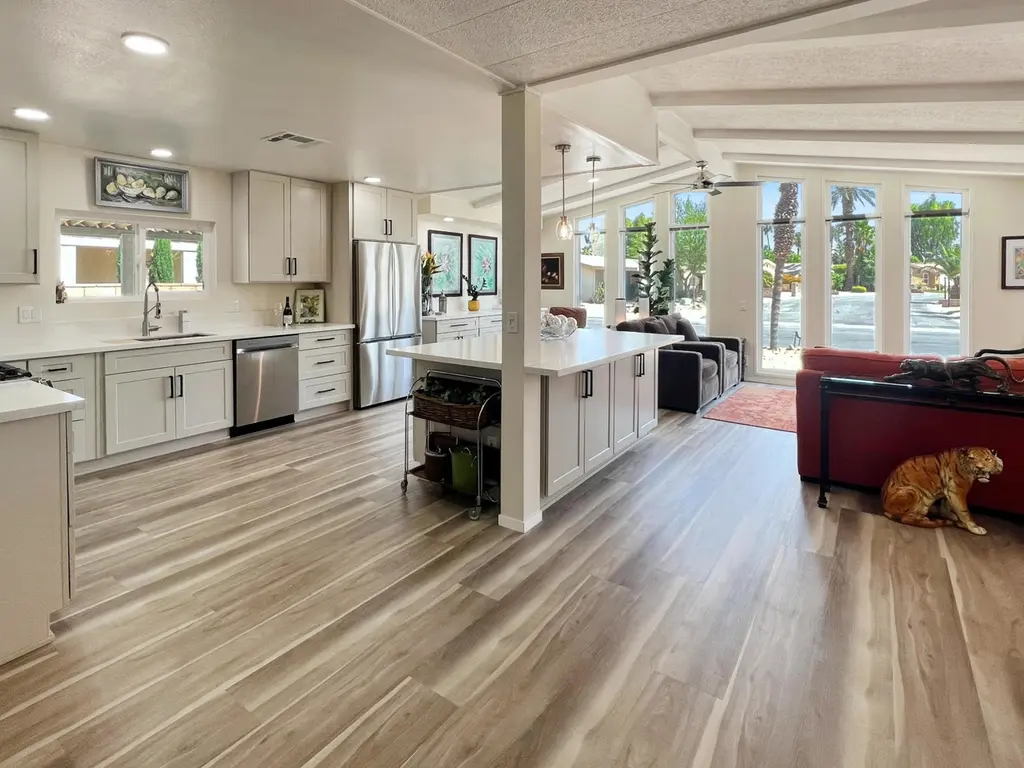
Completely reimagined to 2026 standards, this beautifully remodeled 2-bedroom, 2-bath home blends modern design, comfort, and functionality with exceptional attention to detail throughout. Located Portola Country Club where you OWN THE LAND and the GOLF IS FREE. The stunning new kitchen features custom soft-close cabinetry, elegant quartz countertops, and all-new appliances. Matching quartz surfaces and cabinetry continue through the bathrooms and laundry room, creating a cohesive upscale feel while the large central island in the great room allows much flexibility for living and dining options. New laminate flooring throughout the home, LED ceiling lighting, all BRAND-NEW DUAL-PANE WINDOWS
Key facts
- Quartz countertops
- Walk-in closet
- Remodeled kitchen
Tags
Property features AI
Finance
- Other: Disclosures include CC&R, pet restrictions, planned development, owner has real estate license, and homeowners association; Listing terms accept Conventional, FHA, and cash financing; short-term rentals not allowed; will not consider lease
- HOA & community: Monthly HOA dues (association fees) of $455; HOA covers clubhouse, trash, security, and cable TV; Community amenities: clubhouse, fitness center, tennis and sport courts, bocce ball, pickleball courts, golf course (par 3), golf within development, billiard/card rooms, meeting room, guest parking, RV parking, trailer storage; Senior community; Assoc pet rules apply
Exterior
- Parking: 3 total parking spaces; Attached carport (3-car carport); Golf cart garage
- Security: Gated community with controlled access; Association security included
- Utilities: Cable TV available; TV/Cable available; Sewer paid in street; PUD within community
- Home design: Detached single-story home; One level; Fee simple land
- Construction: Stucco exterior; Permanent foundation; Year built from assessor
- Exterior features: Gated community; Awning-covered patio/deck with wood and concrete slab elements; Block fencing; Mountain views; Drip irrigation system and sprinkler timer; Street lights on city street frontage
Interior
- Kitchen: Island; Remodeled kitchen with quartz counters; Dishwasher; Gas range; Disposal; Water line to refrigerator; Walk-in pantry
- Flooring: Laminate flooring
- Bathrooms: 2 full bathrooms; Double vanities; Tile shower; Low-flow toilets; Linen closet
- Heating & cooling: Natural gas heating (forced air); Central air conditioning
- Interior features: Cathedral and vaulted ceilings; Open floorplan; Updated/remodeled condition; Unfurnished
- Laundry & utility: Dedicated laundry room (individual room)
Neighborhood map
What this means for you Summary
Snapshot
- This is a 2-bed/2.0-bath manufactured listed at $419k.
Deal economics
- At list price, monthly cash flow is $673 ($8k/yr) — positive.
- The deal already cash-flows at list — no discount required.
- Meets the 1% rule at list price ($5k rent vs $419k).
- Recommended offer: $413k (1.5% below list) — sets the bar for market timing.
- Cap rate 8.2% vs local median 3.5% in Palm Desert — top-decile yield for the area; either an underpriced asset or a hidden risk that comps aren't pricing in. Stress-test before assuming the spread holds.
Location & tenants
- Location reads 51/100 on livability (#1,050 in CA) — a working-class tenant base; expect higher turnover. Strengths: employment B+, housing B; Watch: crime D, amenities F, commute F.
- Desert Sands Unified (suburban): math 31% / reading 56% proficiency, ranked #199 of 517 in CA (top 38%) — families likely to look elsewhere, expect single-tenant / working-renter base with shorter leases.
- Zoned schools: James Earl Carter Elementary (516 students, 53% FRL); Colonel Mitchell Paige Middle (math 10% / reading 10%, grade F, #474 of 498 statewide, top 99%, 436 students, 74% FRL); Palm Desert High (math 42% / reading 67%, grade C-, #256 of 1,170 statewide, top 24%, 2,050 students, 57% FRL).
- Market conditions: Rents rising (+1.6%/yr); 551 active listings in the ZIP; 40 comparable units currently listed for rent nearby; rentals lingering (median 46d on market — plan ~5-8 weeks vacancy on turnover, expect pricing pressure); 80% of comp listings sitting > 30 days — soft ceiling on asking rent; 9,195 units permitted in Riverside County in 2024 (1,512 in 5+ unit buildings).
- At $4,720/mo this rent would consume 81% of the median local household income ($70k/yr) (locally 1734% of renters already pay >50% of income on rent) — very limited rent-growth headroom before tenants either downsize or default.
Forward outlook
- Local home prices are declining (-3.0%/yr); year-one equity from $3k of loan paydown is wiped out by about $13k of value loss. Plan a longer hold.
- Riverside County population projected at +22% by 2050 — long-run rental-demand tailwind backs the buy-and-hold thesis.
Negotiation context
- It's been on market 26 days — a 2% lower offer ($413k) is reasonable based on typical stale-listing flexibility.
- 13 sale attempts since 27y ago with the ask held roughly flat each time — persistent listings suggest the price (not the market) is what's stuck; bring a comps-based counter.
- Current owner paid $50k; list at $419k implies a 738% gain — meaningful room to come down on a strong offer.
Risks & watch-outs
- Climate carrying-cost: extreme-heat days projected 7→19/yr by 2055 (HVAC capex compounding) — expect insurance premiums to compound above CPI over the hold.
Questions for the listing agent
- Built in 1979 — when were the roof, HVAC, electrical panel, plumbing, and water heater last replaced?
- What does the HOA fee cover, when was the last increase, and are there any pending special assessments or reserve-fund shortfalls?
- Is there a deadline driving the sale (1031 exchange, divorce, estate, relocation)? That informs how much negotiation room exists.
- Schools are A-rated — typically a magnet for longer-tenancy family renters. What's the average tenant stay here, and is there a school-zone premium baked into asking?
- Crime grade is D in this area — have there been break-ins, vandalism, or insurance claims at this property in the last 3 years? What carrier currently insures it and at what premium?
- What's the average days-on-market for RENTAL listings here right now (not sales)? A rising rental-DOM trend means longer vacancies and softer asking-rent achievability than the comps imply.
- What's the recent tenant-quality profile in this submarket — average credit score on applications, eviction rate, late-payment / NSF rate, and stable-employment percentage? A property-management company in the area should have these aggregated.
- How much new for-sale + rental construction is in the pipeline within 1–3 miles? Heavy new supply typically softens prices + rents 12–24 months out; constrained supply supports both.
Investment metrics
- 1% rule
- 1.13% ✓
- Cap rate
- 8.22%
- Cash-on-cash
- 6.88%
- DSCR
- 1.31
- GRM
- 7.4
CMA / ARV
- ARV (on-the-fly)
- $265,440
- Comps found
- 12
Show comp detail 12 sales within ~0.75 mi
| Address | Dist | Beds/Ba | Sqft | Sold | Price | $/sf | Match |
|---|---|---|---|---|---|---|---|
| 74529 Azurite Cir | 0.40mi | 2/2.0 | 1,740 (+4%) | 1mo | $427,500 | $246 | 75 |
| 42585 Granite Pl | 0.37mi | 2/2.0 | 1,760 (+5%) | 6mo | $175,000 | $99 | 70 |
| 74584 Nevada Cir E | 0.48mi | 2/2.0 | 1,734 (+3%) | 6mo | $257,500 | $149 | 68 |
| 74592 Nevada Cir E | 0.48mi | 2/2.0 | 1,590 (-5%) | 2mo | $317,000 | $199 | 67 |
| 74647 Azurite Cir E | 0.49mi | 3/2.0 (+1) | 1,700 (+1%) | 4mo | $260,000 | $153 | 67 |
| 74578 Zircon Cir E | 0.42mi | 2/2.0 | 1,542 (-8%) | 0mo | $250,000 | $162 | 66 |
| 74411 Gary Ave. Ave | 0.51mi | 2/2.0 | 1,584 (-6%) | 5mo | $397,000 | $251 | 63 |
| 42090 Diadomite Way | 0.35mi | 2/2.0 | 1,520 (-10%) | 7mo | $240,000 | $158 | 62 |
| 74072 Mercury Circle Cir W | 0.27mi | 2/2.0 | 1,440 (-14%) | 5mo | $222,000 | $154 | 59 |
| 42099 Diadomite Way | 0.32mi | 3/2.0 (+1) | 1,880 (+12%) | 2mo | $279,000 | $148 | 59 |
| 42651 Vanadium Pl | 0.34mi | 2/2.0 | 1,440 (-14%) | 4mo | $290,000 | $201 | 56 |
| 74596 Azurite Cir E | 0.46mi | 2/2.0 | 1,440 (-14%) | 6mo | $201,600 | $140 | 50 |
Match score weights: distance 35% · size 25% · config 20% · recency 20%. Top-matched comps best support the ARV.
Projected returns pro-forma
-3.0% appreciation · 1.6% rent growth · sell at horizon
- IRR
- -7.4%
- Equity multiple
- 0.73×
- Total profit
- $-31,434
- Equity at exit
- $62,474
- IRR
- 0.3%
- Equity multiple
- 1.02×
- Total profit
- $2,333
- Equity at exit
- $36,227
Cash invested: $117,320 (down + closing). Projections, not guarantees.
Landlord ↔ Tenant lean methodology
- Overall (STATE)
- 18 Strongly Tenant-Friendly
- State California
- 18 Strongly Tenant-Friendly · D+13
- County
- — inherits STATE
- City
- — inherits STATE
ZIP-level market 92260
- Rents YoY
- 1.6%
- Active inventory
- 551
- Price-to-rent
- 7.4×
Monthly cashflow live
- Estimated rent
- $4,720 high interval (Pro) →
- Mortgage (P&I)
- −$2,197
- Tax from tax record
- −$229 /mo · $2,748/yr
- Insurance
- −$175
- HOA
- −$455
- Vacancy / Maint / Mgmt
- −$991
- Net cashflow
- $673
Break-even live
Sensitivity live
| Price | -10% $910 | -5% $791 | +0% $673 | +5% $554 | +10% $436 |
|---|---|---|---|---|---|
| Rent | -10% $300 | -5% $486 | +0% $673 | +5% $859 | +10% $1,046 |
| Rate | -1.0pp $884 | -0.5pp $779 | base $673 | +0.5pp $564 | +1.0pp $454 |
UW: 25.0% down · 7.5% · 30yr · 1.5% tax · 5.0% vac · 8.0% maint · 8.0% mgmt
Financing live
Cash to close
- Down payment
- $104,750
- Closing costs
- $12,570
- Reserves months
- —
- Total cash needed
- —
Loan-product check · same deal, 3 products live
Conventional
25% down · 7.5% · 30yr
- Down + closing
- —
- Monthly P&I
- —
- Monthly cashflow
- —
- DSCR
- —
- Eligible?
- —
Personal DTI + credit; lowest rate.
DSCR
20% down · 8.5% · 30yr
- Down + closing
- —
- Monthly P&I
- —
- Monthly cashflow
- —
- DSCR
- —
- Eligible?
- —
No personal income docs; deal must DSCR.
Hard money
10% down · 12.0% · 12mo
- Down + closing
- —
- Monthly P&I
- —
- Monthly cashflow
- —
- DSCR
- —
- Eligible?
- —
Short-term bridge; refi at stabilization.
Rent comps 40 comps
| Address | Beds | Baths | Sqft | Rent | $/sqft | DOM | Units | Dist |
|---|---|---|---|---|---|---|---|---|
| 82 Presidio Pl Palm Desert, CA | 3.0 | 2.0 | 1851 | $5,500 | $2.97 | 46d | 1 | 0.18mi |
| 84 Presidio Pl Palm Desert, CA | 3.0 | 2.0 | 1921 | $6,500 | $3.38 | 46d | 1 | 0.19mi |
| 92 Presidio Pl Palm Desert, CA | 3.0 | 2.0 | 1821 | $5,500 | $3.02 | 46d | 1 | 0.21mi |
| 74036 Mercury Cir W Palm Desert, CA | 2.0 | 2.0 | 1440 | $2,800 | $1.94 | 46d | 1 | 0.28mi |
| 74401 Hovley Lane East Palm Desert, CA | 1.0–3.0 | 1.0–2.0 | 1042 | $2,656 | $2.55 | 1d | 22 | 0.35mi |
| 168 Camino Arroyo S Palm Desert, CA | 3.0 | 3.0 | 2051 | $5,000 | $2.44 | 46d | 1 | 0.36mi |
| 39 Camino Arroyo Pl Palm Desert, CA | 2.0 | 2.0 | 1533 | $6,000 | $3.91 | 46d | 1 | 0.38mi |
| 181 Camino Arroyo S Palm Desert, CA | 3.0 | 2.0 | 1821 | $6,300 | $3.46 | 46d | 1 | 0.40mi |
| 432 S Sierra Madre Palm Desert, CA | 2.0 | 2.0 | 1584 | $5,300 | $3.35 | 46d | 1 | 0.42mi |
| 430 S Sierra Madre Palm Desert, CA | 2.0 | 2.0 | 1303 | $5,500 | $4.22 | 46d | 1 | 0.42mi |
| 255 Via Rengo Palm Desert, CA | 2.0 | 2.0 | 1122 | $2,700 | $2.41 | 46d | 1 | 0.43mi |
| 255 Via Rengo Palm Desert, CA | 2.0 | 2.0 | 1122 | $2,600 | $2.32 | 7d | 1 | 0.43mi |
| 38 Conejo Cir Palm Desert, CA | 3.0 | 3.0 | 2056 | $6,500 | $3.16 | 46d | 1 | 0.45mi |
| 74350 Magnesia Falls Dr Unit 1 Palm Desert, CA | 3.0 | 2.0 | 1200 | $2,595 | $2.16 | 13d | 1 | 0.50mi |
| 206 Lakecrest Ln Palm Desert, CA | 2.0 | 2.0 | 1138 | $2,300 | $2.02 | 13d | 1 | 0.51mi |
| 289 Castellana N Palm Desert, CA | 2.0 | 2.0 | 1457 | $3,000 | $2.06 | 26d | 1 | 0.51mi |
| 352 S Sierra Madre Palm Desert, CA | 2.0 | 2.0 | 1584 | $5,800 | $3.66 | 46d | 1 | 0.52mi |
| 153 Camino Arroyo N Palm Desert, CA | 3.0 | 2.0 | 1980 | $7,300 | $3.69 | 22d | 1 | 0.56mi |
| 365 San Remo St Palm Desert, CA | 2.0 | 2.0 | 1303 | $5,500 | $4.22 | 46d | 1 | 0.57mi |
| 363 San Remo St Palm Desert, CA | 2.0 | 2.0 | 1656 | $7,500 | $4.53 | 46d | 1 | 0.57mi |
| 85 Conejo Cir Palm Desert, CA | 3.0 | 3.0 | 2119 | $6,000 | $2.83 | 46d | 1 | 0.58mi |
| 82 Conejo Cir Palm Desert, CA | 3.0 | 2.0 | 1759 | $6,500 | $3.70 | 46d | 1 | 0.59mi |
| 359 Villena Way Palm Desert, CA | 2.0 | 2.0 | 2208 | $9,500 | $4.30 | 46d | 1 | 0.59mi |
| 150 Willow Lake Dr Palm Desert, CA | 2.0 | 2.0 | 1138 | $2,500 | $2.20 | 46d | 1 | 0.60mi |
| 25 Maximo Way Palm Desert, CA | 3.0 | 3.0 | 2056 | $7,800 | $3.79 | 46d | 1 | 0.61mi |
| 316 S Sierra Madre Palm Desert, CA | 2.0 | 2.0 | 1656 | $5,700 | $3.44 | 46d | 1 | 0.63mi |
| 166 Wimbledon Ct Palm Desert, CA | 2.0 | 2.0 | 1250 | $3,200 | $2.56 | 46d | 1 | 0.63mi |
| 191 Winterhaven Cir Palm Desert, CA | 2.0 | 1.5 | 1250 | $2,800 | $2.24 | 46d | 1 | 0.65mi |
| 259 Calle del Verano Palm Desert, CA | 2.0 | 2.0 | 1303 | $5,200 | $3.99 | 46d | 1 | 0.66mi |
| 337 Villena Way Palm Desert, CA | 2.0 | 2.0 | 1303 | $5,000 | $3.84 | 46d | 1 | 0.66mi |
| 257 Calle del Verano Palm Desert, CA | 2.0 | 2.0 | 1303 | $5,300 | $4.07 | 46d | 1 | 0.66mi |
| 336 Villena Way Palm Desert, CA | 2.0 | 2.0 | 1303 | $5,500 | $4.22 | 46d | 1 | 0.68mi |
| 305 Durango Palm Desert, CA | 2.0 | 2.0 | 1670 | $6,300 | $3.77 | 46d | 1 | 0.68mi |
| 323 San Remo St Palm Desert, CA | 2.0 | 2.0 | 1556 | $8,500 | $5.46 | 46d | 1 | 0.68mi |
| 389 Gran Via Palm Desert, CA | 3.0 | 2.0 | 1670 | $3,750 | $2.25 | 26d | 1 | 0.70mi |
| 311 Villena Way Palm Desert, CA | 2.0 | 2.0 | 1653 | $7,000 | $4.23 | 26d | 1 | 0.71mi |
| 280 Castellana S Palm Desert, CA | 2.0 | 2.0 | 1303 | $6,000 | $4.60 | 46d | 1 | 0.71mi |
| 347 Gran Via Palm Desert, CA | 2.0 | 2.0 | 1303 | $5,500 | $4.22 | 46d | 1 | 0.72mi |
| 345 Gran Via Palm Desert, CA | 2.0 | 2.0 | 1584 | $5,500 | $3.47 | 46d | 1 | 0.72mi |
| 295 Cordoba Way Palm Desert, CA | 2.0 | 2.0 | 1800 | $6,000 | $3.33 | 46d | 1 | 0.72mi |
HOA detail
- Monthly dues
- $455 · $5,460/yr
Listing history 45 events
-
2026-06-21days on market $419,000 Active 26 DOM
-
2026-06-18days on market $419,000 Active 23 DOM
-
2026-06-17days on market $419,000 Active 22 DOM
-
2026-06-16days on market $419,000 Active 21 DOM
-
2026-06-15days on market $419,000 Active 20 DOM
-
2026-06-13days on market $419,000 Active 18 DOM
-
2026-06-09days on market $419,000 Active 14 DOM
-
2026-06-08days on market $419,000 Active 13 DOM
-
2026-06-07days on market $419,000 Active 12 DOM
-
2026-06-04days on market $419,000 Active 9 DOM
-
2026-06-03days on market $419,000 Active 8 DOM
-
2026-06-02days on market $419,000 Active 7 DOM
-
2026-06-01days on market $419,000 Active 6 DOM
-
2026-05-31days on market $419,000 Active 5 DOM
-
2026-05-26$419,000 Active
-
2013-11-02historical
-
2013-09-16price $155,500
-
2013-08-03price $157,900
-
2013-08-02status Active
-
2013-07-23historical Hold
-
2013-07-23status Active
-
2013-07-13historical Hold
-
2013-07-12status Active
-
2013-07-02historical Hold
-
2013-07-02status Active
-
2013-06-22historical Hold
-
2013-06-22status Active
-
2013-06-12historical Hold
-
2013-06-12status Active
-
2013-06-02historical Hold
-
2013-06-02status Active
-
2013-05-23historical Hold
-
2013-05-23status Active
-
2013-05-13historical Hold
-
2013-05-13status Active
-
2013-05-03historical Hold
-
2013-04-28price $159,400
-
2013-01-12$159,900 Active
-
2003-01-10soldstatus $50,000
-
2002-11-23historical
-
2002-11-02$158,000
-
1999-10-22soldstatus $120,000
-
1999-09-17historical
-
1999-09-14$125,000
-
1987-05-29soldstatus $30,000
ⓘ Source: listings_history table (triggers on properties + properties_extension) + one-shot
backfill from property_details.listing_events for pre-trigger history.
Tax reassessment forecast CA · Resets to sale price
- Current annual tax
- $2,748 · $229/mo
- Projected year-2 tax
- $3,184 · $265/mo
- Expected delta
- +$436/yr (+$36/mo · 15.9%)
ⓘ Screening estimate from a state-policy table — verify with the county assessor before closing.
Climate risk First Street
- Flood 1/10 Low FEMA zone X (unshaded) · 0% chance over 30 yrs
- Wildfire 1/10 Low
- Heat 9/10 Extreme 7 d/yr ≥114°F today · 19 d/yr by 30 yrs out
- Wind 1/10 Low
- Air quality 4/10 Moderate 5 unhealthy d/yr today · 6 by 30 yrs out
Nearby sold comps map
Loading sold comps map…
Walkable amenities ~0.75 mi
Loading nearby amenities…
Taxation est. · year 1
- Rental income
- $56,638
- − Mortgage interest
- −$23,471
- − Property taxes
- −$2,748
- − Insurance
- −$2,095
- − Repairs & maintenance
- −$4,531
- − Management
- −$4,531
- − HOA
- −$5,460
- − Depreciation
- −$12,189
- Taxable income
- $1,613
- Est. tax owed @ 24.0%
- −$387
- After-tax cash flow
- $7,686/yr
For passive investors: Depreciation is non-cash, so a rental often shows a tax loss while cash-flowing — sheltering income. Rental losses are passive: they offset passive income freely, and up to $25,000/yr can offset ordinary (W-2) income if you actively participate and your MAGI is under $100k (phasing out to $0 by $150k); unused losses carry forward. On sale, claimed depreciation is recaptured at up to 25%, and gains may owe capital-gains tax (a 1031 exchange can defer both). Figures are a year-1 estimate at your 24.0% rate — not tax advice; consult a CPA.
Schools (NCES district)
- District
- Desert Sands Unified
- NCES district ID
- 0611110
- Math proficiency
- 31% ▼ -4.00%
- Reading proficiency
- 56% ▲ 7.00%
- Median HH income
- $54,957
- Composite
- 37.77/100
- National rank
- #4346
- State rank
- #199 of 517 in CA
Livability — Palm Desert
- Score
- 51/100
- State rank
- #1050
- US rank
- #25164
Category grades
Schools grade is shown separately in the Schools card above.
Census & demographics
- Census place
- Palm Desert, CA
- County
- Riverside County · 2,287,001 people
- City population
- 58,615
- Metro
- Riverside-San Bernardino-Ontario, CA
- Population (ZIP)
- 30,523
- Household income
- $70,091
- Rent vs Own
- Severe rent burden
- 1734.0
Population outlook (Riverside County) Hauer SSP2
- Today (2025)
- 2,664,475 people
- By 2030
- 2,802,692 · +5.2%
- By 2040
- 3,050,904 · +14.5%
- By 2050
- 3,256,783 · +22.2%
- By 2075
- 3,655,058 · +37.2%
- By 2100
- 3,766,594 · +41.4%
Race, ethnicity, and origin ACS 2023
- Neighborhood character
- Majority White (61%)
- Race & ethnicity
- White 61% Hispanic / Latino 31% Two or more races 20% Asian 4% Black 2%
- Hispanic origin (detail)
- Mexican 25%
- Common ancestry
- Italian 4% Lithuanian 3% Slovak 2%
- Foreign-born
- 18% · Canada, South Korea, Vietnam
- Languages at home
- 73% English-only · Spanish 22% French/Haitian/Cajun 1% Other Indo-European 1%
Political lean MEDSL · Riverside
- 2024 margin
- Toss-up / Even · D 48.0% · R 49.3% · Other 2.6%
- 2008→2024 swing
- -3.6pp toward R · 2008: 2.3pp · 2024: -1.3pp
- All cycles
- 2024: R+1.3 2020: D+8.0 2016: D+4.3 2012: R+0.4 2008: D+2.3
Not yet ingested
- Civics
- —
Market trends
- HPI YoY
- ▼ -364.94%
- Current HPI
- 294.9425
- Rent YoY
- ▲ 1.60%
- Metro
- Riverside-San Bernardino-Ontario, CA
- State GDP YoY
- ▲ 3.21%
- F500 in state
- 116
Industry mix (Fortune 500 HQ in CA)
| Industry | F500 HQs | Revenue |
|---|---|---|
| Technology | 27 | $1,492B |
|
||
| Financial Services | 3 | $174B |
|
||
| Retail | 3 | $44B |
|
||
| Insurance | 3 | $26B |
|
||
| Media / Entertainment | 2 | $115B |
|
||
| Pharmaceuticals / Biotech | 2 | $62B |
|
||
Price history
+1296.7% since first listed31 events — show timeline
- 2026-05-26 Listed $419,000 GPSMLS
- 2013-11-02 Listing Removed — GPSMLS
- 2013-09-16 Price Changed $155,500 GPSMLS
- 2013-08-03 Price Changed $157,900 GPSMLS
- 2013-08-02 Relisted — GPSMLS
- 2013-07-23 Delisted — GPSMLS
- 2013-07-23 Relisted — GPSMLS
- 2013-07-13 Delisted — GPSMLS
- 2013-07-12 Relisted — GPSMLS
- 2013-07-02 Delisted — GPSMLS
- 2013-07-02 Relisted — GPSMLS
- 2013-06-22 Delisted — GPSMLS
- 2013-06-22 Relisted — GPSMLS
- 2013-06-12 Delisted — GPSMLS
- 2013-06-12 Relisted — GPSMLS
- 2013-06-02 Delisted — GPSMLS
- 2013-06-02 Relisted — GPSMLS
- 2013-05-23 Delisted — GPSMLS
- 2013-05-23 Relisted — GPSMLS
- 2013-05-13 Delisted — GPSMLS
- 2013-05-13 Relisted — GPSMLS
- 2013-05-03 Delisted — GPSMLS
- 2013-04-28 Price Changed $159,400 GPSMLS
- 2013-01-12 Listed $159,900 GPSMLS
- 2003-01-10 Sold (Public Records) $50,000 Public Records
- 2002-11-23 Listing Removed — GPSMLS
- 2002-11-02 Listed $158,000 GPSMLS
- 1999-10-22 Sold (Public Records) $120,000 Public Records
- 1999-09-17 Listing Removed — GPSMLS
- 1999-09-14 Listed $125,000 GPSMLS
- 1987-05-29 Sold (Public Records) $30,000 Public Records
Property tax history
+2.6%/yrLatest (2025): $2,748 · +3.8% YoY. Source: county tax records.
Cash-flow waterfall
monthlySold comps — $/sqft
last 12 mo · ≤1 miLoading sold comps…