 🏗️ New Construction
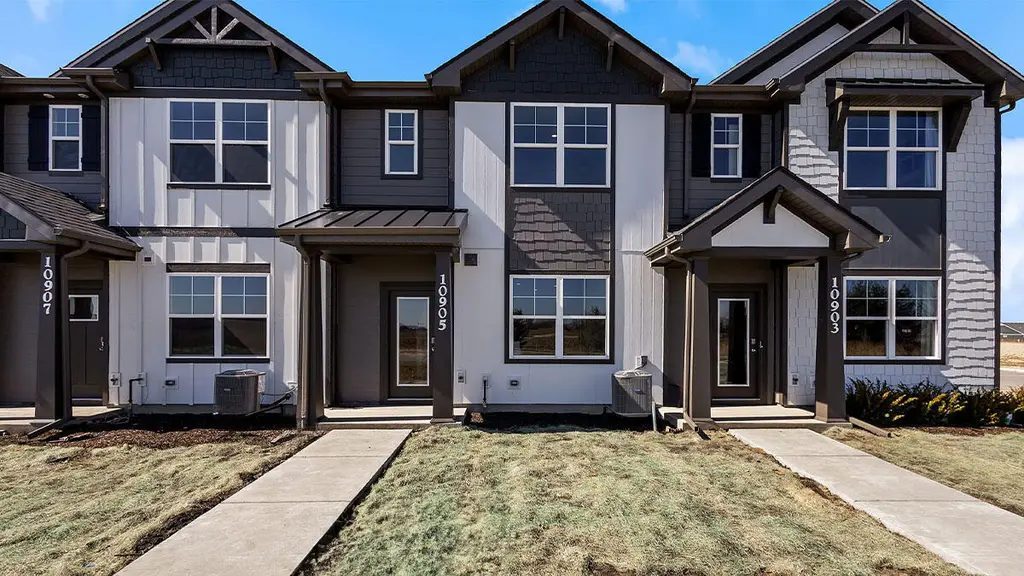
9025 Remington Way · St. John, IN
Flood risk 1/10 · Minimal
- FEMA flood zone
- X (unshaded)
- Chance of flooding over 30 yrs
- 0.0%
- Est. flood insurance / yr
- $507 – $1,088
Fire risk 1/10 · Minimal
- Est. fire insurance / yr
- $717 – $1,331
Heat risk 3/10 · Minor
- Hot days now (above 101°F)
- 7 days/yr
- Hot days in 30 yrs
- 16 days/yr
Wind risk 2/10 · Minimal
- Chance of severe wind over 30 yrs
- 1.0%
Air-quality risk 2/10 · Minimal
- Unhealthy air days now
- 1 days/yr
- Unhealthy air days in 30 yrs
- 1 days/yr
Risk factors via First Street. Map © Google.
Why this score? — see what drove the F grade
The composite is a weighted blend of 9 inputs, each scored 0–100. Each bar is that input's sub-score; the figure is the points it added to the 100-point composite (weight × sub-score).
- Cash flow +7.9/30.0
- ARV discount +7.5/15.0
- Schools +4.5/10.0
- Condition / age +4.0/5.0
- 1% rule +3.1/10.0
- Rent growth +2.5/5.0
- Livability +2.5/5.0
- DSCR +2.0/10.0
- Appreciation +0.0/10.0
$289,990
🖨 Deal sheet 📄 Offer letter ✓ Due diligence
Listing remarks MLS
Discover yourself at 9025 Remington Way, St. John, IN, a beautiful new townhome in The Gates of St. John Townhome community. This townhome will be ready for an AUGUST move-in! Homesite includes a fully sodded yard that is maintained throughout the year as well as snow removal in the winter. The Fairfax townhome plan offers over 1,500 square feet of living space with 3 bedrooms plus a loft, 2.5 baths and a 2-car garage. As soon as you step inside you are greeted by an open and airy space featuring 8ft ceilings and loads of natural sunlight. The expansive kitchen is centrally located providing separation between your living and dining room. Additionally, your kitchen features designer white cabinetry, a spacious island with quartz countertops, and pantry. Heading upstairs you will enjoy your large primary bedroom with a walk-in closet and connecting en suite bathroom. The rest of the upper level features a laundry room, secondary bedrooms with a full second bath, and linen closet. Impressive innovative ERV furnace system and a tankless water heater round out the amazing features this home has to offer! All D. R. Horton NW Indiana homes include our America's Smart Home Technology, featuring a smart video doorbell, smart Honeywell thermostat, smart door lock, Deako smart light switches and more. Exterior and interior photos are of similar home and model home. Actual home built may vary.
Key facts
- Spacious island
- En suite bathroom
- Quartz countertops
Tags
Property features AI
Finance
- Other: Living area: 1,543 (builder source); Occupant status: Vacant
- HOA & community: Homeowners association present; Monthly HOA fee of $200; HOA covers grounds maintenance, snow removal, and structure maintenance; Association amenities: Other
Exterior
- Parking: Attached garage; Garage faces rear; Driveway; Garage door opener; 2-car garage
- Security: Smoke detector(s)
- Utilities: Public water; Public sewer; Cable available; Electric service: Other
- Home design: New construction (under construction); Two-story home; Property is attached
- Construction: Built in 2025
- Exterior features: Neighborhood view; Other exterior features
Interior
- Kitchen: Range; Microwave; Dishwasher; Disposal; Pantry
- Bedrooms: Primary bedroom; Bedroom 2; Bedroom 3; Loft
- Flooring: Carpet; Vinyl
- Bathrooms: One full bathroom; One three-quarter bathroom; One half bathroom
- Heating & cooling: Forced air heating (natural gas); Central air conditioning
- Interior features: Double vanity; Walk-in closet(s); Pantry; Open floorplan; Smoke detector(s)
- Laundry & utility: Upper-level laundry room; Washer hookup; Gas dryer hookup
Neighborhood map
What this means for you Summary
Snapshot
- This is a 3-bed/2.5-bath townhouse listed at $290k. Condition is rated good.
Deal economics
- At list price, monthly cash flow is $-370 ($-4k/yr) — negative.
- The deal already cash-flows at list — no discount required.
- To meet the 1% rule (rent ≥ 1% of price), the offer needs to be $280k (3.4% below list).
- Recommended offer: $280k (3.4% below list) — sets the bar for 1% rule.
- Cap rate 5.0% vs local median 3.6% in St. John — top-decile yield for the area; either an underpriced asset or a hidden risk that comps aren't pricing in. Stress-test before assuming the spread holds.
Location & tenants
- Location reads: area grade F — affects rentability + tenant quality, not the cash-flow math above.
- Hanover Community School Corporation (suburban): math 49% / reading 53% proficiency, ranked #38 of 301 in IN (top 13%) — acceptable for families but not a draw, mixed tenant base, ~2y average lease; only 20% free/reduced lunch — higher-income household profile.
- Market conditions: 260 active listings in the ZIP; 5 comparable units currently listed for rent nearby; rentals lingering (median 44d on market — plan ~5-8 weeks vacancy on turnover, expect pricing pressure); 60% of comp listings sitting > 30 days — soft ceiling on asking rent; 1,642 units permitted in Lake County in 2024 (14 in 5+ unit buildings).
Forward outlook
- Local home prices are declining (-3.0%/yr); year-one equity from $2k of loan paydown is wiped out by about $10k of value loss. Plan a longer hold.
- Lake County population projected to shrink 7% by 2050 — rents likely to lag national; underwrite the cash flow, not the appreciation.
Negotiation context
- It's been on market 34 days — a 3% lower offer ($281k) is reasonable based on typical stale-listing flexibility.
- 2 sale attempts with the ask held roughly flat each time — persistent listings suggest the price (not the market) is what's stuck; bring a comps-based counter.
Questions for the listing agent
- What do current leases actually rent for vs. the listed asking? Can we see a recent rent roll and the last 12 months of T-12 income?
- It's been on market 34 days. Have you received any prior offers? Is the seller open to a 3% concession, seller financing, or rate buy-down credit?
- What does the HOA fee cover, when was the last increase, and are there any pending special assessments or reserve-fund shortfalls?
- Is there a deadline driving the sale (1031 exchange, divorce, estate, relocation)? That informs how much negotiation room exists.
- The area grade is low — what's the realistic commute time and amenity access for the typical tenant pool here? Any planned neighborhood developments (good or bad) we should know about?
- What's the average days-on-market for RENTAL listings here right now (not sales)? A rising rental-DOM trend means longer vacancies and softer asking-rent achievability than the comps imply.
- What's the recent tenant-quality profile in this submarket — average credit score on applications, eviction rate, late-payment / NSF rate, and stable-employment percentage? A property-management company in the area should have these aggregated.
- How much new for-sale + rental construction is in the pipeline within 1–3 miles? Heavy new supply typically softens prices + rents 12–24 months out; constrained supply supports both.
Investment metrics
- 1% rule
- 0.81% ✗
- Cap rate
- 5.01%
- Cash-on-cash
- -4.60%
- DSCR
- 0.80
- GRM
- 10.3
CMA / ARV
- ARV (median comp)
- $344,782
- List price
- $289,990
- Delta
- -15.89%
- Verdict
- UNDERPRICED
- Comps
- 20 within 1.0 mi
Show comp detail 12 sales within ~0.75 mi
| Address | Dist | Beds/Ba | Sqft | Sold | Price | $/sf | Match |
|---|---|---|---|---|---|---|---|
| 8954 Remington Way | 0.01mi | 3/2.5 | 1,542 (-0%) | 1mo | $293,990 | $191 | 99 |
| 8959 Remington Way | 0.02mi | 3/2.5 | 1,543 (0%) | 0mo | $306,490 | $199 | 99 |
| 8958 Remington Way | 0.03mi | 3/2.5 | 1,542 (-0%) | 0mo | $293,990 | $191 | 98 |
| 8952 Remington Way | 0.04mi | 3/2.5 | 1,542 (-0%) | 1mo | $303,990 | $197 | 98 |
| 10907 Remington Pl | 0.03mi | 3/2.5 | 1,542 (-0%) | 2mo | $288,990 | $187 | 97 |
| 8956 Remington Way | 0.06mi | 3/2.5 | 1,543 (0%) | 2mo | $290,165 | $188 | 95 |
| 10915 Remington Pl | 0.06mi | 3/2.5 | 1,542 (-0%) | 4mo | $289,990 | $188 | 94 |
| 9346 W 107th Ln | 0.42mi | 2/2.0 (-1) | 1,550 (+0%) | 0mo | $325,000 | $210 | 72 |
| 8737 Clover Ln | 0.29mi | 3/2.5 | 1,756 (+14%) | 1mo | $309,000 | $176 | 63 |
| 8746 Clover Ln | 0.29mi | 3/2.0 | 1,756 (+14%) | 5mo | $322,340 | $184 | 57 |
| 8690 Larkspur Ln | 0.37mi | 3/2.5 | 1,751 (+14%) | 4mo | $307,000 | $175 | 57 |
| 8700 Larkspur Ln | 0.36mi | 3/2.5 | 1,758 (+14%) | 7mo | $315,000 | $179 | 54 |
Match score weights: distance 35% · size 25% · config 20% · recency 20%. Top-matched comps best support the ARV.
Projected returns pro-forma
-3.0% appreciation · 3.0% rent growth · sell at horizon
- IRR
- -24.0%
- Equity multiple
- 0.18×
- Total profit
- $-79,250
- Equity at exit
- $51,408
- IRR
- -19.0%
- Equity multiple
- -0.02×
- Total profit
- $-98,658
- Equity at exit
- $29,810
Cash invested: $96,539 (down + closing). Projections, not guarantees.
Landlord ↔ Tenant lean methodology
- Overall (STATE)
- 90 Strongly Landlord-Friendly
- State Indiana
- 90 Strongly Landlord-Friendly · R+11
- County
- — inherits STATE
- City
- — inherits STATE
ZIP-level market 46373
- Home prices YoY
- -23.8%
- Active inventory
- 260
- Price-to-rent
- 8.6×
Monthly cashflow live
- Estimated rent
- $2,801 high interval (Pro) →
- Mortgage (P&I)
- −$1,808
- Tax est. 1.5%
- −$431 /mo · $5,172/yr
- Insurance
- −$144
- HOA
- −$200
- Vacancy / Maint / Mgmt
- −$588
- Net cashflow
- $-370
Break-even live
UW: 25.0% down · 7.5% · 30yr · 1.5% tax · 5.0% vac · 8.0% maint · 8.0% mgmt
Financing live
Cash to close
- Down payment
- $86,195
- Closing costs
- $10,343
- Reserves months
- —
- Total cash needed
- —
Loan-product check · same deal, 3 products live
Conventional
25% down · 7.5% · 30yr
- Down + closing
- —
- Monthly P&I
- —
- Monthly cashflow
- —
- DSCR
- —
- Eligible?
- —
Personal DTI + credit; lowest rate.
DSCR
20% down · 8.5% · 30yr
- Down + closing
- —
- Monthly P&I
- —
- Monthly cashflow
- —
- DSCR
- —
- Eligible?
- —
No personal income docs; deal must DSCR.
Hard money
10% down · 12.0% · 12mo
- Down + closing
- —
- Monthly P&I
- —
- Monthly cashflow
- —
- DSCR
- —
- Eligible?
- —
Short-term bridge; refi at stabilization.
Rent comps 5 comps
| Address | Beds | Baths | Sqft | Rent | $/sqft | DOM | Units | Dist |
|---|---|---|---|---|---|---|---|---|
| 8769 W 108th Ln Saint John, IN | 3.0 | 2.5 | 1758 | $2,775 | $1.58 | 43d | 1 | 0.28mi |
| 8754 Clover Ln Saint John, IN | 3.0 | 2.5 | 1756 | $2,675 | $1.52 | 43d | 1 | 0.31mi |
| 8726 Orchid Dr Saint John, IN | 3.0 | 2.5 | 1756 | $2,725 | $1.55 | 43d | 1 | 0.35mi |
| 8688 Larkspur Ln Saint John, IN | 3.0 | 2.5 | 1758 | $3,000 | $1.71 | 1d | 1 | 0.40mi |
| 10342 Adler Cv Saint John, IN | 3.0 | 2.0 | 1944 | $3,000 | $1.54 | 1d | 1 | 0.83mi |
HOA detail
- Monthly dues
- $200 · $2,400/yr
- Likely covers
- watersnow removal
Listing history 15 events
-
2026-06-18days on market $289,990 Active 34 DOM
-
2026-06-17days on market $289,990 Active 33 DOM
-
2026-06-16days on market $289,990 Active 32 DOM
-
2026-06-15days on market $289,990 Active 31 DOM
-
2026-06-13pricedays on market $289,990 Active 29 DOM
-
2026-06-09days on market $299,990 Active 25 DOM
-
2026-06-08days on market $299,990 Active 24 DOM
-
2026-06-07days on market $299,990 Active 23 DOM
-
2026-06-04days on market $299,990 Active 20 DOM
-
2026-06-03days on market $299,990 Active 19 DOM
-
2026-06-02days on market $299,990 Active 18 DOM
-
2026-06-01days on market $299,990 Active 17 DOM
-
2026-05-31days on market $299,990 Active 16 DOM
-
2026-05-15$299,990 Active 1487-char remark
-
2026-05-12$299,990 Active 1406-char remark
Show marketing remark (1406 chars)
Discover yourself at 9025 Remington Way, St. John, IN, a beautiful new townhome in The Gates of St. John Townhome community. This townhome will be ready for an AUGUST move-in! Homesite includes a fully sodded yard that is maintained throughout the year as well as snow removal in the winter. The Fairfax townhome plan offers over 1,500 square feet of living space with 3 bedrooms plus a loft, 2.5 baths and a 2-car garage. As soon as you step inside you are greeted by an open and airy space featuring 8ft ceilings and loads of natural sunlight. The expansive kitchen is centrally located providing separation between your living and dining room. Additionally, your kitchen features designer white cabinetry, a spacious island with quartz countertops, and pantry. Heading upstairs you will enjoy your large primary bedroom with a walk-in closet and connecting en suite bathroom. The rest of the upper level features a laundry room, secondary bedrooms with a full second bath, and linen closet. Impressive innovative ERV furnace system and a tankless water heater round out the amazing features this home has to offer! All D. R. Horton NW Indiana homes include our America's Smart Home Technology, featuring a smart video doorbell, smart Honeywell thermostat, smart door lock, Deako smart light switches and more. Exterior and interior photos are of similar home and model home. Actual home built may vary.
ⓘ Source: listings_history table (triggers on properties + properties_extension) + one-shot
backfill from property_details.listing_events for pre-trigger history.
Climate risk First Street
- Flood 1/10 Low FEMA zone X (unshaded) · 0% chance over 30 yrs
- Wildfire 1/10 Low
- Heat 3/10 Moderate 7 d/yr ≥101°F today · 16 d/yr by 30 yrs out
- Wind 2/10 Low 100% chance of damaging wind over 30 yrs
- Air quality 2/10 Low 1 unhealthy d/yr today · 1 by 30 yrs out
Nearby sold comps map
Loading sold comps map…
Walkable amenities ~0.75 mi
Loading nearby amenities…
Taxation est. · year 1
- Rental income
- $33,615
- − Mortgage interest
- −$19,313
- − Property taxes
- −$5,172
- − Insurance
- −$1,724
- − Repairs & maintenance
- −$2,689
- − Management
- −$2,689
- − HOA
- −$2,400
- − Depreciation
- −$10,030
- Taxable loss
- −$10,402
- Est. tax savings @ 24.0%
- +$2,496
- After-tax cash flow
- $-1,940/yr
For passive investors: Depreciation is non-cash, so a rental often shows a tax loss while cash-flowing — sheltering income. Rental losses are passive: they offset passive income freely, and up to $25,000/yr can offset ordinary (W-2) income if you actively participate and your MAGI is under $100k (phasing out to $0 by $150k); unused losses carry forward. On sale, claimed depreciation is recaptured at up to 25%, and gains may owe capital-gains tax (a 1031 exchange can defer both). Figures are a year-1 estimate at your 24.0% rate — not tax advice; consult a CPA.
Condition & rehab AI · 23 photos
This townhome is in good condition with a fresh paint job and modern finishes. It is move-in ready and would benefit from a fresh coat of exterior paint and new carpet in the bedrooms to further enhance its appeal.
Value-add opportunities
- Resale Paint the exterior walls — Fresh paint can enhance the curb appeal and make the home look more inviting.
- Rental Replace the carpet in the bedrooms — Replacing old carpet with a more modern option can attract renters and increase rental value.
Renovation cost estimate screening
Value-add ROI direction
- Resale Paint the exterior walls — Fresh paint can enhance the curb appeal and make the home look more inviting. ↑
- Rental Replace the carpet in the bedrooms — Replacing old carpet with a more modern option can attract renters and increase rental value. ↑
ⓘ Cost ranges are severity-bucket heuristics (US national rule-of-thumb). Get contractor quotes + a written scope before underwriting a rehab budget.
Schools (NCES district)
- District
- Hanover Community School Corporation
- NCES district ID
- 1804350
- Math proficiency
- 49% ▼ -11.00%
- Reading proficiency
- 53% ▼ -7.00%
- Median HH income
- $68,151
- Composite
- 45.34/100
- National rank
- #2637
- State rank
- #38 of 301 in IN
Livability — St. John
No livability data for this city. (Only ~50 U.S. cities are tracked.)
Census & demographics
- Census place
- St. John, IN
- City population
- 18,509
- Population (ZIP)
- 18,509
Population outlook (Lake County) Hauer SSP2
- Today (2025)
- 484,026 people
- By 2030
- 478,091 · -1.2%
- By 2040
- 462,974 · -4.3%
- By 2050
- 449,894 · -7.1%
- By 2075
- 436,169 · -9.9%
- By 2100
- 426,607 · -11.9%
Race, ethnicity, and origin ACS 2023
- Neighborhood character
- Predominantly White (82%)
- Race & ethnicity
- White 82% Hispanic / Latino 9% Two or more races 5% Black 3% Asian 2%
- Hispanic origin (detail)
- Mexican 7% Puerto Rican 1%
- Common ancestry
- Romanian 21% Iranian 6% Lithuanian 2%
- Foreign-born
- 6% · Canada
- Languages at home
- 89% English-only · Spanish 5% Russian/Polish/Slavic 4% Other Indo-European 1%
Political lean MEDSL · Lake
- 2024 margin
- Lean D (+5.6) · D 52.1% · R 46.5% · Other 1.5%
- 2008→2024 swing
- -28.6pp toward R · 2008: 34.3pp · 2024: 5.6pp
- All cycles
- 2024: D+5.6 2020: D+15.1 2016: D+20.6 2012: D+31.0 2008: D+34.3
Not yet ingested
- Civics
- —
Market trends
- HPI YoY
- ▼ -69.86%
- Current HPI
- 224.1176
- Rent YoY
- —
- Metro
- —
- State GDP YoY
- ▲ 2.90%
- F500 in state
- 18
Industry mix (Fortune 500 HQ in IN)
| Industry | F500 HQs | Revenue |
|---|---|---|
| Industrial Machinery | 2 | $37B |
|
||
| Healthcare | 1 | $177B |
|
||
| Pharmaceuticals | 1 | $45B |
|
||
| Metals / Steel | 1 | $18B |
|
||
| Agriculture | 1 | $17B |
|
||
| Packaging | 1 | $12B |
|
||
Price history
-3.3% since first listed6 events — show timeline
- 2026-06-12 Price Changed $289,990 NIRA MLS as Distributed by MLS Grid
- 2026-06-12 Price Changed $289,990 Zillow
- 2026-06-11 Price Changed $294,990 NIRA MLS as Distributed by MLS Grid
- 2026-06-11 Price Changed $294,990 Zillow
- 2026-05-15 Listed $299,990 NIRA MLS as Distributed by MLS Grid
- 2026-05-12 Listed $299,990 Zillow
Cash-flow waterfall
monthlySold comps — $/sqft
last 12 mo · ≤1 miLoading sold comps…