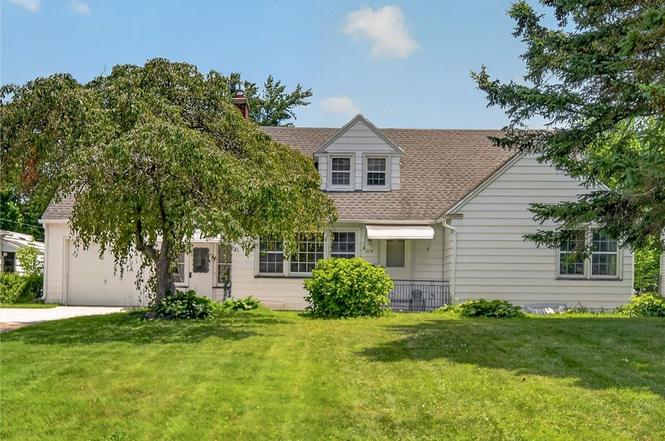
319 Windsor Rd · Rochester, NY
Flood risk 1/10 · Minimal
- FEMA flood zone
- X (unshaded)
- Chance of flooding over 30 yrs
- 0.0%
- Est. flood insurance / yr
- $473 – $860
Fire risk 1/10 · Minimal
- Est. fire insurance / yr
- $691 – $1,283
Heat risk 2/10 · Minimal
- Hot days now (above 95°F)
- 7 days/yr
- Hot days in 30 yrs
- 16 days/yr
Wind risk 1/10 · Minimal
- Chance of severe wind over 30 yrs
- 0.0%
Air-quality risk 2/10 · Minimal
- Unhealthy air days now
- 1 days/yr
- Unhealthy air days in 30 yrs
- 2 days/yr
Risk factors via First Street. Map © Google.
Why this score? — see what drove the D+ grade
The composite is a weighted blend of 9 inputs, each scored 0–100. Each bar is that input's sub-score; the figure is the points it added to the 100-point composite (weight × sub-score).
- ARV discount +15.0/15.0
- Cash flow +12.4/30.0
- 1% rule +4.7/10.0
- Rent growth +3.8/5.0
- Livability +3.8/5.0
- DSCR +3.7/10.0
- Schools +3.2/10.0
- Condition / age +2.5/5.0
- Appreciation +0.0/10.0
$219,900
🖨 Deal sheet 📄 Offer letter ✓ Due diligence
Listing remarks MLS
Character abounds with this lovingly cared-for, one family owned 4 bedroom home! Pull up and notice the WONDERFUL curb appeal. Enter through the enclosed breezeway into in eat-in kitchen. GORGEOUS hardwood floors in the livingroom that continue into the two large bedrooms on the first floor. Cozy up to the gas fireplace on those cold nights. A full bath completes the first floor. Heading upstairs, you will find two more bedrooms, a full bath and an unfinished space above the garage that has limitless possibilities! Plenty of storage in the full basement. Roof, Windows & Hot Water Tank 2012, Furnace & Central AC 2008. Everdri system in the basement! Large backyard! All you have to do is move right in and make it your own. Delayed negotiations Monday, 10/4 at 6 PM. This is an amazing opportunity. Welcome HOME!
Key facts
- Hot water tank
- New furnace
- Large yard
Tags
Property features AI
Exterior
- Parking: Attached garage (1 car)
- Utilities: Electricity connected (circuit breakers); Public water connected; Sewer connected
- Home design: Single-story home; Resale property
- Construction: Aluminum siding; Copper plumbing; Asphalt shingle roof; Block foundation; Existing (previously built) structure
- Exterior features: Concrete driveway; Enclosed porch; Porch; Rectangular residential lot; City street frontage; Lot dimensions approximately 75 x 175
Interior
- Kitchen: Electric cooktop; Electric oven; Electric range; Disposal; Refrigerator
- Bedrooms: 2 main-level bedrooms
- Flooring: Hardwood; Vinyl; Varies
- Bathrooms: 2 full bathrooms; 1 half bathroom; 2 main-level bathrooms
- Heating & cooling: Gas forced-air heating; Central air conditioning
- Interior features: Eat-in kitchen; Separate/formal living room; Bedroom on main level; Main level primary; Full basement with sump pump; One fireplace
- Laundry & utility: Washer and dryer in basement; Electric water heater
Neighborhood map
What this means for you Summary
Snapshot
- This is a 4-bed/2.5-bath single-family listed at $220k.
Deal economics
- At list price, monthly cash flow is $-34 ($-411/yr) — negative.
- To cash-flow at today's rent, offer at most $214k (2.8% below list).
- To meet the 1% rule (rent ≥ 1% of price), the offer needs to be $212k (3.4% below list).
- Recommended offer: $212k (3.4% below list) — sets the bar for 1% rule.
- Cap rate 6.1% vs local median 9.3% in Rochester — below-typical yield; the buyer is paying a premium for something (appreciation thesis, condition, location) that the cap rate doesn't capture.
Location & tenants
- Location reads 76/100 on livability (#222 in NY, #3,482 nationally) — a middle-class / working-renter tenant base. Strengths: commute A+, cost of living A+, housing A+; Watch: schools D+, crime F, employment F.
- Greece Central School District (suburban): math 35% / reading 39% proficiency, ranked #544 of 590 in NY (top 92%) — families likely to look elsewhere, expect single-tenant / working-renter base with shorter leases.
- Market conditions: Rents rising fast (+5.4%/yr); 129 active listings in the ZIP; 8 comparable units currently listed for rent nearby; rentals lingering (median 44d on market — plan ~5-8 weeks vacancy on turnover, expect pricing pressure); 62% of comp listings sitting > 30 days — soft ceiling on asking rent; solid renter incomes; 1,169 units permitted in Monroe County in 2024 (591 in 5+ unit buildings).
- This rent runs 31% of the median local income ($83k/yr) — at the standard rent-burdened threshold; future hikes will face affordability resistance.
Forward outlook
- Local home prices are declining (-3.0%/yr); year-one equity from $2k of loan paydown is wiped out by about $7k of value loss. Plan a longer hold.
- Monroe County population projected to shrink 6% by 2050 — rents likely to lag national; underwrite the cash flow, not the appreciation.
Negotiation context
- Only 1 days on market — expect competitive offers; lowballing is unlikely to land.
- 2 sale attempts since 5y ago with the ask held roughly flat each time — persistent listings suggest the price (not the market) is what's stuck; bring a comps-based counter.
- Current owner paid $132k; list at $220k implies a 67% gain — meaningful room to come down on a strong offer.
Risks & watch-outs
- Watch-outs: property tax is 2.6% of price; built in 1950 — expect roof / HVAC / electrical / plumbing capex.
Questions for the listing agent
- What do current leases actually rent for vs. the listed asking? Can we see a recent rent roll and the last 12 months of T-12 income?
- Built in 1950 — when were the roof, HVAC, electrical panel, plumbing, and water heater last replaced?
- Property tax is high relative to price — has the assessment been appealed recently, and will the sale trigger a re-assessment?
- Is there a deadline driving the sale (1031 exchange, divorce, estate, relocation)? That informs how much negotiation room exists.
- Schools are D-rated, which usually means shorter tenancies and higher turnover. Who's the typical renter profile here, and what's been the actual vacancy rate?
- Crime grade is F in this area — have there been break-ins, vandalism, or insurance claims at this property in the last 3 years? What carrier currently insures it and at what premium?
- The area grade is low — what's the realistic commute time and amenity access for the typical tenant pool here? Any planned neighborhood developments (good or bad) we should know about?
- What's the average days-on-market for RENTAL listings here right now (not sales)? A rising rental-DOM trend means longer vacancies and softer asking-rent achievability than the comps imply.
- What's the recent tenant-quality profile in this submarket — average credit score on applications, eviction rate, late-payment / NSF rate, and stable-employment percentage? A property-management company in the area should have these aggregated.
- How much new for-sale + rental construction is in the pipeline within 1–3 miles? Heavy new supply typically softens prices + rents 12–24 months out; constrained supply supports both.
Investment metrics
- 1% rule
- 0.97% ✗
- Cap rate
- 6.11%
- Cash-on-cash
- -0.67%
- DSCR
- 0.97
- GRM
- 8.6
CMA / ARV
- ARV (on-the-fly)
- $265,500
- Comps found
- 12
Show comp detail 12 sales within ~0.75 mi
| Address | Dist | Beds/Ba | Sqft | Sold | Price | $/sf | Match |
|---|---|---|---|---|---|---|---|
| 43 Sandalwood Dr | 0.55mi | 4/2.0 | 1,432 (-4%) | 1mo | $253,000 | $177 | 64 |
| 95 Ripplewood Dr | 0.49mi | 4/2.0 | 1,400 (-7%) | 2mo | $290,000 | $207 | 62 |
| 211 Pebbleview Dr | 0.65mi | 3/1.5 (-1) | 1,496 (-0%) | 1mo | $260,000 | $174 | 60 |
| 126 Marwood Rd | 0.34mi | 4/2.0 | 1,299 (-13%) | 2mo | $270,000 | $208 | 58 |
| 966 Latta Rd | 0.49mi | 3/1.5 (-1) | 1,440 (-4%) | 5mo | $260,000 | $181 | 58 |
| 416 Lake Meadow Dr | 0.67mi | 4/1.5 | 1,480 (-1%) | 7mo | $237,000 | $160 | 57 |
| 497 Hampton Blvd | 0.26mi | 3/1.0 (-1) | 1,296 (-14%) | 7mo | $224,000 | $173 | 48 |
| 1060 Latta Rd | 0.60mi | 4/1.5 | 1,632 (+9%) | 7mo | $267,500 | $164 | 47 |
| 80 Ripplewood Dr | 0.48mi | 3/1.5 (-1) | 1,308 (-13%) | 2mo | $269,000 | $206 | 46 |
| 83 Dohrcrest Dr | 0.39mi | 3/2.0 (-1) | 1,284 (-14%) | 8mo | $225,000 | $175 | 44 |
| 311 Chesterfield Dr | 0.65mi | 4/2.0 | 1,710 (+14%) | 7mo | $250,000 | $146 | 38 |
| 48 Skycrest Dr | 0.61mi | 3/1.5 (-1) | 1,288 (-14%) | 2mo | $265,000 | $206 | 37 |
Match score weights: distance 35% · size 25% · config 20% · recency 20%. Top-matched comps best support the ARV.
Projected returns pro-forma
-3.0% appreciation · 5.37% rent growth · sell at horizon
- IRR
- -14.4%
- Equity multiple
- 0.47×
- Total profit
- $-32,478
- Equity at exit
- $32,788
- IRR
- -1.7%
- Equity multiple
- 0.87×
- Total profit
- $-8,138
- Equity at exit
- $19,013
Cash invested: $61,572 (down + closing). Projections, not guarantees.
Landlord ↔ Tenant lean methodology
- Overall (STATE)
- 15 Strongly Tenant-Friendly
- State New York
- 15 Strongly Tenant-Friendly · D+10
- County
- — inherits STATE
- City
- — inherits STATE
ZIP-level market 14612
- Home prices YoY
- -33.0%
- Rents YoY
- 5.4%
- Active inventory
- 129
- Price-to-rent
- 8.6×
Monthly cashflow live
- Estimated rent
- $2,125 high interval (Pro) →
- Mortgage (P&I)
- −$1,153
- Tax from tax record
- −$468 /mo · $5,615/yr
- Insurance
- −$92
- HOA
- −$0
- Vacancy / Maint / Mgmt
- −$446
- Net cashflow
- $-34
Break-even live
UW: 25.0% down · 7.5% · 30yr · 1.5% tax · 5.0% vac · 8.0% maint · 8.0% mgmt
Financing live
Cash to close
- Down payment
- $54,975
- Closing costs
- $6,597
- Reserves months
- —
- Total cash needed
- —
Loan-product check · same deal, 3 products live
Conventional
25% down · 7.5% · 30yr
- Down + closing
- —
- Monthly P&I
- —
- Monthly cashflow
- —
- DSCR
- —
- Eligible?
- —
Personal DTI + credit; lowest rate.
DSCR
20% down · 8.5% · 30yr
- Down + closing
- —
- Monthly P&I
- —
- Monthly cashflow
- —
- DSCR
- —
- Eligible?
- —
No personal income docs; deal must DSCR.
Hard money
10% down · 12.0% · 12mo
- Down + closing
- —
- Monthly P&I
- —
- Monthly cashflow
- —
- DSCR
- —
- Eligible?
- —
Short-term bridge; refi at stabilization.
Rent comps 8 comps
| Address | Beds | Baths | Sqft | Rent | $/sqft | DOM | Units | Dist |
|---|---|---|---|---|---|---|---|---|
| 4302 Lake Ave Unit 1 Rochester, NY | 3.0 | 1.5 | 1600 | $3,000 | $1.88 | 43d | 1 | 0.77mi |
| 108 Glenbrook Rd Rochester, NY | 3.0 | 1.0 | 1088 | $1,850 | $1.70 | 23d | 1 | 0.81mi |
| 704 Rumson Rd Rochester, NY | 3.0 | 1.0 | 1100 | $1,950 | $1.77 | 3d | 1 | 1.01mi |
| 304 Bakerdale Rd Rochester, NY | 3.0 | 1.0 | 1256 | $1,650 | $1.31 | 44d | 1 | 1.04mi |
| 130 N Park Dr Rochester, NY | 3.0 | 1.5 | 1120 | $2,000 | $1.79 | 43d | 1 | 1.14mi |
| 37 Linda Dr Unit 1 Rochester, NY | 3.0 | 2.0 | 1600 | $2,100 | $1.31 | 43d | 1 | 1.18mi |
| 175 English Rd Rochester, NY | 3.0 | 1.5 | 1194 | $1,975 | $1.65 | 43d | 1 | 1.30mi |
| 37 Oakmount Dr Rochester, NY | 4.0 | 2.0 | 1368 | $2,500 | $1.83 | 14d | 1 | 1.35mi |
Listing history 2 events
-
2026-06-17remarks 693-char remark
-
2026-06-17$219,900 Active 1 DOM
ⓘ Source: listings_history table (triggers on properties + properties_extension) + one-shot
backfill from property_details.listing_events for pre-trigger history.
Tax reassessment forecast NY · Partial reset (capped growth)
- Current annual tax
- $5,615 · $468/mo
- Projected year-2 tax
- $5,615 · $468/mo
- Expected delta
- $0/yr ($0/mo · 0.0%)
ⓘ Screening estimate from a state-policy table — verify with the county assessor before closing.
Climate risk First Street
- Flood 1/10 Low FEMA zone X (unshaded) · 0% chance over 30 yrs
- Wildfire 1/10 Low
- Heat 2/10 Low 7 d/yr ≥95°F today · 16 d/yr by 30 yrs out
- Wind 1/10 Low 0% chance of damaging wind over 30 yrs
- Air quality 2/10 Low 1 unhealthy d/yr today · 2 by 30 yrs out
Nearby sold comps map
Loading sold comps map…
Walkable amenities ~0.75 mi
Loading nearby amenities…
Taxation est. · year 1
- Rental income
- $25,495
- − Mortgage interest
- −$12,318
- − Property taxes
- −$5,615
- − Insurance
- −$1,100
- − Repairs & maintenance
- −$2,040
- − Management
- −$2,040
- − Depreciation
- −$6,397
- Taxable loss
- −$4,013
- Est. tax savings @ 24.0%
- +$963
- After-tax cash flow
- $552/yr
For passive investors: Depreciation is non-cash, so a rental often shows a tax loss while cash-flowing — sheltering income. Rental losses are passive: they offset passive income freely, and up to $25,000/yr can offset ordinary (W-2) income if you actively participate and your MAGI is under $100k (phasing out to $0 by $150k); unused losses carry forward. On sale, claimed depreciation is recaptured at up to 25%, and gains may owe capital-gains tax (a 1031 exchange can defer both). Figures are a year-1 estimate at your 24.0% rate — not tax advice; consult a CPA.
Schools (NCES district)
- District
- Greece Central School District
- NCES district ID
- 3612630
- Math proficiency
- 35% ▼ -14.00%
- Reading proficiency
- 39% ▼ -3.00%
- Median HH income
- $52,718
- Composite
- 32.26/100
- National rank
- #5761
- State rank
- #544 of 590 in NY
Livability — Rochester
- Score
- 76/100
- State rank
- #222
- US rank
- #3482
Category grades
Schools grade is shown separately in the Schools card above.
Census & demographics
- County
- Monroe County · 674,131 people
- City population
- 432,803
- Metro
- Rochester, NY
- Population (ZIP)
- 35,152
- Household income
- $82,800
- Rent vs Own
- Severe rent burden
- 1063.0
Population outlook (Monroe County) Hauer SSP2
- Today (2025)
- 759,460 people
- By 2030
- 757,154 · -0.3%
- By 2040
- 740,644 · -2.5%
- By 2050
- 714,443 · -5.9%
- By 2075
- 645,883 · -15.0%
- By 2100
- 547,084 · -28.0%
Race, ethnicity, and origin ACS 2023
- Neighborhood character
- Predominantly White (78%)
- Race & ethnicity
- White 78% Black 9% Hispanic / Latino 7% Two or more races 6%
- Hispanic origin (detail)
- Puerto Rican 5%
- Common ancestry
- Romanian 4% Lithuanian 3% Slovak 2%
- Foreign-born
- 5% · Canada
- Languages at home
- 93% English-only · Spanish 4% Other Indo-European 1% Russian/Polish/Slavic 1%
Political lean MEDSL · Monroe
- 2024 margin
- D (+19.1) · D 59.5% · R 40.5%
- 2008→2024 swing
- +1.4pp toward D · 2008: 17.7pp · 2024: 19.1pp
- All cycles
- 2024: D+19.1 2020: D+21.0 2016: D+14.1 2012: D+17.4 2008: D+17.7
Not yet ingested
- Civics
- —
Market trends
- HPI YoY
- ▼ -124.89%
- Current HPI
- 254.157
- Rent YoY
- ▲ 5.37%
- Metro
- Rochester, NY
- State GDP YoY
- ▲ 2.60%
- F500 in state
- 92
Industry mix (Fortune 500 HQ in NY)
| Industry | F500 HQs | Revenue |
|---|---|---|
| Financial Services | 10 | $950B |
|
||
| Consumer Goods | 9 | $162B |
|
||
| Insurance | 4 | $225B |
|
||
| Telecommunications | 2 | $144B |
|
||
| Pharmaceuticals | 2 | $112B |
|
||
| Media / Entertainment | 2 | $69B |
|
||
Price history
+100.1% since first listed6 events — show timeline
- 2026-06-17 Listed $219,900 UNYREIS
- 2021-12-06 Sold (MLS) $132,000 UNYREIS
- 2021-11-30 Sold (Public Records) $132,000 Public Records
- 2021-10-05 Pending — UNYREIS
- 2021-10-05 Contingent — UNYREIS
- 2021-09-30 Listed $109,900 UNYREIS
Property tax history
+8.1%/yrLatest (2025): $5,615 · +1.9% YoY. Source: county tax records.
Cash-flow waterfall
monthlySold comps — $/sqft
last 12 mo · ≤1 miLoading sold comps…