922 SE 119th Ave · Micanopy, FL
Flood risk 1/10 · Minimal
- FEMA flood zone
- X (unshaded)
- Chance of flooding over 30 yrs
- 0.0%
- Est. flood insurance / yr
- $507 – $1,088
Fire risk 8/10 · Major
- Est. fire insurance / yr
- $947 – $1,759
Heat risk 8/10 · Major
- Hot days now (above 107°F)
- 7 days/yr
- Hot days in 30 yrs
- 20 days/yr
Wind risk 9/10 · Severe
- Chance of severe wind over 30 yrs
- 99.0%
Air-quality risk 3/10 · Minor
- Unhealthy air days now
- 4 days/yr
- Unhealthy air days in 30 yrs
- 4 days/yr
Risk factors via First Street. Map © Google.
Why this score? — see what drove the B grade
The composite is a weighted blend of 9 inputs, each scored 0–100. Each bar is that input's sub-score; the figure is the points it added to the 100-point composite (weight × sub-score).
- Cash flow +29.2/30.0
- DSCR +10.0/10.0
- 1% rule +9.2/10.0
- ARV discount +7.5/15.0
- Appreciation +4.3/10.0
- Schools +4.3/10.0
- Livability +3.4/5.0
- Rent growth +2.5/5.0
- Condition / age +2.5/5.0
$120,000
🖨 Deal sheet 📄 Offer letter ✓ Due diligence
Listing remarks
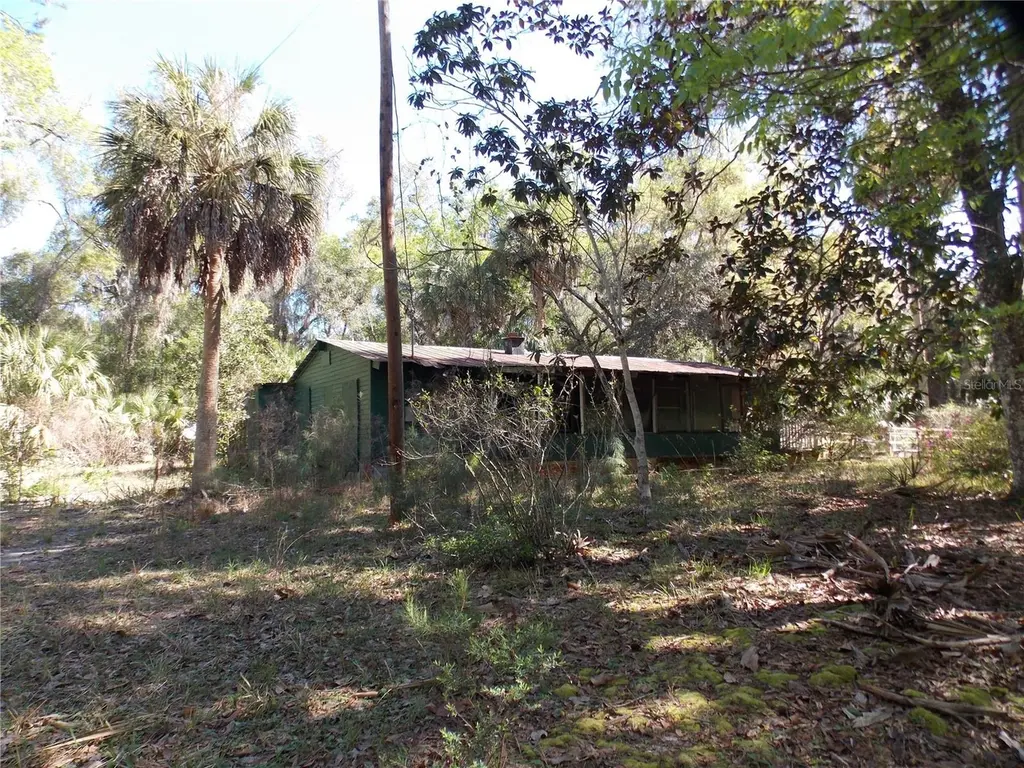
Tucked away on 3 acres in charming Micanopy, this property offers a rare opportunity to create your own private retreat between Gainesville and Ocala. Set well off the road, the homesite is accessed via an easement that leads to a secluded, peaceful setting surrounded by natural beauty. The existing 3-bedroom, 2-bath home provides a starting point for renovation or the chance to build new with utilities already in place. The layout of the land offers flexibility for a custom home, investment project or quiet getaway. Enjoy the tranquility of North Central Florida while remaining conveniently close to both Gainesville and Ocala.
Key facts
- Quiet getaway
- Private retreat
- Secluded setting
Tags
Neighborhood map
What this means for you Summary
Snapshot
- This is a 3-bed/2.0-bath single-family listed at $120k.
Deal economics
- At list price, monthly cash flow is $416 ($5k/yr) — positive.
- The deal already cash-flows at list — no discount required.
- Meets the 1% rule at list price ($2k rent vs $120k).
- Recommended offer: $116k (3.0% below list) — sets the bar for market timing.
Location & tenants
- Location reads 68/100 on livability (#496 in FL) — a middle-class / working-renter tenant base. Strengths: cost of living A+, housing A+; Watch: employment D, health & safety D, amenities F.
- Alachua (urban): math 49% / reading 54% proficiency, ranked #30 of 73 in FL (top 41%) — acceptable for families but not a draw, mixed tenant base, ~2y average lease.
- Market conditions: 68 active listings in the ZIP; 1,774 units permitted in Alachua County in 2024 (984 in 5+ unit buildings).
Forward outlook
- Local home prices are declining (-1.4%/yr); year-one equity from $830 of loan paydown is wiped out by about $2k of value loss. Plan a longer hold.
- Alachua County population projected at +26% by 2050 — long-run rental-demand tailwind backs the buy-and-hold thesis.
- At projected returns (-1.4% appreciation + 3.0% rent growth), your $34k cash investment doubles in ~7 years — after that, you're playing with house money.
Negotiation context
- It's been on market 45 days — a 3% lower offer ($116k) is reasonable based on typical stale-listing flexibility.
- Current owner paid $2k; list at $120k implies a 4700% gain — meaningful room to come down on a strong offer.
Risks & watch-outs
- Watch-outs: property tax is 2.5% of price; built in 1950 — expect roof / HVAC / electrical / plumbing capex.
- Climate carrying-cost: severe wind risk, 99% chance of damaging wind over 30y; severe wildfire risk; extreme-heat days projected 7→20/yr by 2055 (HVAC capex compounding) — expect insurance premiums to compound above CPI over the hold.
Questions for the listing agent
- It's been on market 45 days. Have you received any prior offers? Is the seller open to a 3% concession, seller financing, or rate buy-down credit?
- Built in 1950 — when were the roof, HVAC, electrical panel, plumbing, and water heater last replaced?
- Property tax is high relative to price — has the assessment been appealed recently, and will the sale trigger a re-assessment?
- Is there a deadline driving the sale (1031 exchange, divorce, estate, relocation)? That informs how much negotiation room exists.
- What's the average days-on-market for RENTAL listings here right now (not sales)? A rising rental-DOM trend means longer vacancies and softer asking-rent achievability than the comps imply.
- What's the recent tenant-quality profile in this submarket — average credit score on applications, eviction rate, late-payment / NSF rate, and stable-employment percentage? A property-management company in the area should have these aggregated.
- How much new for-sale + rental construction is in the pipeline within 1–3 miles? Heavy new supply typically softens prices + rents 12–24 months out; constrained supply supports both.
Investment metrics
- 1% rule
- 1.42% ✓
- Cap rate
- 10.46%
- Cash-on-cash
- 14.87%
- DSCR
- 1.66
- GRM
- 5.9
CMA / ARV
No comps found within radius.
Projected returns pro-forma
-1.41% appreciation · 3.0% rent growth · sell at horizon
- IRR
- 10.4%
- Equity multiple
- 1.46×
- Total profit
- $15,381
- Equity at exit
- $26,642
- IRR
- 17.1%
- Equity multiple
- 2.65×
- Total profit
- $55,452
- Equity at exit
- $26,040
Cash invested: $33,600 (down + closing). Projections, not guarantees.
Landlord ↔ Tenant lean methodology
- Overall (STATE)
- 87 Strongly Landlord-Friendly
- State Florida
- 87 Strongly Landlord-Friendly · R+3
- County
- — inherits STATE
- City
- — inherits STATE
ZIP-level market 32667
- Home prices YoY
- -0.5%
- Active inventory
- 68
- Price-to-rent
- 5.9×
Monthly cashflow live
- Estimated rent
- $1,704 medium interval (Pro) →
- Mortgage (P&I)
- −$629
- Tax from tax record
- −$250 /mo · $3,004/yr
- Insurance
- −$50
- HOA
- −$0
- Vacancy / Maint / Mgmt
- −$358
- Net cashflow
- $416
Break-even live
UW: 25.0% down · 7.5% · 30yr · 1.5% tax · 5.0% vac · 8.0% maint · 8.0% mgmt
Financing live
Cash to close
- Down payment
- $30,000
- Closing costs
- $3,600
- Reserves months
- —
- Total cash needed
- —
Loan-product check · same deal, 3 products live
Conventional
25% down · 7.5% · 30yr
- Down + closing
- —
- Monthly P&I
- —
- Monthly cashflow
- —
- DSCR
- —
- Eligible?
- —
Personal DTI + credit; lowest rate.
DSCR
20% down · 8.5% · 30yr
- Down + closing
- —
- Monthly P&I
- —
- Monthly cashflow
- —
- DSCR
- —
- Eligible?
- —
No personal income docs; deal must DSCR.
Hard money
10% down · 12.0% · 12mo
- Down + closing
- —
- Monthly P&I
- —
- Monthly cashflow
- —
- DSCR
- —
- Eligible?
- —
Short-term bridge; refi at stabilization.
Listing history 22 events
-
2026-06-18days on market $120,000 Active 45 DOM
-
2026-06-17days on market $120,000 Active 44 DOM
-
2026-06-16days on market $120,000 Active 43 DOM
-
2026-06-15days on market $120,000 Active 42 DOM
-
2026-06-14days on market $120,000 Active 40 DOM
-
2026-06-13days on market $120,000 Active 39 DOM
-
2026-06-10days on market $120,000 Active 37 DOM
-
2026-06-09days on market $120,000 Active 36 DOM
-
2026-06-08days on market $120,000 Active 35 DOM
-
2026-06-07days on market $120,000 Active 34 DOM
-
2026-06-05days on market $120,000 Active 31 DOM
-
2026-06-03days on market $120,000 Active 30 DOM
-
2026-06-02days on market $120,000 Active 29 DOM
-
2026-06-01days on market $120,000 Active 28 DOM
-
2026-05-31days on market $120,000 Active 27 DOM
-
2026-05-30days on market $120,000 Active 26 DOM
-
2026-04-08status Pending
-
2026-03-17$120,000 Active
-
1997-07-28soldstatus $2,500
-
1992-01-03soldstatus $25,000
-
1990-08-31soldstatus $20,000
-
1990-07-20soldstatus $28,200
ⓘ Source: listings_history table (triggers on properties + properties_extension) + one-shot
backfill from property_details.listing_events for pre-trigger history.
Tax reassessment forecast FL · Resets to sale price
- Current annual tax
- $3,004 · $250/mo
- Projected year-2 tax
- $3,004 · $250/mo
- Expected delta
- $0/yr ($0/mo · 0.0%)
ⓘ Screening estimate from a state-policy table — verify with the county assessor before closing.
Climate risk First Street
- Flood 1/10 Low FEMA zone X (unshaded) · 0% chance over 30 yrs
- Wildfire 8/10 Severe
- Heat 8/10 Severe 7 d/yr ≥107°F today · 20 d/yr by 30 yrs out
- Wind 9/10 Extreme 99% chance of damaging wind over 30 yrs
- Air quality 3/10 Moderate 4 unhealthy d/yr today · 4 by 30 yrs out
Nearby sold comps map
Loading sold comps map…
Walkable amenities ~0.75 mi
Loading nearby amenities…
Taxation est. · year 1
- Rental income
- $20,444
- − Mortgage interest
- −$6,722
- − Property taxes
- −$3,004
- − Insurance
- −$600
- − Repairs & maintenance
- −$1,636
- − Management
- −$1,636
- − Depreciation
- −$3,491
- Taxable income
- $3,356
- Est. tax owed @ 24.0%
- −$806
- After-tax cash flow
- $4,190/yr
For passive investors: Depreciation is non-cash, so a rental often shows a tax loss while cash-flowing — sheltering income. Rental losses are passive: they offset passive income freely, and up to $25,000/yr can offset ordinary (W-2) income if you actively participate and your MAGI is under $100k (phasing out to $0 by $150k); unused losses carry forward. On sale, claimed depreciation is recaptured at up to 25%, and gains may owe capital-gains tax (a 1031 exchange can defer both). Figures are a year-1 estimate at your 24.0% rate — not tax advice; consult a CPA.
Schools (NCES district)
- District
- Alachua
- NCES district ID
- 1200030
- Math proficiency
- 49% ▼ -9.00%
- Reading proficiency
- 54% ▼ -3.00%
- Median HH income
- $42,683
- Composite
- 43.31/100
- National rank
- #3038
- State rank
- #30 of 73 in FL
Livability — Micanopy
- Score
- 68/100
- State rank
- #496
- US rank
- #9082
Category grades
Schools grade is shown separately in the Schools card above.
Census & demographics
- Population (ZIP)
- 3,761
Population outlook (Alachua County) Hauer SSP2
- Today (2025)
- 289,834 people
- By 2030
- 305,873 · +5.5%
- By 2040
- 335,246 · +15.7%
- By 2050
- 364,719 · +25.8%
- By 2075
- 436,665 · +50.7%
- By 2100
- 482,920 · +66.6%
Race, ethnicity, and origin ACS 2023
- Neighborhood character
- Predominantly White (80%)
- Race & ethnicity
- White 80% Black 13% Two or more races 4% Hispanic / Latino 2%
- Common ancestry
- Italian 2% Slovak 2% Lithuanian 1%
- Foreign-born
- 3% · Canada
- Languages at home
- 97% English-only · Spanish 1% German/W. Germanic 1% Tagalog/Filipino 1%
Political lean MEDSL · Alachua
- 2024 margin
- Strong D (+21.0) · D 59.7% · R 38.8% · Other 1.5%
- 2008→2024 swing
- -0.6pp no change · 2008: 21.6pp · 2024: 21.0pp
- All cycles
- 2024: D+21.0 2020: D+27.2 2016: D+22.5 2012: D+17.3 2008: D+21.6
Not yet ingested
- Civics
- —
Market trends
- HPI YoY
- ▼ -1.41%
- Current HPI
- 314.4466
- Rent YoY
- —
- Metro
- —
- State GDP YoY
- ▲ 3.28%
- F500 in state
- 36
Industry mix (Fortune 500 HQ in FL)
| Industry | F500 HQs | Revenue |
|---|---|---|
| Industrial Technology | 2 | $29B |
|
||
| Insurance | 2 | $17B |
|
||
| Retail | 1 | $60B |
|
||
| Technology Distribution | 1 | $58B |
|
||
| Homebuilding | 1 | $35B |
|
||
| Technology Manufacturing | 1 | $35B |
|
||
Price history
+325.5% since first listed6 events — show timeline
- 2026-04-08 Pending — Stellar MLS as Distributed by MLS Grid
- 2026-03-17 Listed $120,000 Stellar MLS as Distributed by MLS Grid
- 1997-07-28 Sold (Public Records) $2,500 Public Records
- 1992-01-03 Sold (Public Records) $25,000 Public Records
- 1990-08-31 Sold (Public Records) $20,000 Public Records
- 1990-07-20 Sold (Public Records) $28,200 Public Records
Property tax history
+25.5%/yrLatest (2025): $3,004 · +5.8% YoY. Source: county tax records.
Cash-flow waterfall
monthlySold comps — $/sqft
last 12 mo · ≤1 miLoading sold comps…