3604 Pershing Ln · Waukee, IA
Flood risk No data
- FEMA flood zone
- —
- Chance of flooding over 30 yrs
- —
- Est. flood insurance / yr
- —
Fire risk No data
- Est. fire insurance / yr
- —
Heat risk No data
- Hot days now (above threshold)
- —
- Hot days in 30 yrs
- —
Wind risk No data
- Chance of severe wind over 30 yrs
- —
Air-quality risk No data
- Unhealthy air days now
- —
- Unhealthy air days in 30 yrs
- —
Risk factors via First Street. Map © Google.
Why this score? — see what drove the D grade
The composite is a weighted blend of 9 inputs, each scored 0–100. Each bar is that input's sub-score; the figure is the points it added to the 100-point composite (weight × sub-score).
- Cash flow +9.7/30.0
- ARV discount +7.5/15.0
- Schools +7.1/10.0
- Livability +4.2/5.0
- 1% rule +3.9/10.0
- Rent growth +3.0/5.0
- DSCR +2.7/10.0
- Condition / age +2.5/5.0
- Appreciation +0.0/10.0
$254,990
🖨 Deal sheet (PDF) 📄 Offer letter ✓ Due diligence
Listing remarks
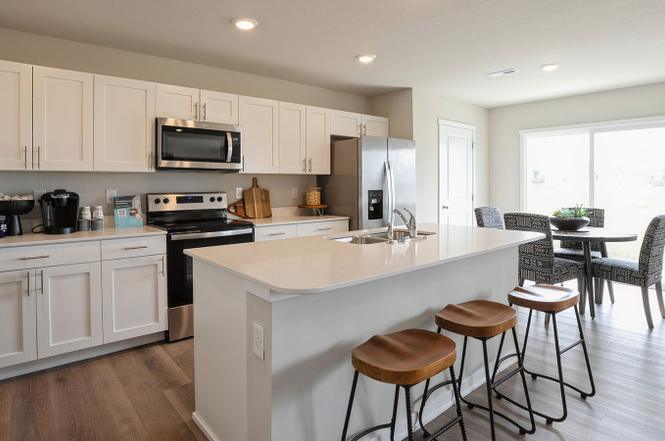
* MOVE IN READY * Welcome to the Sydney, a two-story townhome in Painted Woods West Townhomes - offering 3 bedrooms, 2.5 bathrooms, and 1,511 sq. ft. of thoughtfully designed space with appliances included. Step through the foyer into a bright, open-concept main level that flows seamlessly from the kitchen to the dining and great room, complete with a cozy electric fireplace. The kitchen shines with white cabinetry, stainless steel appliances, and a large island perfect for cooking and entertaining. Upstairs, the primary suite features a walk-in closet and en-suite with dual vanities and a walk-in shower. Two additional bedrooms with large closets, a full bathroom, and an upstairs laundry
Key facts
- Easy access to i-80
- Great room
- Cozy fireplace
Tags
Property features AI
Finance
- HOA & community: Homeowners association (Painted Woods West TH HOA) with monthly fee; Association managed by Edge Property Management; HOA covers grounds and structure maintenance, snow removal, and trash; Monthly association fee is $195
Exterior
- Parking: Attached two-car garage
- Utilities: Public water; Public sewer
- Home design: Two-story; New construction; Built by DR Horton; Home warranty included
- Construction: Vinyl siding; Asphalt shingle roof; Poured slab foundation
- Exterior features: Concrete road access
Interior
- Kitchen: Dishwasher; Microwave; Refrigerator; Stove
- Bathrooms: One full bathroom; One three-quarter bathroom; One half bathroom
- Heating & cooling: Heat pump heating; Electric heating; Central air conditioning
- Interior features: Dining area; Eat-in kitchen; Electric fireplace
- Laundry & utility: Washer; Dryer
Neighborhood map
What this means for you Summary
Snapshot
- This is a 3-bed/2.5-bath other listed at $255k.
Deal economics
- At list price, monthly cash flow is $-168 ($-2k/yr) — negative.
- To cash-flow at today's rent, offer at most $231k (9.5% below list).
- To meet the 1% rule (rent ≥ 1% of price), the offer needs to be $227k (11.2% below list).
- Recommended offer: $224k (12.0% below list) — sets the bar for market timing.
- Cap rate 5.5% vs local median 3.0% in Waukee — top-decile yield for the area; either an underpriced asset or a hidden risk that comps aren't pricing in. Stress-test before assuming the spread holds.
Location & tenants
- Location reads 84/100 on livability (#22 in IA, #682 nationally) — a professional / high-income tenant draw. Strengths: crime A+, employment A+, housing A+; Watch: amenities F, commute F.
- Waukee Community School District (suburban): math 80% / reading 79% proficiency, ranked #14 of 289 in IA (top 5%) — strong family-tenant draw, lease renewals of 3-5y typical; only 11% free/reduced lunch — higher-income household profile.
- Zoned schools: Waukee Elementary School (math 86% / reading 77%, grade A+, #60 of 616 statewide, top 10%, 682 students, 20% FRL); Waukee Middle School (math 83% / reading 81%, grade A+, #22 of 246 statewide, top 12%, 1,069 students, 12% FRL); Waukee High School (math 74% / reading 82%, grade A-, #53 of 336 statewide, top 16%, 1,268 students, 24% FRL).
- Market conditions: Rents rising (+1.8%/yr); 891 active listings in the ZIP; 3 comparable units currently listed for rent nearby; rentals lingering (median 46d on market — plan ~5-8 weeks vacancy on turnover, expect pricing pressure); 67% of comp listings sitting > 30 days — soft ceiling on asking rent; solid renter incomes; 1,503 units permitted in Dallas County in 2024 (630 in 5+ unit buildings).
Forward outlook
- Local home prices are declining (-3.0%/yr); year-one equity from $2k of loan paydown is wiped out by about $8k of value loss. Plan a longer hold.
- Dallas County population projected at +74% by 2050 — long-run rental-demand tailwind backs the buy-and-hold thesis.
Negotiation context
- It's been on market 184 days — a 12% lower offer ($224k) is reasonable based on typical stale-listing flexibility.
Questions for the listing agent
- What do current leases actually rent for vs. the listed asking? Can we see a recent rent roll and the last 12 months of T-12 income?
- It's been on market 184 days. Have you received any prior offers? Is the seller open to a 12% concession, seller financing, or rate buy-down credit?
- What does the HOA fee cover, when was the last increase, and are there any pending special assessments or reserve-fund shortfalls?
- Why hasn't it sold? Are there any deal-killer items the seller is aware of (foundation, flood, title, zoning, code violations)?
- Is there a deadline driving the sale (1031 exchange, divorce, estate, relocation)? That informs how much negotiation room exists.
- Schools are A-rated — typically a magnet for longer-tenancy family renters. What's the average tenant stay here, and is there a school-zone premium baked into asking?
- The area grade is low — what's the realistic commute time and amenity access for the typical tenant pool here? Any planned neighborhood developments (good or bad) we should know about?
- What's the average days-on-market for RENTAL listings here right now (not sales)? A rising rental-DOM trend means longer vacancies and softer asking-rent achievability than the comps imply.
- What's the recent tenant-quality profile in this submarket — average credit score on applications, eviction rate, late-payment / NSF rate, and stable-employment percentage? A property-management company in the area should have these aggregated.
- How much new for-sale + rental construction is in the pipeline within 1–3 miles? Heavy new supply typically softens prices + rents 12–24 months out; constrained supply supports both.
Investment metrics
- 1% rule
- 0.89% ✗
- Cap rate
- 5.50%
- Cash-on-cash
- -2.82%
- DSCR
- 0.87
- GRM
- 9.4
CMA / ARV
No comps found within radius.
Projected returns pro-forma
-3.0% appreciation · 1.82% rent growth · sell at horizon
- IRR
- -22.4%
- Equity multiple
- 0.24×
- Total profit
- $-54,495
- Equity at exit
- $38,020
- IRR
- -20.0%
- Equity multiple
- 0.00×
- Total profit
- $-71,221
- Equity at exit
- $22,047
Cash invested: $71,397 (down + closing). Projections, not guarantees.
Landlord ↔ Tenant lean methodology
- Overall (STATE)
- 83 Strongly Landlord-Friendly
- State Iowa
- 83 Strongly Landlord-Friendly · R+6
- County
- — inherits STATE
- City
- — inherits STATE
ZIP-level market 50263
- Rents YoY
- 1.8%
- Active inventory
- 891
- Price-to-rent
- 9.4×
Monthly cashflow live
- Estimated rent
- $2,265 medium interval (Pro) →
- Mortgage (P&I)
- −$1,337
- Tax est. 1.5%
- −$319 /mo · $3,825/yr
- Insurance
- −$106
- HOA
- −$195
- Vacancy / Maint / Mgmt
- −$476
- Net cashflow
- $-168
Break-even live
Sensitivity live
| Price | -10% $9 | -5% $-79 | +0% $-168 | +5% $-256 | +10% $-344 |
|---|---|---|---|---|---|
| Rent | -10% $-347 | -5% $-257 | +0% $-168 | +5% $-78 | +10% $11 |
| Rate | -1.0pp $-39 | -0.5pp $-103 | base $-168 | +0.5pp $-234 | +1.0pp $-301 |
UW: 25.0% down · 7.5% · 30yr · 1.5% tax · 5.0% vac · 8.0% maint · 8.0% mgmt
Financing live
Cash to close
- Down payment
- $63,748
- Closing costs
- $7,650
- Reserves months
- —
- Total cash needed
- —
Loan-product check · same deal, 3 products live
Conventional
25% down · 7.5% · 30yr
- Down + closing
- —
- Monthly P&I
- —
- Monthly cashflow
- —
- DSCR
- —
- Eligible?
- —
Personal DTI + credit; lowest rate.
DSCR
20% down · 8.5% · 30yr
- Down + closing
- —
- Monthly P&I
- —
- Monthly cashflow
- —
- DSCR
- —
- Eligible?
- —
No personal income docs; deal must DSCR.
Hard money
10% down · 12.0% · 12mo
- Down + closing
- —
- Monthly P&I
- —
- Monthly cashflow
- —
- DSCR
- —
- Eligible?
- —
Short-term bridge; refi at stabilization.
Rent comps 3 comps
| Address | Beds | Baths | Sqft | Rent | $/sqft | DOM | Units | Dist |
|---|---|---|---|---|---|---|---|---|
| 3681 Jasmine Ln Waukee, IA | 3.0 | 2.5 | 1464 | $2,235 | $1.53 | 15d | 13 | 0.11mi |
| 3681 Jasmine Ln Unit HOME1 Waukee, IA | 3.0 | 2.5 | 1511 | $2,545 | $1.68 | 45d | 1 | 0.11mi |
| 3681 Jasmine Ln Unit HOME94 Waukee, IA | 3.0 | 2.5 | 1418 | $2,375 | $1.67 | 45d | 1 | 0.11mi |
HOA detail
- Monthly dues
- $195 · $2,340/yr
- Likely covers
- electric
Listing history 2 events
-
2026-06-05remarks 699-char remark
-
2026-06-05$254,990 Pending 184 DOM
ⓘ Source: listings_history table (triggers on properties + properties_extension) + one-shot
backfill from property_details.listing_events for pre-trigger history.
Nearby sold comps map
Loading sold comps map…
Walkable amenities ~0.75 mi
Loading nearby amenities…
Taxation est. · year 1
- Rental income
- $27,184
- − Mortgage interest
- −$14,283
- − Property taxes
- −$3,825
- − Insurance
- −$1,275
- − Repairs & maintenance
- −$2,175
- − Management
- −$2,175
- − HOA
- −$2,340
- − Depreciation
- −$7,418
- Taxable loss
- −$6,306
- Est. tax savings @ 24.0%
- +$1,514
- After-tax cash flow
- $-497/yr
For passive investors: Depreciation is non-cash, so a rental often shows a tax loss while cash-flowing — sheltering income. Rental losses are passive: they offset passive income freely, and up to $25,000/yr can offset ordinary (W-2) income if you actively participate and your MAGI is under $100k (phasing out to $0 by $150k); unused losses carry forward. On sale, claimed depreciation is recaptured at up to 25%, and gains may owe capital-gains tax (a 1031 exchange can defer both). Figures are a year-1 estimate at your 24.0% rate — not tax advice; consult a CPA.
Schools (NCES district)
- District
- Waukee Community School District
- NCES district ID
- 1930510
- Math proficiency
- 80% ▼ -6.00%
- Reading proficiency
- 79% ▼ -5.00%
- Median HH income
- $88,580
- Composite
- 70.94/100
- National rank
- #245
- State rank
- #14 of 289 in IA
Livability — Waukee
- Score
- 84/100
- State rank
- #22
- US rank
- #682
Category grades
Schools grade is shown separately in the Schools card above.
Census & demographics
- Census place
- Waukee, IA
- County
- Dallas County · 77,082 people
- City population
- 29,611
- Metro
- Des Moines-West Des Moines, IA
- Population (ZIP)
- 29,611
- Household income
- $102,762
- Rent vs Own
- Severe rent burden
- 468.0
Population outlook (Dallas County) Hauer SSP2
- Today (2025)
- 111,904 people
- By 2030
- 127,807 · +14.2%
- By 2040
- 160,576 · +43.5%
- By 2050
- 194,154 · +73.5%
- By 2075
- 271,895 · +143.0%
- By 2100
- 326,525 · +191.8%
Race, ethnicity, and origin ACS 2023
- Neighborhood character
- Predominantly White (77%)
- Race & ethnicity
- White 77% Two or more races 7% Asian 6% Hispanic / Latino 6% Black 4%
- Hispanic origin (detail)
- Mexican 3%
- Common ancestry
- Portuguese 3% Lithuanian 3% Iranian 3%
- Foreign-born
- 13% · Canada, India
- Languages at home
- 85% English-only · Other Asian/Pacific 3% Spanish 3% Arabic 2%
Political lean MEDSL · Dallas
- 2024 margin
- Toss-up / Even · D 46.9% · R 51.7% · Other 1.4%
- 2008→2024 swing
- +0.8pp no change · 2008: -5.5pp · 2024: -4.8pp
- All cycles
- 2024: R+4.8 2020: R+2.0 2016: R+9.6 2012: R+11.8 2008: R+5.5
Not yet ingested
- Civics
- —
Market trends
- HPI YoY
- ▼ -97.95%
- Current HPI
- 169.2421
- Rent YoY
- ▲ 1.82%
- Metro
- Des Moines-West Des Moines, IA
- State GDP YoY
- ▲ 2.48%
- F500 in state
- 4
Industry mix (Fortune 500 HQ in IA)
| Industry | F500 HQs | Revenue |
|---|---|---|
| Financial Services | 1 | $16B |
|
||
| Retail / Convenience | 1 | $15B |
|
||
Price history
-1.9% since first listed3 events — show timeline
- 2026-06-04 Pending — DMMLS
- 2026-04-07 Price Changed $254,990 DMMLS
- 2025-10-21 Listed $259,990 DMMLS
Property tax history
+0.0%/yrLatest (2025): $2 · +0.0% YoY. Source: county tax records.
Cash-flow waterfall
monthlySold comps — $/sqft
last 12 mo · ≤1 miLoading sold comps…