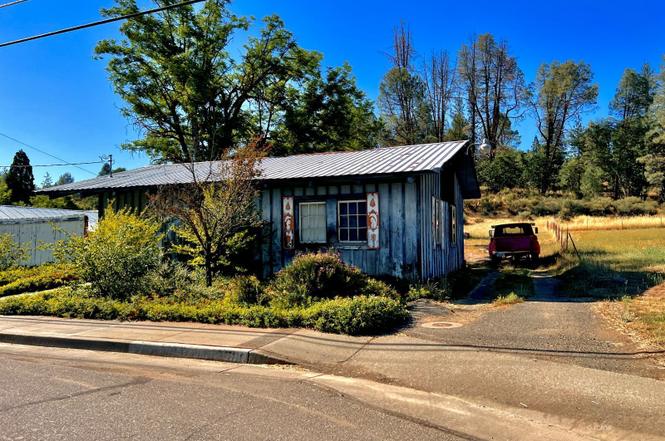
7021 Highway 3 · Hayfork, CA
Flood risk No data
- FEMA flood zone
- —
- Chance of flooding over 30 yrs
- —
- Est. flood insurance / yr
- —
Fire risk No data
- Est. fire insurance / yr
- —
Heat risk No data
- Hot days now (above threshold)
- —
- Hot days in 30 yrs
- —
Wind risk No data
- Chance of severe wind over 30 yrs
- —
Air-quality risk No data
- Unhealthy air days now
- —
- Unhealthy air days in 30 yrs
- —
Risk factors via First Street. Map © Google.
Why this score? — see what drove the B- grade
The composite is a weighted blend of 9 inputs, each scored 0–100. Each bar is that input's sub-score; the figure is the points it added to the 100-point composite (weight × sub-score).
- Cash flow +28.2/30.0
- DSCR +10.0/10.0
- 1% rule +7.7/10.0
- ARV discount +5.6/15.0
- Schools +3.5/10.0
- Appreciation +3.1/10.0
- Livability +2.9/5.0
- Rent growth +2.5/5.0
- Condition / age +2.5/5.0
$65,000
🖨 Deal sheet 📄 Offer letter ✓ Due diligence
Listing remarks
High-traffic 0.17ac lot and building with C-1 Commercial Retail zoning located front and center on the main drag / Highway 3 in Hayfork. Currently rented for $650/mo, this versatile space is perfect as a restaurant, retail, or office venture and current tenants live within the property. It shows as an open-concept 1BR with one full bathroom and one half bath in disrepair. It's connected to city 'Water Works' water and sewer, locally raised Trinity PUD power (cheapest rates in contiguous US), and has a city maintained / landscaped front yardspace offering attractive curb appeal. The property also features a larger partially fenced backyard, easy driveway, and rear parking area large enough f
Key facts
- Built 1950
- Listed 576 days
Neighborhood map
What this means for you Summary
Snapshot
- This is a 1-bed/1.5-bath single-family listed at $65k.
Deal economics
- At list price, monthly cash flow is $205 ($2k/yr) — positive.
- The deal already cash-flows at list — no discount required.
- Meets the 1% rule at list price ($829 rent vs $65k).
- Recommended offer: $57k (12.0% below list) — sets the bar for market timing.
- Cap rate 10.1% vs local median 3.0% in Hayfork — top-decile yield for the area; either an underpriced asset or a hidden risk that comps aren't pricing in. Stress-test before assuming the spread holds.
Location & tenants
- Location reads 58/100 on livability (#677 in CA) — a working-class tenant base; expect higher turnover. Strengths: health & safety A+, crime B; Watch: schools D+, amenities F, commute F.
- Mountain Valley Unified (rural): math 40% / reading 40% proficiency, ranked #788 of 1,400 in CA (top 56%) — families likely to look elsewhere, expect single-tenant / working-renter base with shorter leases; 72% free/reduced lunch — lower-income household profile, screen leases tightly.
- Market conditions: 98 active listings in the ZIP; 21 units permitted in Trinity County in 2024 (0 in 5+ unit buildings).
Forward outlook
- Local home prices are declining (-3.0%/yr); year-one equity from $449 of loan paydown is wiped out by about $2k of value loss. Plan a longer hold.
- Trinity County population projected at -38% by 2050 — secular population decline; favor cash flow + early exit over multi-decade hold.
- At projected returns (-3.0% appreciation + 3.0% rent growth), your $18k cash investment doubles in ~9 years — after that, you're playing with house money.
Negotiation context
- It's been on market 576 days — a 12% lower offer ($57k) is reasonable based on typical stale-listing flexibility.
- 3 sale attempts since 2y ago; this cycle's ask has dropped $20k (24%) from the opening price — seller is motivated, your offer sets the floor, not the list.
Risks & watch-outs
- Watch-outs: built in 1950 — expect roof / HVAC / electrical / plumbing capex.
Questions for the listing agent
- It's been on market 576 days. Have you received any prior offers? Is the seller open to a 12% concession, seller financing, or rate buy-down credit?
- Built in 1950 — when were the roof, HVAC, electrical panel, plumbing, and water heater last replaced?
- Why hasn't it sold? Are there any deal-killer items the seller is aware of (foundation, flood, title, zoning, code violations)?
- Is there a deadline driving the sale (1031 exchange, divorce, estate, relocation)? That informs how much negotiation room exists.
- Schools are D-rated, which usually means shorter tenancies and higher turnover. Who's the typical renter profile here, and what's been the actual vacancy rate?
- What's the average days-on-market for RENTAL listings here right now (not sales)? A rising rental-DOM trend means longer vacancies and softer asking-rent achievability than the comps imply.
- What's the recent tenant-quality profile in this submarket — average credit score on applications, eviction rate, late-payment / NSF rate, and stable-employment percentage? A property-management company in the area should have these aggregated.
- How much new for-sale + rental construction is in the pipeline within 1–3 miles? Heavy new supply typically softens prices + rents 12–24 months out; constrained supply supports both.
Investment metrics
- 1% rule
- 1.27% ✓
- Cap rate
- 10.09%
- Cash-on-cash
- 13.55%
- DSCR
- 1.60
- GRM
- 6.5
CMA / ARV
- ARV (on-the-fly)
- $62,400
- Comps found
- 2
Show comp detail 2 sales within ~0.75 mi
| Address | Dist | Beds/Ba | Sqft | Sold | Price | $/sf | Match |
|---|---|---|---|---|---|---|---|
| 7021 Highway 3 | 0.00mi | 1/1.5 | 800 (0%) | 1mo | $52,000 | $65 | 100 |
| 201 West Oak Ave | 0.62mi | 2/1.0 (+1) | 900 (+12%) | 8mo | $70,000 | $78 | 36 |
Match score weights: distance 35% · size 25% · config 20% · recency 20%. Top-matched comps best support the ARV.
Projected returns pro-forma
-3.0% appreciation · 3.0% rent growth · sell at horizon
- IRR
- 3.7%
- Equity multiple
- 1.14×
- Total profit
- $2,567
- Equity at exit
- $9,692
- IRR
- 13.2%
- Equity multiple
- 2.05×
- Total profit
- $19,139
- Equity at exit
- $5,620
Cash invested: $18,200 (down + closing). Projections, not guarantees.
Landlord ↔ Tenant lean methodology
- Overall (STATE)
- 18 Strongly Tenant-Friendly
- State California
- 18 Strongly Tenant-Friendly · D+13
- County
- — inherits STATE
- City
- — inherits STATE
ZIP-level market 96041
- Home prices YoY
- -3.1%
- Active inventory
- 98
- Price-to-rent
- 6.5×
Monthly cashflow live
- Estimated rent
- $829 medium interval (Pro) →
- Mortgage (P&I)
- −$341
- Tax est. 1.5%
- −$81 /mo · $975/yr
- Insurance
- −$27
- HOA
- −$0
- Vacancy / Maint / Mgmt
- −$174
- Net cashflow
- $205
Break-even live
UW: 25.0% down · 7.5% · 30yr · 1.5% tax · 5.0% vac · 8.0% maint · 8.0% mgmt
Financing live
Cash to close
- Down payment
- $16,250
- Closing costs
- $1,950
- Reserves months
- —
- Total cash needed
- —
Loan-product check · same deal, 3 products live
Conventional
25% down · 7.5% · 30yr
- Down + closing
- —
- Monthly P&I
- —
- Monthly cashflow
- —
- DSCR
- —
- Eligible?
- —
Personal DTI + credit; lowest rate.
DSCR
20% down · 8.5% · 30yr
- Down + closing
- —
- Monthly P&I
- —
- Monthly cashflow
- —
- DSCR
- —
- Eligible?
- —
No personal income docs; deal must DSCR.
Hard money
10% down · 12.0% · 12mo
- Down + closing
- —
- Monthly P&I
- —
- Monthly cashflow
- —
- DSCR
- —
- Eligible?
- —
Short-term bridge; refi at stabilization.
Listing history 8 events
-
2026-04-21status Pending
-
2026-02-20status Active
-
2026-02-13status Pending
-
2025-12-10price $65,000
-
2025-06-03price $75,000
-
2025-05-23status Active
-
2025-05-08status Pending
-
2024-08-28$85,000 Active
ⓘ Source: listings_history table (triggers on properties + properties_extension) + one-shot
backfill from property_details.listing_events for pre-trigger history.
Nearby sold comps map
Loading sold comps map…
Walkable amenities ~0.75 mi
Loading nearby amenities…
Taxation est. · year 1
- Rental income
- $9,945
- − Mortgage interest
- −$3,641
- − Property taxes
- −$975
- − Insurance
- −$325
- − Repairs & maintenance
- −$796
- − Management
- −$796
- − Depreciation
- −$1,891
- Taxable income
- $1,522
- Est. tax owed @ 24.0%
- −$365
- After-tax cash flow
- $2,101/yr
For passive investors: Depreciation is non-cash, so a rental often shows a tax loss while cash-flowing — sheltering income. Rental losses are passive: they offset passive income freely, and up to $25,000/yr can offset ordinary (W-2) income if you actively participate and your MAGI is under $100k (phasing out to $0 by $150k); unused losses carry forward. On sale, claimed depreciation is recaptured at up to 25%, and gains may owe capital-gains tax (a 1031 exchange can defer both). Figures are a year-1 estimate at your 24.0% rate — not tax advice; consult a CPA.
Schools (NCES district)
- District
- Mountain Valley Unified
- NCES district ID
- 0600018
- Math proficiency
- 40% ▲ 5.00%
- Reading proficiency
- 40% ▲ 5.00%
- Median HH income
- $32,254
- Composite
- 35.23/100
- National rank
- #9851
- State rank
- #788 of 1400 in CA
Livability — Hayfork
- Score
- 58/100
- State rank
- #677
- US rank
- #20786
Category grades
Schools grade is shown separately in the Schools card above.
Census & demographics
- Census place
- Hayfork, CA
- City population
- 3,413
- Population (ZIP)
- 3,413
Population outlook (Trinity County) Hauer SSP2
- Today (2025)
- 11,337 people
- By 2030
- 10,349 · -8.7%
- By 2040
- 8,518 · -24.9%
- By 2050
- 7,084 · -37.5%
- By 2075
- 4,693 · -58.6%
- By 2100
- 2,894 · -74.5%
Race, ethnicity, and origin ACS 2023
- Neighborhood character
- Predominantly White (81%)
- Race & ethnicity
- White 81% Asian 9% Hispanic / Latino 8% Two or more races 3%
- Hispanic origin (detail)
- Dominican 4%
- Common ancestry
- Italian 4% Serbian 4% Iranian 2%
- Foreign-born
- 12% · Canada
- Languages at home
- 84% English-only · Other Asian/Pacific 9% Spanish 5% Russian/Polish/Slavic 1%
Political lean MEDSL · Trinity
- 2024 margin
- Lean R (+9.4) · D 43.4% · R 52.8% · Other 3.8%
- 2008→2024 swing
- -14.0pp toward R · 2008: 4.6pp · 2024: -9.4pp
- All cycles
- 2024: R+9.4 2020: R+5.4 2016: R+11.3 2012: R+1.1 2008: D+4.6
Not yet ingested
- Civics
- —
Market trends
- HPI YoY
- ▼ -3.83%
- Current HPI
- 117.7109
- Rent YoY
- —
- Metro
- —
- State GDP YoY
- ▲ 3.21%
- F500 in state
- 116
Industry mix (Fortune 500 HQ in CA)
| Industry | F500 HQs | Revenue |
|---|---|---|
| Technology | 27 | $1,492B |
|
||
| Financial Services | 3 | $174B |
|
||
| Retail | 3 | $44B |
|
||
| Insurance | 3 | $26B |
|
||
| Media / Entertainment | 2 | $115B |
|
||
| Pharmaceuticals / Biotech | 2 | $62B |
|
||
Price history
-23.5% since first listed8 events — show timeline
- 2026-04-21 Pending — Trinity AOR
- 2026-02-20 Relisted — Trinity AOR
- 2026-02-13 Pending — Trinity AOR
- 2025-12-10 Price Changed $65,000 Trinity AOR
- 2025-06-03 Price Changed $75,000 Trinity AOR
- 2025-05-23 Relisted — Trinity AOR
- 2025-05-08 Pending — Trinity AOR
- 2024-08-28 Listed $85,000 Trinity AOR
Cash-flow waterfall
monthlySold comps — $/sqft
last 12 mo · ≤1 miLoading sold comps…