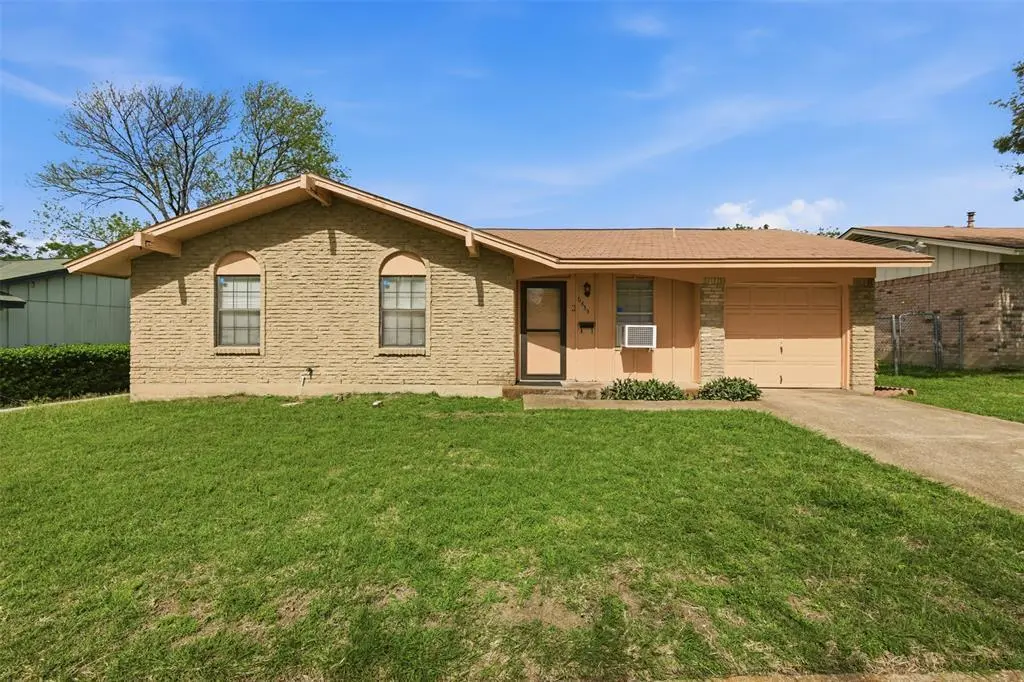
6435 Moonhill Dr · Dallas, TX
Flood risk 1/10 · Minimal
- FEMA flood zone
- X (unshaded)
- Chance of flooding over 30 yrs
- 0.0%
- Est. flood insurance / yr
- $507 – $1,088
Fire risk 3/10 · Minor
- Est. fire insurance / yr
- $1,222 – $2,270
Heat risk 7/10 · Major
- Hot days now (above 110°F)
- 7 days/yr
- Hot days in 30 yrs
- 25 days/yr
Wind risk 6/10 · Moderate
- Chance of severe wind over 30 yrs
- 27.0%
Air-quality risk 2/10 · Minimal
- Unhealthy air days now
- 1 days/yr
- Unhealthy air days in 30 yrs
- 2 days/yr
Risk factors via First Street. Map © Google.
Why this score? — see what drove the C grade
The composite is a weighted blend of 9 inputs, each scored 0–100. Each bar is that input's sub-score; the figure is the points it added to the 100-point composite (weight × sub-score).
- Cash flow +20.2/30.0
- ARV discount +15.0/15.0
- 1% rule +6.7/10.0
- DSCR +6.4/10.0
- Livability +4.0/5.0
- Schools +2.8/10.0
- Condition / age +2.5/5.0
- Rent growth +1.8/5.0
- Appreciation +0.0/10.0
$150,000
🖨 Deal sheet 📄 Offer letter ✓ Due diligence
Listing remarks
Backup Offers being accepted. Being sold as is with the Owner making no repairs, this property presents a fantastic opportunity-situated on a generous 6,843 sq. ft. lot, the home provides ample space both inside and out, making it ideal for families or investors seeking their next project, an addition to your portfolio, or a long term investment strategy. For families, with a functional floorplan this three bedroom, one bath, one car garage offers an excellent opportunity to create a place that truly feels like home. The spacious backyard is a standout feature perfect for gatherings, outdoor living, or even future enhancements. Schedule your showing today and see the possibilities for yours
Key facts
- Generous lot
- Spacious backyard
- Functional floorplan
Tags
Property features AI
Finance
- Other: No municipal utility district; No known restrictions
- Financial info: Listing accepts Cash, Contract, Conventional and Other financing
- HOA & community: No homeowners association; Community curbs
Exterior
- Parking: Attached garage (1 car) with inside entrance; Covered parking (1); Driveway; Additional parking and on-street parking; Garage faces front; Lighted parking
- Security: Security lights; Smoke detectors
- Utilities: City water; City sewer; Individual water and gas meters; Natural gas available; Electricity available and connected; Cable available; Concrete, curbs, sidewalk and alley access; Overhead utilities; All-weather road
- Home design: Single-family residence; Single-story; Not attached to another property; Built in 1971
- Construction: Brick construction; Shingle roof; Slab foundation
- Exterior features: Covered porch(es); Large backyard with grass; Few trees; Subdivision setting; Back yard chain-link and other fencing; Easements for access, electric, natural gas and utilities
Interior
- Kitchen: Gas range; Plumbed for gas in kitchen; Gas water heater
- Bedrooms: Primary bedroom (Level 1) with walk-in closet; Two additional bedrooms (Level 1)
- Flooring: Ceramic tile; Laminate flooring
- Bathrooms: 1 full bathroom
- Heating & cooling: Central heating; Ceiling fans; Window/wall air conditioning units; Electric cooling
- Interior features: Cable TV available; High-speed internet available; Walk-in closets; One living area; One dining area; Total rooms: 4; One level (single-story)
- Laundry & utility: Full-size washer/dryer area; Washer hookup; Electric dryer hookup; Laundry located in garage
Neighborhood map
What this means for you Summary
Snapshot
- This is a 3-bed/1.5-bath single-family listed at $150k.
Deal economics
- At list price, monthly cash flow is $189 ($2k/yr) — positive.
- The deal already cash-flows at list — no discount required.
- Meets the 1% rule at list price ($2k rent vs $150k).
- Recommended offer: $146k (3.0% below list) — sets the bar for market timing.
- Cap rate 7.8% vs local median 2.3% in Dallas — top-decile yield for the area; either an underpriced asset or a hidden risk that comps aren't pricing in. Stress-test before assuming the spread holds.
Location & tenants
- Location reads 81/100 on livability (#24 in TX, #1,380 nationally) — a professional / high-income tenant draw. Strengths: amenities A+, commute A+, housing A+; Watch: crime F.
- Dallas ISD (urban): math 31% / reading 36% proficiency, ranked #559 of 826 in TX (top 68%) — families likely to look elsewhere, expect single-tenant / working-renter base with shorter leases; 83% free/reduced lunch — lower-income household profile, screen leases tightly.
- Zoned schools: J N Ervin El (math 17% / reading 20%, grade F, #3,759 of 4,322 statewide, top 88%, 646 students, 98% FRL).
- Zoned-school proficiency averages 18% at this address vs 34% district-wide (-15 pts) — the specific schools serving this property underperform the Dallas ISD average; the district grade overstates school quality for this exact location.
- Market conditions: Rents soft (-2.8%/yr); 207 active listings in the ZIP; 10 comparable units currently listed for rent nearby; rentals leasing fast (median 7d on market — plan ~1-2 weeks tenant-placement turnaround); 12,577 units permitted in Dallas County in 2024 (6,829 in 5+ unit buildings).
- This rent runs 39% of the median local income ($54k/yr) — at the standard rent-burdened threshold; future hikes will face affordability resistance.
Forward outlook
- Local home prices are declining (-3.0%/yr); year-one equity from $1k of loan paydown is wiped out by about $4k of value loss. Plan a longer hold.
- Dallas County population projected at +35% by 2050 — long-run rental-demand tailwind backs the buy-and-hold thesis.
Negotiation context
- It's been on market 37 days — a 3% lower offer ($146k) is reasonable based on typical stale-listing flexibility.
Risks & watch-outs
- Watch-outs: property tax is 2.8% of price.
- Climate carrying-cost: major wind risk, 27% chance of damaging wind over 30y; extreme-heat days projected 7→25/yr by 2055 (HVAC capex compounding) — expect insurance premiums to compound above CPI over the hold.
Questions for the listing agent
- It's been on market 37 days. Have you received any prior offers? Is the seller open to a 3% concession, seller financing, or rate buy-down credit?
- Built in 1971 — when were the roof, HVAC, electrical panel, plumbing, and water heater last replaced?
- Property tax is high relative to price — has the assessment been appealed recently, and will the sale trigger a re-assessment?
- Is there a deadline driving the sale (1031 exchange, divorce, estate, relocation)? That informs how much negotiation room exists.
- Crime grade is F in this area — have there been break-ins, vandalism, or insurance claims at this property in the last 3 years? What carrier currently insures it and at what premium?
- What's the average days-on-market for RENTAL listings here right now (not sales)? A rising rental-DOM trend means longer vacancies and softer asking-rent achievability than the comps imply.
- What's the recent tenant-quality profile in this submarket — average credit score on applications, eviction rate, late-payment / NSF rate, and stable-employment percentage? A property-management company in the area should have these aggregated.
- How much new for-sale + rental construction is in the pipeline within 1–3 miles? Heavy new supply typically softens prices + rents 12–24 months out; constrained supply supports both.
Investment metrics
- 1% rule
- 1.17% ✓
- Cap rate
- 7.81%
- Cash-on-cash
- 5.40%
- DSCR
- 1.24
- GRM
- 7.1
CMA / ARV
- ARV (median comp)
- $206,357
- List price
- $150,000
- Delta
- -27.31%
- Verdict
- UNDERPRICED
- Comps
- 20 within 1.0 mi
Show comp detail 12 sales within ~0.75 mi
| Address | Dist | Beds/Ba | Sqft | Sold | Price | $/sf | Match |
|---|---|---|---|---|---|---|---|
| 3503 Silverhill Dr | 0.21mi | 4/2.0 (+1) | 1,019 (+5%) | 1mo | $212,000 | $208 | 74 |
| 3620 Pacesetter Dr | 0.42mi | 3/1.5 | 942 (-3%) | 5mo | $140,000 | $149 | 71 |
| 6544 Cinnamon Oaks Dr | 0.21mi | 3/1.5 | 1,073 (+10%) | 2mo | $205,000 | $191 | 71 |
| 3554 Tioga St | 0.30mi | 3/1.0 | 903 (-7%) | 10mo | $195,000 | $216 | 64 |
| 6341 Leaning Oaks St | 0.35mi | 3/1.5 | 1,042 (+7%) | 11mo | $189,900 | $182 | 62 |
| 3849 Stagecoach Trl | 0.55mi | 3/1.0 | 972 (0%) | 13mo | $225,000 | $231 | 61 |
| 3760 Stagecoach Trl | 0.53mi | 3/1.5 | 1,026 (+6%) | 13mo | $180,000 | $175 | 55 |
| 3707 Pacesetter Dr | 0.46mi | 3/1.5 | 1,100 (+13%) | 4mo | $139,900 | $127 | 53 |
| 6624 Sebring Dr | 0.53mi | 3/1.5 | 1,083 (+11%) | 4mo | $215,000 | $199 | 52 |
| 3450 Pacesetter Dr | 0.24mi | 4/1.5 (+1) | 1,100 (+13%) | 13mo | $210,000 | $191 | 51 |
| 2934 Morgan Dr | 0.74mi | 3/1.0 | 1,080 (+11%) | 1mo | $175,000 | $162 | 44 |
| 3140 Mojave Dr | 0.60mi | 3/2.0 | 1,089 (+12%) | 16mo | $225,000 | $207 | 37 |
Match score weights: distance 35% · size 25% · config 20% · recency 20%. Top-matched comps best support the ARV.
Projected returns pro-forma
-3.0% appreciation · 0.0% rent growth · sell at horizon
- IRR
- -11.7%
- Equity multiple
- 0.59×
- Total profit
- $-17,286
- Equity at exit
- $22,365
- IRR
- -8.5%
- Equity multiple
- 0.55×
- Total profit
- $-18,936
- Equity at exit
- $12,969
Cash invested: $42,000 (down + closing). Projections, not guarantees.
Landlord ↔ Tenant lean methodology
- Overall (STATE)
- 87 Strongly Landlord-Friendly
- State Texas
- 87 Strongly Landlord-Friendly · R+5
- County
- — inherits STATE
- City
- — inherits STATE
ZIP-level market 75241
- Home prices YoY
- -16.9%
- Rents YoY
- -2.8%
- Active inventory
- 207
- Price-to-rent
- 7.1×
Monthly cashflow live
- Estimated rent
- $1,758 high interval (Pro) →
- Mortgage (P&I)
- −$787
- Tax from tax record
- −$350 /mo · $4,205/yr
- Insurance
- −$62
- HOA
- −$0
- Vacancy / Maint / Mgmt
- −$369
- Net cashflow
- $189
Break-even live
UW: 25.0% down · 7.5% · 30yr · 1.5% tax · 5.0% vac · 8.0% maint · 8.0% mgmt
Financing live
Cash to close
- Down payment
- $37,500
- Closing costs
- $4,500
- Reserves months
- —
- Total cash needed
- —
Loan-product check · same deal, 3 products live
Conventional
25% down · 7.5% · 30yr
- Down + closing
- —
- Monthly P&I
- —
- Monthly cashflow
- —
- DSCR
- —
- Eligible?
- —
Personal DTI + credit; lowest rate.
DSCR
20% down · 8.5% · 30yr
- Down + closing
- —
- Monthly P&I
- —
- Monthly cashflow
- —
- DSCR
- —
- Eligible?
- —
No personal income docs; deal must DSCR.
Hard money
10% down · 12.0% · 12mo
- Down + closing
- —
- Monthly P&I
- —
- Monthly cashflow
- —
- DSCR
- —
- Eligible?
- —
Short-term bridge; refi at stabilization.
Rent comps 10 comps
| Address | Beds | Baths | Sqft | Rent | $/sqft | DOM | Units | Dist |
|---|---|---|---|---|---|---|---|---|
| 3440 Simpson Stuart Rd Dallas, TX | 1.0–3.0 | 1.0–2.0 | 942 | $2,103 | $2.23 | 1d | 9 | 0.62mi |
| 3131 Simpson Stuart Rd Dallas, TX | 1.0–3.0 | 1.0–2.0 | 1024 | $1,694 | $1.65 | 3d | 33 | 0.72mi |
| 5850 Highland Hills Dr Dallas, TX | 2.0–4.0 | 1.0–2.0 | 910 | $1,083 | $1.19 | 2d | 9 | 0.90mi |
| 5761 Highland Hills Dr Dallas, TX | 1.0–3.0 | 1.0–2.0 | 1040 | $1,749 | $1.68 | 3d | 7 | 0.93mi |
| 2525 Lyola St Dallas, TX | 3.0 | 2.0 | 1080 | $1,895 | $1.75 | 43d | 1 | 0.96mi |
| 5821 Bonnie View Rd Dallas, TX | 1.0–3.0 | 1.0–2.0 | 820 | $1,101 | $1.34 | 7d | 7 | 1.08mi |
| 4140 Wilshire Blvd Dallas, TX | 3.0 | 2.0 | 1125 | $1,795 | $1.60 | 17d | 1 | 1.12mi |
| 2529 Morgan Dr Dallas, TX | 2.0 | 1.0 | 842 | $1,650 | $1.96 | 24d | 1 | 1.18mi |
| 3835 Basswood Dr Dallas, TX | 3.0 | 2.0 | 1000 | $1,625 | $1.62 | 24d | 1 | 1.32mi |
| 2111 Crouch Rd Dallas, TX | 1.0–2.0 | 1.0–2.0 | 866 | $1,277 | $1.47 | 6d | 1 | 1.36mi |
Listing history 4 events
-
2026-06-01status $150,000 Pending 37 DOM
-
2026-05-31days on market $150,000 Active Option Contract 37 DOM
-
2026-05-18price $150,000 791-char remark
-
2026-04-02$180,000 Active 791-char remark
ⓘ Source: listings_history table (triggers on properties + properties_extension) + one-shot
backfill from property_details.listing_events for pre-trigger history.
Tax reassessment forecast TX · Resets to sale price
- Current annual tax
- $4,205 · $350/mo
- Projected year-2 tax
- $4,205 · $350/mo
- Expected delta
- $0/yr ($0/mo · 0.0%)
ⓘ Screening estimate from a state-policy table — verify with the county assessor before closing.
Climate risk First Street
- Flood 1/10 Low FEMA zone X (unshaded) · 0% chance over 30 yrs
- Wildfire 3/10 Moderate
- Heat 7/10 Severe 7 d/yr ≥110°F today · 25 d/yr by 30 yrs out
- Wind 6/10 Major 27% chance of damaging wind over 30 yrs
- Air quality 2/10 Low 1 unhealthy d/yr today · 2 by 30 yrs out
Nearby sold comps map
Loading sold comps map…
Walkable amenities ~0.75 mi
Loading nearby amenities…
Taxation est. · year 1
- Rental income
- $21,093
- − Mortgage interest
- −$8,402
- − Property taxes
- −$4,205
- − Insurance
- −$750
- − Repairs & maintenance
- −$1,687
- − Management
- −$1,687
- − Depreciation
- −$4,364
- Taxable loss
- −$3
- Est. tax savings @ 24.0%
- +$1
- After-tax cash flow
- $2,270/yr
For passive investors: Depreciation is non-cash, so a rental often shows a tax loss while cash-flowing — sheltering income. Rental losses are passive: they offset passive income freely, and up to $25,000/yr can offset ordinary (W-2) income if you actively participate and your MAGI is under $100k (phasing out to $0 by $150k); unused losses carry forward. On sale, claimed depreciation is recaptured at up to 25%, and gains may owe capital-gains tax (a 1031 exchange can defer both). Figures are a year-1 estimate at your 24.0% rate — not tax advice; consult a CPA.
Schools (NCES district)
- District
- Dallas ISD
- NCES district ID
- 4816230
- Math proficiency
- 31% ▼ -16.00%
- Reading proficiency
- 36% ▼ -4.00%
- Median HH income
- $42,881
- Composite
- 28.41/100
- National rank
- #6763
- State rank
- #559 of 826 in TX
Livability — Dallas
- Score
- 81/100
- State rank
- #24
- US rank
- #1380
Category grades
Schools grade is shown separately in the Schools card above.
Census & demographics
- Census place
- Dallas, TX
- County
- Dallas County · 2,612,404 people
- City population
- 1,168,437
- Metro
- Dallas-Fort Worth-Arlington, TX
- Population (ZIP)
- 33,840
- Household income
- $53,998
- Rent vs Own
- Severe rent burden
- 1076.0
Population outlook (Dallas County) Hauer SSP2
- Today (2025)
- 2,979,839 people
- By 2030
- 3,191,823 · +7.1%
- By 2040
- 3,619,611 · +21.5%
- By 2050
- 4,026,915 · +35.1%
- By 2075
- 4,957,073 · +66.4%
- By 2100
- 5,508,725 · +84.9%
Race, ethnicity, and origin ACS 2023
- Neighborhood character
- Majority Black (62%)
- Race & ethnicity
- Black 62% Hispanic / Latino 30% Two or more races 8% White 5% Native American 2%
- Hispanic origin (detail)
- Mexican 24%
- Foreign-born
- 13% · Canada
- Languages at home
- 73% English-only · Spanish 25%
Political lean MEDSL · Dallas
- 2024 margin
- Strong D (+22.2) · D 60.2% · R 38.0% · Other 1.8%
- 2008→2024 swing
- +6.9pp toward D · 2008: 15.3pp · 2024: 22.2pp
- All cycles
- 2024: D+22.2 2020: D+31.6 2016: D+26.2 2012: D+15.4 2008: D+15.3
Not yet ingested
- Civics
- —
Market trends
- HPI YoY
- ▼ -72.36%
- Current HPI
- 356.2348
- Rent YoY
- ▼ -2.75%
- Metro
- Dallas-Fort Worth-Arlington, TX
- State GDP YoY
- ▲ 3.95%
- F500 in state
- 110
Industry mix (Fortune 500 HQ in TX)
| Industry | F500 HQs | Revenue |
|---|---|---|
| Energy | 16 | $1,198B |
|
||
| Technology | 5 | $198B |
|
||
| Engineering / Construction | 4 | $72B |
|
||
| Energy Services | 3 | $60B |
|
||
| Utilities | 3 | $41B |
|
||
| Healthcare | 2 | $330B |
|
||
Price history
-16.7% since first listed4 events — show timeline
- 2026-05-31 Pending — NTREIS
- 2026-05-27 Contingent — NTREIS
- 2026-05-18 Price Changed $150,000 NTREIS
- 2026-04-02 Listed $180,000 NTREIS
Property tax history
+9.5%/yrLatest (2025): $4,205 · -0.4% YoY. Source: county tax records.
Cash-flow waterfall
monthlySold comps — $/sqft
last 12 mo · ≤1 miLoading sold comps…