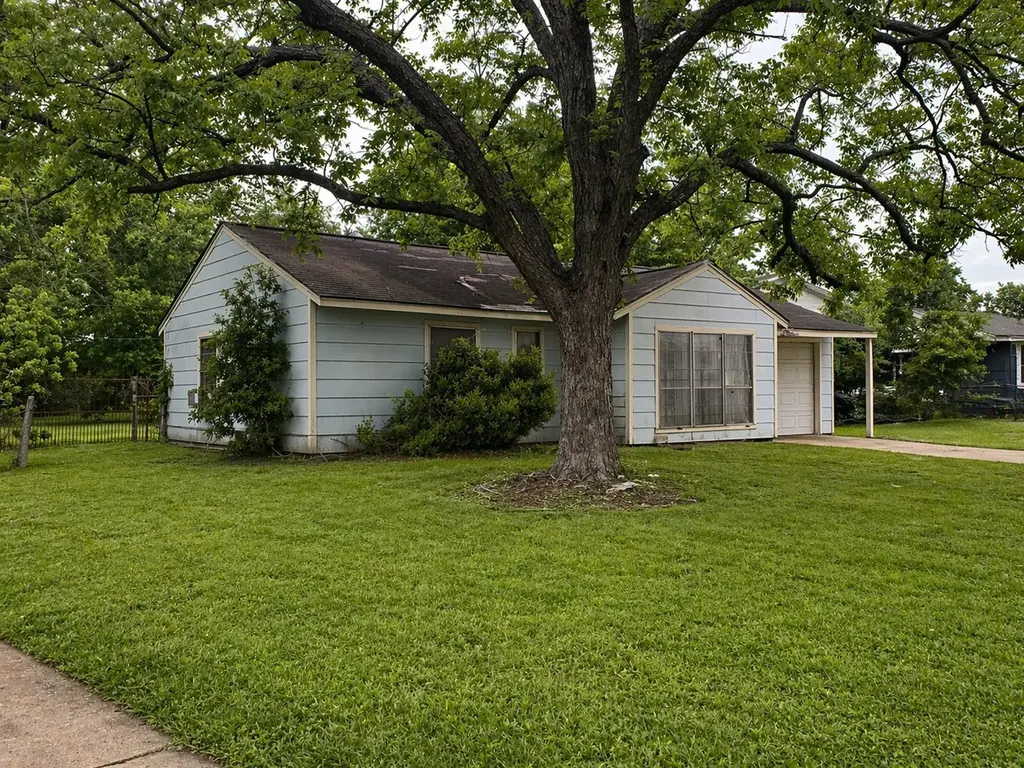
5707 Glenhurst Dr · Houston, TX
Flood risk 6/10 · Moderate
- FEMA flood zone
- X (unshaded)
- Chance of flooding over 30 yrs
- 0.68%
- Est. flood insurance / yr
- $507 – $1,088
Fire risk 1/10 · Minimal
- Est. fire insurance / yr
- $1,222 – $2,270
Heat risk 9/10 · Severe
- Hot days now (above 109°F)
- 7 days/yr
- Hot days in 30 yrs
- 24 days/yr
Wind risk 9/10 · Severe
- Chance of severe wind over 30 yrs
- 99.0%
Air-quality risk 2/10 · Minimal
- Unhealthy air days now
- 2 days/yr
- Unhealthy air days in 30 yrs
- 2 days/yr
Risk factors via First Street. Map © Google.
Why this score? — see what drove the C+ grade
The composite is a weighted blend of 9 inputs, each scored 0–100. Each bar is that input's sub-score; the figure is the points it added to the 100-point composite (weight × sub-score).
- Cash flow +22.0/30.0
- ARV discount +15.0/15.0
- DSCR +7.0/10.0
- 1% rule +6.6/10.0
- Rent growth +3.9/5.0
- Livability +3.7/5.0
- Schools +2.7/10.0
- Condition / age +2.5/5.0
- Appreciation +0.0/10.0
$119,900
🖨 Deal sheet 📄 Offer letter ✓ Due diligence
Listing remarks
Welcome to 5707 Glenhurst Drive, a charming 3-bedroom, 1-bath home situated on an incredible 11,524 sq ft lot offering endless potential for future growth and expansion. This property features a 1 car garage and is nestled in a well established neighborhood known for its character and convenience. Ideally located near major freeways, you'll enjoy quick and easy access to Downtown Houston, making commuting, dining, and entertainment a breeze. The area is experiencing exciting growth, with new duplex developments on the same street, making this an excellent opportunity for homeowners and investors alike. Whether you're looking to move in, renovate , or build, this property presents a unique c
Key facts
- 11
- 524 sq ft lot
- 1 car garage
Tags
Property features AI
Finance
- Financial info: Lease not considered
Exterior
- Parking: Attached garage (1 car)
- Utilities: Public water; Public sewer
- Home design: Residential property; Faces east
- Construction: Built in 1940; Slab foundation; Composition roof; Construction materials: Unknown
- Exterior features: Fully fenced private yard; Back yard fencing; Cleared lot in a subdivision
Interior
- Kitchen: Electric oven; Gas cooktop; Garbage disposal
- Bedrooms: Primary bedroom on the first floor (approx. 10 x 13); Bedroom on the second floor (approx. 10 x 11); Bedroom on the third floor (approx. 9.8 x 10); Up to 3 bedrooms possible
- Flooring: Carpet; Wood
- Bathrooms: 1 full bathroom
- Heating & cooling: Window unit heating; Window unit cooling
- Interior features: Kitchen/family room combo; Kitchen/dining combo; Tub with shower
- Laundry & utility: Washer hookup; Electric dryer hookup
Neighborhood map
What this means for you Summary
Snapshot
- This is a 2-bed/1.0-bath single-family listed at $120k.
Deal economics
- At list price, monthly cash flow is $191 ($2k/yr) — positive.
- The deal already cash-flows at list — no discount required.
- Meets the 1% rule at list price ($1k rent vs $120k).
- Recommended offer: $116k (3.0% below list) — sets the bar for market timing.
- Cap rate 8.2% vs local median 3.2% in Houston — top-decile yield for the area; either an underpriced asset or a hidden risk that comps aren't pricing in. Stress-test before assuming the spread holds.
Location & tenants
- Location reads 74/100 on livability (#184 in TX, #4,771 nationally) — a middle-class / working-renter tenant base. Strengths: amenities A+, cost of living A+, housing A+; Watch: crime F.
- Houston ISD (urban): math 27% / reading 35% proficiency, ranked #593 of 826 in TX (top 72%) — families likely to look elsewhere, expect single-tenant / working-renter base with shorter leases; 71% free/reduced lunch — lower-income household profile, screen leases tightly.
- Zoned schools: Attucks Middle (math 15% / reading 22%, grade F, #1,478 of 1,662 statewide, top 90%, 439 students, 98% FRL); Sterling H S (math 16% / reading 27%, grade F, #1,377 of 1,632 statewide, top 85%, 1,421 students, 92% FRL) — zoned schools average 95% FRL vs 71% district-wide (24 pts higher); higher-poverty schools than district average — tighter screening recommended.
- Market conditions: Rents rising fast (+5.5%/yr); 338 active listings in the ZIP; 12 comparable units currently listed for rent nearby; rentals lingering (median 44d on market — plan ~5-8 weeks vacancy on turnover, expect pricing pressure); 50% of comp listings sitting > 30 days — soft ceiling on asking rent; lower-income renter base — watch delinquency; 29,883 units permitted in Harris County in 2024 (8,621 in 5+ unit buildings).
- This rent runs 44% of the median local income ($38k/yr) — at the standard rent-burdened threshold; future hikes will face affordability resistance.
Forward outlook
- Local home prices are declining (-3.0%/yr); year-one equity from $829 of loan paydown is wiped out by about $4k of value loss. Plan a longer hold.
- Harris County population projected at +47% by 2050 — long-run rental-demand tailwind backs the buy-and-hold thesis.
- At projected returns (-3.0% appreciation + 5.5% rent growth), your $34k cash investment doubles in ~10 years — after that, you're playing with house money.
Negotiation context
- It's been on market 56 days — a 3% lower offer ($116k) is reasonable based on typical stale-listing flexibility.
- 2 sale attempts; this cycle's ask has dropped $20k (14%) from the opening price — seller is motivated, your offer sets the floor, not the list.
Risks & watch-outs
- Watch-outs: built in 1940 — expect roof / HVAC / electrical / plumbing capex.
- Climate carrying-cost: major flood risk; severe wind risk, 99% chance of damaging wind over 30y; extreme-heat days projected 7→24/yr by 2055 (HVAC capex compounding) — expect insurance premiums to compound above CPI over the hold.
Questions for the listing agent
- It's been on market 56 days. Have you received any prior offers? Is the seller open to a 3% concession, seller financing, or rate buy-down credit?
- Built in 1940 — when were the roof, HVAC, electrical panel, plumbing, and water heater last replaced?
- Is there a deadline driving the sale (1031 exchange, divorce, estate, relocation)? That informs how much negotiation room exists.
- Schools are D-rated, which usually means shorter tenancies and higher turnover. Who's the typical renter profile here, and what's been the actual vacancy rate?
- Crime grade is F in this area — have there been break-ins, vandalism, or insurance claims at this property in the last 3 years? What carrier currently insures it and at what premium?
- What's the average days-on-market for RENTAL listings here right now (not sales)? A rising rental-DOM trend means longer vacancies and softer asking-rent achievability than the comps imply.
- What's the recent tenant-quality profile in this submarket — average credit score on applications, eviction rate, late-payment / NSF rate, and stable-employment percentage? A property-management company in the area should have these aggregated.
- How much new for-sale + rental construction is in the pipeline within 1–3 miles? Heavy new supply typically softens prices + rents 12–24 months out; constrained supply supports both.
Investment metrics
- 1% rule
- 1.16% ✓
- Cap rate
- 8.20%
- Cash-on-cash
- 6.82%
- DSCR
- 1.30
- GRM
- 7.2
CMA / ARV
- ARV (median comp)
- $157,921
- List price
- $119,900
- Delta
- -24.08%
- Verdict
- UNDERPRICED
- Comps
- 20 within 1.0 mi
Show comp detail 12 sales within ~0.75 mi
| Address | Dist | Beds/Ba | Sqft | Sold | Price | $/sf | Match |
|---|---|---|---|---|---|---|---|
| 5774 Belmark St | 0.53mi | 2/1.0 | 936 (+4%) | 11mo | $70,000 | $75 | 59 |
| 5934 Longmeadow St | 0.37mi | 2/1.0 | 1,017 (+14%) | 3mo | $104,900 | $103 | 58 |
| 6038 Glenhurst Dr | 0.58mi | 2/1.0 | 840 (-6%) | 10mo | $69,000 | $82 | 54 |
| 8130 Rockford Dr | 0.59mi | 3/1.0 (+1) | 945 (+6%) | 9mo | $169,999 | $180 | 51 |
| 8130 Sharondale Dr | 0.51mi | 3/1.0 (+1) | 862 (-4%) | 18mo | $110,000 | $128 | 50 |
| 5622 Beldart St | 0.69mi | 2/1.0 | 1,002 (+12%) | 1mo | $120,000 | $120 | 47 |
| 5022 Ridgeway Dr | 0.66mi | 3/1.0 (+1) | 912 (+2%) | 17mo | $115,000 | $126 | 47 |
| 7343 Mountbatten Rd | 0.51mi | 2/1.0 | 965 (+8%) | 21mo | $95,000 | $98 | 46 |
| 5330 Pershing St | 0.43mi | 3/1.0 (+1) | 1,002 (+12%) | 16mo | $133,000 | $133 | 42 |
| 5939 Belcrest St | 0.70mi | 3/1.5 (+1) | 806 (-10%) | 9mo | $160,000 | $199 | 36 |
| 5301 Burma Rd | 0.57mi | 3/1.0 (+1) | 992 (+11%) | 19mo | $109,900 | $111 | 34 |
| 8146 St Lo Rd | 0.59mi | 3/1.0 (+1) | 1,010 (+13%) | 20mo | $115,000 | $114 | 30 |
Match score weights: distance 35% · size 25% · config 20% · recency 20%. Top-matched comps best support the ARV.
Projected returns pro-forma
-3.0% appreciation · 5.45% rent growth · sell at horizon
- IRR
- -2.9%
- Equity multiple
- 0.89×
- Total profit
- $-3,708
- Equity at exit
- $17,877
- IRR
- 9.6%
- Equity multiple
- 1.83×
- Total profit
- $27,818
- Equity at exit
- $10,367
Cash invested: $33,572 (down + closing). Projections, not guarantees.
Landlord ↔ Tenant lean methodology
- Overall (STATE)
- 87 Strongly Landlord-Friendly
- State Texas
- 87 Strongly Landlord-Friendly · R+5
- County
- — inherits STATE
- City
- — inherits STATE
ZIP-level market 77033
- Home prices YoY
- -16.3%
- Rents YoY
- 5.5%
- Active inventory
- 338
- Price-to-rent
- 7.2×
Monthly cashflow live
- Estimated rent
- $1,388 high interval (Pro) →
- Mortgage (P&I)
- −$629
- Tax from tax record
- −$227 /mo · $2,728/yr
- Insurance
- −$50
- HOA
- −$0
- Vacancy / Maint / Mgmt
- −$292
- Net cashflow
- $191
Break-even live
UW: 25.0% down · 7.5% · 30yr · 1.5% tax · 5.0% vac · 8.0% maint · 8.0% mgmt
Financing live
Cash to close
- Down payment
- $29,975
- Closing costs
- $3,597
- Reserves months
- —
- Total cash needed
- —
Loan-product check · same deal, 3 products live
Conventional
25% down · 7.5% · 30yr
- Down + closing
- —
- Monthly P&I
- —
- Monthly cashflow
- —
- DSCR
- —
- Eligible?
- —
Personal DTI + credit; lowest rate.
DSCR
20% down · 8.5% · 30yr
- Down + closing
- —
- Monthly P&I
- —
- Monthly cashflow
- —
- DSCR
- —
- Eligible?
- —
No personal income docs; deal must DSCR.
Hard money
10% down · 12.0% · 12mo
- Down + closing
- —
- Monthly P&I
- —
- Monthly cashflow
- —
- DSCR
- —
- Eligible?
- —
Short-term bridge; refi at stabilization.
Rent comps 12 comps
| Address | Beds | Baths | Sqft | Rent | $/sqft | DOM | Units | Dist |
|---|---|---|---|---|---|---|---|---|
| 5314 Northridge Dr Unit A Houston, TX | 3.0 | 2.0 | 872 | $1,185 | $1.36 | 43d | 1 | 0.45mi |
| 7918 Jutland Rd Houston, TX | 3.0 | 1.0 | 996 | $1,295 | $1.30 | 43d | 1 | 0.69mi |
| 5537 Bataan Rd Houston, TX | 2.0 | 1.0 | 880 | $1,300 | $1.48 | 43d | 1 | 0.96mi |
| 6066 Belarbor St Houston, TX | 1.0 | 1.0 | 550 | $795 | $1.45 | 43d | 1 | 0.97mi |
| 5042 Mallow St Houston, TX | 2.0 | 1.0 | 672 | $995 | $1.48 | 5d | 1 | 1.02mi |
| 7818 Calhoun Rd Unit 8 Houston, TX | 2.0 | 1.0 | 800 | $1,200 | $1.50 | 43d | 1 | 1.13mi |
| 5038 Carmen St Apt 1 Houston, TX | 2.0 | 1.0 | 672 | $1,095 | $1.63 | 2d | 1 | 1.19mi |
| 5010 Carmen St Houston, TX | 2.0 | 1.0 | 672 | $1,095 | $1.63 | 43d | 1 | 1.21mi |
| 4615 Redbud St Unit b Houston, TX | 3.0 | 2.0 | 872 | $1,149 | $1.32 | 24d | 1 | 1.24mi |
| 4609 Bricker St Unit C Houston, TX | 2.0 | 1.5 | 1100 | $3,200 | $2.91 | 12d | 1 | 1.25mi |
| 8521 Dosia St Houston, TX | 3.0 | 2.0 | 1028 | $1,665 | $1.62 | 12d | 1 | 1.35mi |
| 4923 Paula St Apt 2 Houston, TX | 2.0 | 1.0 | 672 | $1,095 | $1.63 | 2d | 1 | 1.35mi |
Listing history 15 events
-
2026-06-18days on market $119,900 Pending 56 DOM
-
2026-06-17days on market $119,900 Pending 55 DOM
-
2026-06-16days on market $119,900 Pending 54 DOM
-
2026-06-15days on market $119,900 Pending 53 DOM
-
2026-06-13days on market $119,900 Pending 51 DOM
-
2026-06-10days on market $119,900 Pending 47 DOM
-
2026-06-08days on market $119,900 Pending 46 DOM
-
2026-06-07days on market $119,900 Pending 45 DOM
-
2026-06-04statusdays on market $119,900 Pending 42 DOM
-
2026-06-01days on market $119,900 Active 39 DOM
-
2026-05-31days on market $119,900 Active 38 DOM
-
2026-05-07price $129,900 867-char remark
-
2026-04-23$139,990 Active 867-char remark
-
1998-04-03soldstatus
-
1998-03-31soldstatus
ⓘ Source: listings_history table (triggers on properties + properties_extension) + one-shot
backfill from property_details.listing_events for pre-trigger history.
Tax reassessment forecast TX · Resets to sale price
- Current annual tax
- $2,728 · $227/mo
- Projected year-2 tax
- $2,728 · $227/mo
- Expected delta
- $0/yr ($0/mo · 0.0%)
ⓘ Screening estimate from a state-policy table — verify with the county assessor before closing.
Climate risk First Street
- Flood 6/10 Major FEMA zone X (unshaded) · 68% chance over 30 yrs
- Wildfire 1/10 Low
- Heat 9/10 Extreme 7 d/yr ≥109°F today · 24 d/yr by 30 yrs out
- Wind 9/10 Extreme 99% chance of damaging wind over 30 yrs
- Air quality 2/10 Low 2 unhealthy d/yr today · 2 by 30 yrs out
Nearby sold comps map
Loading sold comps map…
Walkable amenities ~0.75 mi
Loading nearby amenities…
Taxation est. · year 1
- Rental income
- $16,660
- − Mortgage interest
- −$6,716
- − Property taxes
- −$2,728
- − Insurance
- −$600
- − Repairs & maintenance
- −$1,333
- − Management
- −$1,333
- − Depreciation
- −$3,488
- Taxable income
- $462
- Est. tax owed @ 24.0%
- −$111
- After-tax cash flow
- $2,178/yr
For passive investors: Depreciation is non-cash, so a rental often shows a tax loss while cash-flowing — sheltering income. Rental losses are passive: they offset passive income freely, and up to $25,000/yr can offset ordinary (W-2) income if you actively participate and your MAGI is under $100k (phasing out to $0 by $150k); unused losses carry forward. On sale, claimed depreciation is recaptured at up to 25%, and gains may owe capital-gains tax (a 1031 exchange can defer both). Figures are a year-1 estimate at your 24.0% rate — not tax advice; consult a CPA.
Schools (NCES district)
- District
- Houston ISD
- NCES district ID
- 4823640
- Math proficiency
- 27% ▼ -18.00%
- Reading proficiency
- 35% ▼ -6.00%
- Median HH income
- $46,054
- Composite
- 26.63/100
- National rank
- #7173
- State rank
- #593 of 826 in TX
Livability — Houston
- Score
- 74/100
- State rank
- #184
- US rank
- #4771
Category grades
Schools grade is shown separately in the Schools card above.
Census & demographics
- Census place
- Houston, TX
- County
- Harris County · 4,702,590 people
- City population
- 3,226,434
- Metro
- Houston-The Woodlands-Sugar Land, TX
- Population (ZIP)
- 29,154
- Household income
- $38,071
- Rent vs Own
- Severe rent burden
- 1728.0
Population outlook (Harris County) Hauer SSP2
- Today (2025)
- 5,571,493 people
- By 2030
- 6,089,821 · +9.3%
- By 2040
- 7,142,806 · +28.2%
- By 2050
- 8,185,864 · +46.9%
- By 2075
- 10,574,329 · +89.8%
- By 2100
- 12,109,958 · +117.4%
Race, ethnicity, and origin ACS 2023
- Neighborhood character
- Majority Black (55%)
- Race & ethnicity
- Black 55% Hispanic / Latino 43% Two or more races 17% Native American 1%
- Hispanic origin (detail)
- Mexican 35%
- Common ancestry
- Lithuanian 1%
- Foreign-born
- 18% · Canada
- Languages at home
- 61% English-only · Spanish 39%
Political lean MEDSL · Harris
- 2024 margin
- Lean D (+5.5) · D 52.0% · R 46.4% · Other 1.6%
- 2008→2024 swing
- +3.9pp toward D · 2008: 1.6pp · 2024: 5.5pp
- All cycles
- 2024: D+5.5 2020: D+13.3 2016: D+12.4 2012: D+0.1 2008: D+1.6
Not yet ingested
- Civics
- —
Market trends
- HPI YoY
- ▼ -41.49%
- Current HPI
- 212.6472
- Rent YoY
- ▲ 5.45%
- Metro
- Houston-The Woodlands-Sugar Land, TX
- State GDP YoY
- ▲ 3.95%
- F500 in state
- 110
Industry mix (Fortune 500 HQ in TX)
| Industry | F500 HQs | Revenue |
|---|---|---|
| Energy | 16 | $1,198B |
|
||
| Technology | 5 | $198B |
|
||
| Engineering / Construction | 4 | $72B |
|
||
| Energy Services | 3 | $60B |
|
||
| Utilities | 3 | $41B |
|
||
| Healthcare | 2 | $330B |
|
||
Price history
-14.4% since first listed8 events — show timeline
- 2026-06-13 Pending — HARMLS
- 2026-06-13 Relisted — HARMLS
- 2026-06-04 Pending — HARMLS
- 2026-05-29 Price Changed $119,900 HARMLS
- 2026-05-07 Price Changed $129,900 HARMLS
- 2026-04-23 Listed $139,990 HARMLS
- 1998-04-03 Sold (Public Records) — Public Records
- 1998-03-31 Sold (Public Records) — Public Records
Property tax history
+4.3%/yrLatest (2025): $2,728 · +8.7% YoY. Source: county tax records.
Cash-flow waterfall
monthlySold comps — $/sqft
last 12 mo · ≤1 miLoading sold comps…