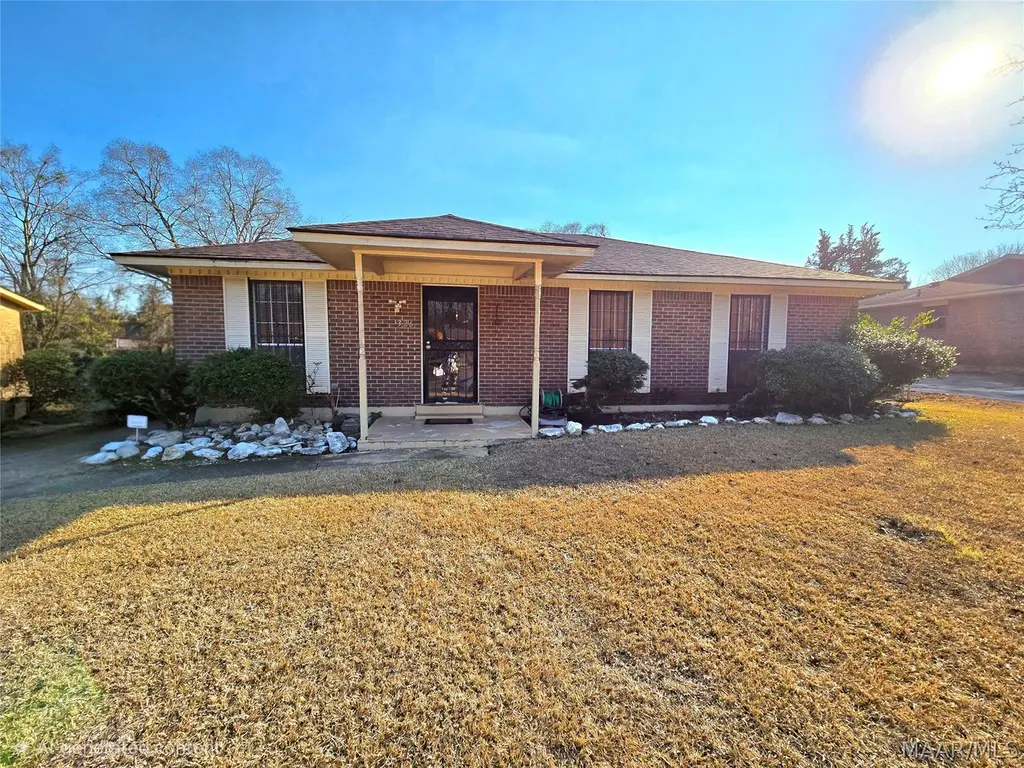
326 Winderton Dr · Montgomery, AL
Flood risk 1/10 · Minimal
- FEMA flood zone
- X (unshaded)
- Chance of flooding over 30 yrs
- 0.0%
- Est. flood insurance / yr
- $507 – $1,088
Fire risk 2/10 · Minimal
- Est. fire insurance / yr
- $916 – $1,700
Heat risk 8/10 · Major
- Hot days now (above 108°F)
- 7 days/yr
- Hot days in 30 yrs
- 21 days/yr
Wind risk 8/10 · Major
- Chance of severe wind over 30 yrs
- 80.0%
Air-quality risk 2/10 · Minimal
- Unhealthy air days now
- 1 days/yr
- Unhealthy air days in 30 yrs
- 1 days/yr
Risk factors via First Street. Map © Google.
Why this score? — see what drove the C+ grade
The composite is a weighted blend of 9 inputs, each scored 0–100. Each bar is that input's sub-score; the figure is the points it added to the 100-point composite (weight × sub-score).
- Cash flow +29.1/30.0
- DSCR +10.0/10.0
- 1% rule +7.4/10.0
- Appreciation +6.4/10.0
- Livability +3.2/5.0
- Rent growth +2.5/5.0
- Condition / age +2.5/5.0
- Schools +1.7/10.0
- ARV discount +0.0/15.0
$105,000
🖨 Deal sheet 📄 Offer letter ✓ Due diligence
Listing remarks MLS
This 3 bedroom, 1.5 bath home offers peace of mind with big-ticket items already done, including a new roof and HVAC installed in 2025, plus fresh interior paint in 2025. Inside, you’ll find a functional layout with the dining room open to the kitchen, new carpet, and new LVP flooring. The home is all electric. The water heater was installed in 2005, with all new electrical run to it in 2025. Enjoy outdoor living with a screened-in back porch featuring a new remote-controlled ceiling fan, plus a separate patio overlooking a fully fenced backyard—perfect for relaxing or entertaining. Two refrigerators and washer/dryer are negotiable with an acceptable offer. A solid home with recent upgrades, ready for its next owner. Sold As Is
Key facts
- New carpet
- New hvac
- Fresh interior paint
Tags
Neighborhood map
What this means for you Summary
Snapshot
- This is a 3-bed/2.0-bath single-family listed at $105k.
Deal economics
- At list price, monthly cash flow is $362 ($4k/yr) — positive.
- The deal already cash-flows at list — no discount required.
- Meets the 1% rule at list price ($1k rent vs $105k).
- Recommended offer: $96k (9.0% below list) — sets the bar for market timing.
- Cap rate 10.4% vs local median 6.0% in Montgomery — top-decile yield for the area; either an underpriced asset or a hidden risk that comps aren't pricing in. Stress-test before assuming the spread holds.
Location & tenants
- Location reads 65/100 on livability (#138 in AL) — a middle-class / working-renter tenant base. Strengths: cost of living A+, housing A+; Watch: schools C-, employment D, crime F.
- Montgomery County (urban): math 9% / reading 31% proficiency, ranked #106 of 129 in AL (top 82%) — low school quality limits family demand, transient renter base, plan for 1-2y turnover; 70% free/reduced lunch — lower-income household profile, screen leases tightly.
- Market conditions: 65 active listings in the ZIP; 8 comparable units currently listed for rent nearby; rentals lingering (median 44d on market — plan ~5-8 weeks vacancy on turnover, expect pricing pressure); 62% of comp listings sitting > 30 days — soft ceiling on asking rent; 460 units permitted in Montgomery County in 2024 (37 in 5+ unit buildings).
Forward outlook
- In year one you build about $4k of equity ($726 loan paydown + $3k appreciation (2.7% local appreciation)).
- Montgomery County population projected to shrink 8% by 2050 — rents likely to lag national; underwrite the cash flow, not the appreciation.
- At projected returns (2.7% appreciation + 3.0% rent growth), your $29k cash investment doubles in ~4 years — after that, you're playing with house money.
- By year 9, paydown + projected appreciation supports a ~$30k cash-out refi (75% LTV) — recoverable capital for the next deal without selling this one.
Negotiation context
- It's been on market 110 days — a 9% lower offer ($96k) is reasonable based on typical stale-listing flexibility.
- 2 sale attempts since 21y ago with the ask held roughly flat each time — persistent listings suggest the price (not the market) is what's stuck; bring a comps-based counter.
- Current owner paid $82k; 27% above their basis — modest negotiation headroom, anchor on the comps not their cost.
Risks & watch-outs
- Climate carrying-cost: severe wind risk, 80% chance of damaging wind over 30y; extreme-heat days projected 7→21/yr by 2055 (HVAC capex compounding) — expect insurance premiums to compound above CPI over the hold.
Questions for the listing agent
- It's been on market 110 days. Have you received any prior offers? Is the seller open to a 9% concession, seller financing, or rate buy-down credit?
- Built in 1973 — when were the roof, HVAC, electrical panel, plumbing, and water heater last replaced?
- Why hasn't it sold? Are there any deal-killer items the seller is aware of (foundation, flood, title, zoning, code violations)?
- Is there a deadline driving the sale (1031 exchange, divorce, estate, relocation)? That informs how much negotiation room exists.
- Crime grade is F in this area — have there been break-ins, vandalism, or insurance claims at this property in the last 3 years? What carrier currently insures it and at what premium?
- What's the average days-on-market for RENTAL listings here right now (not sales)? A rising rental-DOM trend means longer vacancies and softer asking-rent achievability than the comps imply.
- What's the recent tenant-quality profile in this submarket — average credit score on applications, eviction rate, late-payment / NSF rate, and stable-employment percentage? A property-management company in the area should have these aggregated.
- How much new for-sale + rental construction is in the pipeline within 1–3 miles? Heavy new supply typically softens prices + rents 12–24 months out; constrained supply supports both.
Investment metrics
- 1% rule
- 1.24% ✓
- Cap rate
- 10.43%
- Cash-on-cash
- 14.79%
- DSCR
- 1.66
- GRM
- 6.7
CMA / ARV
- ARV (median comp)
- $84,014
- List price
- $105,000
- Delta
- 24.98%
- Verdict
- OVERPRICED
- Comps
- 20 within 1.0 mi
Show comp detail 12 sales within ~0.75 mi
| Address | Dist | Beds/Ba | Sqft | Sold | Price | $/sf | Match |
|---|---|---|---|---|---|---|---|
| 344 Bitford Way | 0.16mi | 3/2.0 | 1,290 (+8%) | 2mo | $110,000 | $85 | 76 |
| 631 Green Leaf Dr | 0.29mi | 3/2.0 | 1,170 (-2%) | 9mo | $119,000 | $102 | 76 |
| 5163 Rush Dr | 0.31mi | 3/2.0 | 1,236 (+4%) | 7mo | $100,500 | $81 | 73 |
| 222 Winderton Dr | 0.25mi | 3/1.5 | 1,247 (+5%) | 7mo | $65,501 | $53 | 73 |
| 308 Upton Rd | 0.25mi | 3/2.0 | 1,301 (+9%) | 3mo | $87,000 | $67 | 71 |
| 700 Southlawn Dr | 0.45mi | 3/2.0 | 1,134 (-5%) | 1mo | $109,000 | $96 | 70 |
| 421 Jeffrey Dr | 0.35mi | 3/2.0 | 1,260 (+6%) | 6mo | $107,000 | $85 | 68 |
| 5302 Connie Cir | 0.62mi | 3/2.0 | 1,194 (+0%) | 5mo | $85,000 | $71 | 66 |
| 5404 W Shades Valley Dr | 0.69mi | 3/2.0 | 1,122 (-6%) | 6mo | $95,000 | $85 | 53 |
| 5118 Greensboro Dr | 0.45mi | 3/1.0 | 1,080 (-9%) | 10mo | $80,000 | $74 | 52 |
| 115 Kingswood Rd | 0.34mi | 3/1.0 | 1,014 (-15%) | 7mo | $38,000 | $37 | 50 |
| 5433 Rolind Dr | 0.73mi | 3/2.0 | 1,268 (+7%) | 8mo | $106,000 | $84 | 48 |
Match score weights: distance 35% · size 25% · config 20% · recency 20%. Top-matched comps best support the ARV.
Projected returns pro-forma
2.71% appreciation · 3.0% rent growth · sell at horizon
- IRR
- 20.7%
- Equity multiple
- 2.16×
- Total profit
- $34,093
- Equity at exit
- $45,488
- IRR
- 22.1%
- Equity multiple
- 4.10×
- Total profit
- $91,050
- Equity at exit
- $68,790
Cash invested: $29,400 (down + closing). Projections, not guarantees.
Landlord ↔ Tenant lean methodology
- Overall (STATE)
- 90 Strongly Landlord-Friendly
- State Alabama
- 90 Strongly Landlord-Friendly · R+15
- County
- — inherits STATE
- City
- — inherits STATE
ZIP-level market 36108
- Home prices YoY
- 2.9%
- Active inventory
- 65
- Price-to-rent
- 6.7×
Monthly cashflow live
- Estimated rent
- $1,302 high interval (Pro) →
- Mortgage (P&I)
- −$551
- Tax from tax record
- −$72 /mo · $858/yr
- Insurance
- −$44
- HOA
- −$0
- Vacancy / Maint / Mgmt
- −$273
- Net cashflow
- $362
Break-even live
UW: 25.0% down · 7.5% · 30yr · 1.5% tax · 5.0% vac · 8.0% maint · 8.0% mgmt
Financing live
Cash to close
- Down payment
- $26,250
- Closing costs
- $3,150
- Reserves months
- —
- Total cash needed
- —
Loan-product check · same deal, 3 products live
Conventional
25% down · 7.5% · 30yr
- Down + closing
- —
- Monthly P&I
- —
- Monthly cashflow
- —
- DSCR
- —
- Eligible?
- —
Personal DTI + credit; lowest rate.
DSCR
20% down · 8.5% · 30yr
- Down + closing
- —
- Monthly P&I
- —
- Monthly cashflow
- —
- DSCR
- —
- Eligible?
- —
No personal income docs; deal must DSCR.
Hard money
10% down · 12.0% · 12mo
- Down + closing
- —
- Monthly P&I
- —
- Monthly cashflow
- —
- DSCR
- —
- Eligible?
- —
Short-term bridge; refi at stabilization.
Rent comps 8 comps
| Address | Beds | Baths | Sqft | Rent | $/sqft | DOM | Units | Dist |
|---|---|---|---|---|---|---|---|---|
| 350 Southlawn Dr Montgomery, AL | 4.0 | 2.0 | 1332 | $1,400 | $1.05 | 13d | 1 | 0.13mi |
| 350 Southlawn Dr Montgomery, AL | 4.0 | 2.0 | 1332 | $1,400 | $1.05 | 43d | 1 | 0.13mi |
| 5125 E Linda Cir Montgomery, AL | 4.0 | 2.0 | 1497 | $1,450 | $0.97 | 43d | 1 | 0.22mi |
| 636 Green Leaf Dr Montgomery, AL | 4.0 | 2.0 | 1365 | $1,350 | $0.99 | 21d | 1 | 0.31mi |
| 5002 Greensboro Ct Montgomery, AL | 3.0 | 1.5 | 1100 | $1,195 | $1.09 | 43d | 1 | 0.35mi |
| 5190 Greensboro Dr Montgomery, AL | 3.0 | 1.5 | 1220 | $895 | $0.73 | 21d | 1 | 0.35mi |
| 5154 Greensboro Dr Montgomery, AL | 3.0 | 1.5 | 1430 | $1,250 | $0.87 | 43d | 1 | 0.41mi |
| 5101 Levenson Rd Montgomery, AL | 3.0 | 2.0 | 1182 | $1,000 | $0.85 | 43d | 1 | 0.55mi |
Listing history 6 events
-
2026-05-30days on market $105,000 Active 110 DOM
-
2026-02-09$105,000 Active 755-char remark
Show marketing remark (755 chars)
This 3 bedroom, 1.5 bath home offers peace of mind with big-ticket items already done, including a new roof and HVAC installed in 2025, plus fresh interior paint in 2025. Inside, you’ll find a functional layout with the dining room open to the kitchen, new carpet, and new LVP flooring. The home is all electric. The water heater was installed in 2005, with all new electrical run to it in 2025. Enjoy outdoor living with a screened-in back porch featuring a new remote-controlled ceiling fan, plus a separate patio overlooking a fully fenced backyard—perfect for relaxing or entertaining. Two refrigerators and washer/dryer are negotiable with an acceptable offer. A solid home with recent upgrades, ready for its next owner. Sold As Is
-
2025-12-18soldstatus $82,500
-
2006-02-16soldstatus $56,500
-
2006-02-03soldstatus $56,500 55-char remark
Show marketing remark (55 chars)
Very tidy house. House has been remodeled and expanded.
-
2005-08-09$56,560 55-char remark
Show marketing remark (55 chars)
Very tidy house. House has been remodeled and expanded.
ⓘ Source: listings_history table (triggers on properties + properties_extension) + one-shot
backfill from property_details.listing_events for pre-trigger history.
Tax reassessment forecast AL · Resets to sale price
- Current annual tax
- $858 · $72/mo
- Projected year-2 tax
- $858 · $72/mo
- Expected delta
- $0/yr ($0/mo · 0.0%)
ⓘ Screening estimate from a state-policy table — verify with the county assessor before closing.
Climate risk First Street
- Flood 1/10 Low FEMA zone X (unshaded) · 0% chance over 30 yrs
- Wildfire 2/10 Low
- Heat 8/10 Severe 7 d/yr ≥108°F today · 21 d/yr by 30 yrs out
- Wind 8/10 Severe 80% chance of damaging wind over 30 yrs
- Air quality 2/10 Low 1 unhealthy d/yr today · 1 by 30 yrs out
Nearby sold comps map
Loading sold comps map…
Walkable amenities ~0.75 mi
Loading nearby amenities…
Taxation est. · year 1
- Rental income
- $15,620
- − Mortgage interest
- −$5,882
- − Property taxes
- −$858
- − Insurance
- −$525
- − Repairs & maintenance
- −$1,250
- − Management
- −$1,250
- − Depreciation
- −$3,055
- Taxable income
- $2,801
- Est. tax owed @ 24.0%
- −$672
- After-tax cash flow
- $3,677/yr
For passive investors: Depreciation is non-cash, so a rental often shows a tax loss while cash-flowing — sheltering income. Rental losses are passive: they offset passive income freely, and up to $25,000/yr can offset ordinary (W-2) income if you actively participate and your MAGI is under $100k (phasing out to $0 by $150k); unused losses carry forward. On sale, claimed depreciation is recaptured at up to 25%, and gains may owe capital-gains tax (a 1031 exchange can defer both). Figures are a year-1 estimate at your 24.0% rate — not tax advice; consult a CPA.
Schools (NCES district)
- District
- Montgomery County
- NCES district ID
- 0102430
- Math proficiency
- 9% ▼ -21.00%
- Reading proficiency
- 31% ▼ -1.00%
- Median HH income
- $43,902
- Composite
- 17.24/100
- National rank
- #9093
- State rank
- #106 of 129 in AL
Livability — Montgomery
- Score
- 65/100
- State rank
- #138
- US rank
- #13416
Category grades
Schools grade is shown separately in the Schools card above.
Census & demographics
- Census place
- Montgomery, AL
- City population
- 175,913
- Population (ZIP)
- 15,549
Population outlook (Montgomery County) Hauer SSP2
- Today (2025)
- 224,008 people
- By 2030
- 221,460 · -1.1%
- By 2040
- 214,179 · -4.4%
- By 2050
- 204,912 · -8.5%
- By 2075
- 177,821 · -20.6%
- By 2100
- 145,134 · -35.2%
Race, ethnicity, and origin ACS 2023
- Neighborhood character
- Predominantly Black (82%)
- Race & ethnicity
- Black 82% White 10% Hispanic / Latino 6% Two or more races 2%
- Hispanic origin (detail)
- Mexican 4% Puerto Rican 1%
- Foreign-born
- 2% · Canada
- Languages at home
- 96% English-only · Spanish 3%
Political lean MEDSL · Montgomery
- 2024 margin
- Solid D (+30.7) · D 64.8% · R 34.1% · Other 1.1%
- 2008→2024 swing
- +11.5pp toward D · 2008: 19.2pp · 2024: 30.7pp
- All cycles
- 2024: D+30.7 2020: D+31.5 2016: D+26.2 2012: D+24.3 2008: D+19.2
Not yet ingested
- Civics
- —
Market trends
- HPI YoY
- ▲ 2.71%
- Current HPI
- 95.2405
- Rent YoY
- —
- Metro
- —
- State GDP YoY
- ▲ 2.94%
- F500 in state
- 4
Industry mix (Fortune 500 HQ in AL)
| Industry | F500 HQs | Revenue |
|---|---|---|
| Financial Services | 1 | $8B |
|
||
| Healthcare | 1 | $5B |
|
||
Price history
+85.6% since first listed5 events — show timeline
- 2026-02-09 Listed $105,000 MAAR
- 2025-12-18 Sold (Public Records) $82,500 Public Records
- 2006-02-16 Sold (Public Records) $56,500 Public Records
- 2006-02-03 Sold (MLS) $56,500 MAAR
- 2005-08-09 Listed $56,560 MAAR
Property tax history
+13.9%/yrLatest (2025): $858 · +318.8% YoY. Source: county tax records.
Cash-flow waterfall
monthlySold comps — $/sqft
last 12 mo · ≤1 miLoading sold comps…