515 Crooked Trl · Waskom, TX
Flood risk 1/10 · Minimal
- FEMA flood zone
- X (unshaded)
- Chance of flooding over 30 yrs
- 0.0%
- Est. flood insurance / yr
- $507 – $1,088
Fire risk 4/10 · Minor
- Est. fire insurance / yr
- $1,222 – $2,270
Heat risk 7/10 · Major
- Hot days now (above 111°F)
- 7 days/yr
- Hot days in 30 yrs
- 24 days/yr
Wind risk 6/10 · Moderate
- Chance of severe wind over 30 yrs
- 66.0%
Air-quality risk 1/10 · Minimal
- Unhealthy air days now
- 0 days/yr
- Unhealthy air days in 30 yrs
- 0 days/yr
Risk factors via First Street. Map © Google.
Why this score? — see what drove the B- grade
The composite is a weighted blend of 9 inputs, each scored 0–100. Each bar is that input's sub-score; the figure is the points it added to the 100-point composite (weight × sub-score).
- Cash flow +30.0/30.0
- 1% rule +10.0/10.0
- DSCR +10.0/10.0
- ARV discount +7.5/15.0
- Livability +3.7/5.0
- Schools +3.5/10.0
- Rent growth +2.5/5.0
- Condition / age +2.5/5.0
- Appreciation +0.0/10.0
$54,900
🖨 Deal sheet 📄 Offer letter ✓ Due diligence
Listing remarks MLS
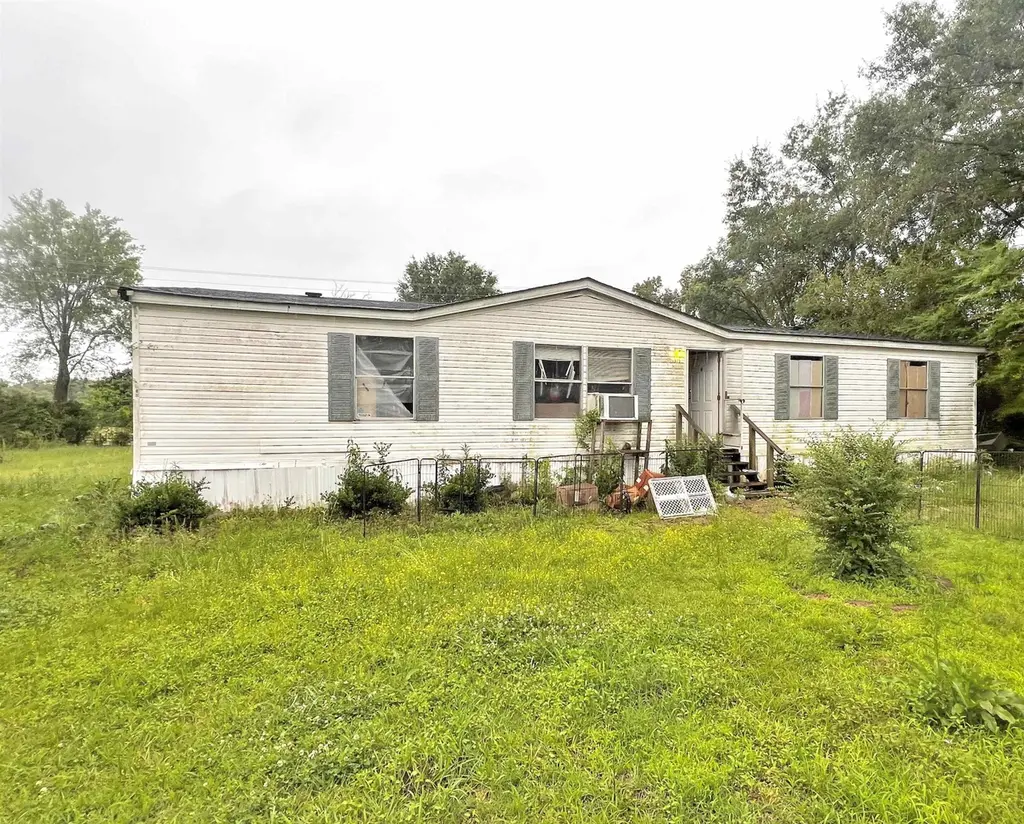
Great opportunity in Waskom! This double-wide mobile home offers 3 bedrooms and 2 bathrooms with the added benefit of owning the land. The home features window unit A/C systems and a spacious layout with plenty of potential. The property needs TLC, making it a great value-add opportunity for buyers or investors looking to customize and build equity. A solid chance to own land and create the space you’ve been looking for!
Key facts
- Owning the land
- 1 acre lot
- Built 1999
Tags
Property features AI
Finance
- Financial info: Listing terms: Cash; Loan type: Treat As Clear; No second mortgage indicated
- HOA & community: No homeowners association
Exterior
- Parking: No covered parking; No carport; no designated parking features
- Utilities: Utilities: Other; Not in a municipal utility district
- Home design: Single family residence; Residential property; One story
- Construction: Built in 1999
- Exterior features: Lot is about 1 acre; Directions available to property
Interior
- Kitchen: Kitchen approximately 15 x 15
- Bedrooms: Primary bedroom (1st level) about 11 x 11; Bedroom (1st level) about 10 x 10; Bedroom (1st level) about 10 x 10
- Bathrooms: 2 full bathrooms
- Interior features: One-level layout; Total of 5 rooms; Living area approximately 1568; General interior features: Other
- Laundry & utility: Washer and Dryer included
Neighborhood map
What this means for you Summary
Snapshot
- This is a 3-bed/2.0-bath manufactured listed at $55k.
Deal economics
- At list price, monthly cash flow is $756 ($9k/yr) — positive.
- The deal already cash-flows at list — no discount required.
- Meets the 1% rule at list price ($1k rent vs $55k).
- Recommended offer: $53k (3.0% below list) — sets the bar for market timing.
Location & tenants
- Location reads 74/100 on livability (#168 in TX, #4,434 nationally) — a middle-class / working-renter tenant base. Strengths: cost of living A+, health & safety A+, housing A; Watch: amenities F, commute F, employment F.
- Waskom ISD (rural): math 38% / reading 43% proficiency, ranked #387 of 826 in TX (top 47%) — families likely to look elsewhere, expect single-tenant / working-renter base with shorter leases.
- Zoned schools: Waskom El (math 32% / reading 37%, grade F, #1,995 of 4,322 statewide, top 50%, 358 students, 71% FRL) — zoned schools average 71% FRL vs 54% district-wide (17 pts higher); higher-poverty schools than district average — tighter screening recommended.
- Market conditions: 54 active listings in the ZIP; 85 units permitted in Harrison County in 2024 (15 in 5+ unit buildings).
Forward outlook
- Local home prices are declining (-3.0%/yr); year-one equity from $380 of loan paydown is wiped out by about $2k of value loss. Plan a longer hold.
- At projected returns (-3.0% appreciation + 3.0% rent growth), your $15k cash investment doubles in ~2 years — after that, you're playing with house money.
Negotiation context
- It's been on market 38 days — a 3% lower offer ($53k) is reasonable based on typical stale-listing flexibility.
- 2 sale attempts; this cycle's ask is 10% above the opening price — seller raised mid-cycle; expect resistance to lowballs.
Risks & watch-outs
- Climate carrying-cost: major wind risk, 66% chance of damaging wind over 30y; extreme-heat days projected 7→24/yr by 2055 (HVAC capex compounding) — expect insurance premiums to compound above CPI over the hold.
Questions for the listing agent
- It's been on market 38 days. Have you received any prior offers? Is the seller open to a 3% concession, seller financing, or rate buy-down credit?
- Is there a deadline driving the sale (1031 exchange, divorce, estate, relocation)? That informs how much negotiation room exists.
- Schools are D-rated, which usually means shorter tenancies and higher turnover. Who's the typical renter profile here, and what's been the actual vacancy rate?
- What's the average days-on-market for RENTAL listings here right now (not sales)? A rising rental-DOM trend means longer vacancies and softer asking-rent achievability than the comps imply.
- What's the recent tenant-quality profile in this submarket — average credit score on applications, eviction rate, late-payment / NSF rate, and stable-employment percentage? A property-management company in the area should have these aggregated.
- How much new for-sale + rental construction is in the pipeline within 1–3 miles? Heavy new supply typically softens prices + rents 12–24 months out; constrained supply supports both.
Investment metrics
- 1% rule
- 2.70% ✓
- Cap rate
- 22.81%
- Cash-on-cash
- 58.99%
- DSCR
- 3.62
- GRM
- 3.1
CMA / ARV
- ARV (median comp)
- $139,793
- List price
- $54,900
- Delta
- -60.73%
- Verdict
- UNDERPRICED
- Comps
- 1 within 2.0 mi
Show comp detail 1 sale within ~0.75 mi
| Address | Dist | Beds/Ba | Sqft | Sold | Price | $/sf | Match |
|---|---|---|---|---|---|---|---|
| 395 Dixie Lake Ln | 0.45mi | 4/2.0 (+1) | 1,792 (+14%) | 10mo | $142,900 | $80 | 42 |
Match score weights: distance 35% · size 25% · config 20% · recency 20%. Top-matched comps best support the ARV.
Projected returns pro-forma
-3.0% appreciation · 3.0% rent growth · sell at horizon
- IRR
- 57.7%
- Equity multiple
- 3.56×
- Total profit
- $39,280
- Equity at exit
- $8,186
- IRR
- 62.5%
- Equity multiple
- 7.27×
- Total profit
- $96,364
- Equity at exit
- $4,747
Cash invested: $15,372 (down + closing). Projections, not guarantees.
Landlord ↔ Tenant lean methodology
- Overall (STATE)
- 87 Strongly Landlord-Friendly
- State Texas
- 87 Strongly Landlord-Friendly · R+5
- County
- — inherits STATE
- City
- — inherits STATE
ZIP-level market 75692
- Home prices YoY
- -31.6%
- Active inventory
- 54
- Price-to-rent
- 3.1×
Monthly cashflow live
- Estimated rent
- $1,484 medium interval (Pro) →
- Mortgage (P&I)
- −$288
- Tax from tax record
- −$106 /mo · $1,269/yr
- Insurance
- −$23
- HOA
- −$0
- Vacancy / Maint / Mgmt
- −$312
- Net cashflow
- $756
Break-even live
UW: 25.0% down · 7.5% · 30yr · 1.5% tax · 5.0% vac · 8.0% maint · 8.0% mgmt
Financing live
Cash to close
- Down payment
- $13,725
- Closing costs
- $1,647
- Reserves months
- —
- Total cash needed
- —
Loan-product check · same deal, 3 products live
Conventional
25% down · 7.5% · 30yr
- Down + closing
- —
- Monthly P&I
- —
- Monthly cashflow
- —
- DSCR
- —
- Eligible?
- —
Personal DTI + credit; lowest rate.
DSCR
20% down · 8.5% · 30yr
- Down + closing
- —
- Monthly P&I
- —
- Monthly cashflow
- —
- DSCR
- —
- Eligible?
- —
No personal income docs; deal must DSCR.
Hard money
10% down · 12.0% · 12mo
- Down + closing
- —
- Monthly P&I
- —
- Monthly cashflow
- —
- DSCR
- —
- Eligible?
- —
Short-term bridge; refi at stabilization.
Listing history 15 events
-
2026-06-15days on market $54,900 Active 38 DOM
-
2026-06-15days on market $54,900 Active 37 DOM
-
2026-06-13days on market $54,900 Active 36 DOM
-
2026-06-12days on market $54,900 Active 35 DOM
-
2026-06-09days on market $54,900 Active 32 DOM
-
2026-06-08days on market $54,900 Active 31 DOM
-
2026-06-08days on market $54,900 Active 30 DOM
-
2026-06-07days on market $54,900 Active 29 DOM
-
2026-06-03days on market $54,900 Active 26 DOM
Show marketing remark (430 chars)
Great opportunity in Waskom! This double-wide mobile home offers 3 bedrooms and 2 bathrooms with the added benefit of owning the land. The home features window unit A/C systems and a spacious layout with plenty of potential. The property needs TLC, making it a great value-add opportunity for buyers or investors looking to customize and build equity. A solid chance to own land and create the space you’ve been looking for!
-
2026-06-02days on market $54,900 Active 25 DOM
-
2026-06-01days on market $54,900 Active 24 DOM
-
2026-05-31days on market $54,900 Active 23 DOM
-
2026-05-11$49,900 Active 430-char remark
Show marketing remark (430 chars)
Great opportunity in Waskom! This double-wide mobile home offers 3 bedrooms and 2 bathrooms with the added benefit of owning the land. The home features window unit A/C systems and a spacious layout with plenty of potential. The property needs TLC, making it a great value-add opportunity for buyers or investors looking to customize and build equity. A solid chance to own land and create the space you’ve been looking for!
-
2026-05-08$54,900 Active 426-char remark
-
2001-07-12soldstatus
ⓘ Source: listings_history table (triggers on properties + properties_extension) + one-shot
backfill from property_details.listing_events for pre-trigger history.
Tax reassessment forecast TX · Resets to sale price
- Current annual tax
- $1,269 · $106/mo
- Projected year-2 tax
- $1,269 · $106/mo
- Expected delta
- $0/yr ($0/mo · 0.0%)
ⓘ Screening estimate from a state-policy table — verify with the county assessor before closing.
Climate risk First Street
- Flood 1/10 Low FEMA zone X (unshaded) · 0% chance over 30 yrs
- Wildfire 4/10 Moderate
- Heat 7/10 Severe 7 d/yr ≥111°F today · 24 d/yr by 30 yrs out
- Wind 6/10 Major 66% chance of damaging wind over 30 yrs
- Air quality 1/10 Low 0 unhealthy d/yr today · 0 by 30 yrs out
Nearby sold comps map
Loading sold comps map…
Walkable amenities ~0.75 mi
Loading nearby amenities…
Taxation est. · year 1
- Rental income
- $17,806
- − Mortgage interest
- −$3,075
- − Property taxes
- −$1,269
- − Insurance
- −$274
- − Repairs & maintenance
- −$1,425
- − Management
- −$1,425
- − Depreciation
- −$1,597
- Taxable income
- $8,741
- Est. tax owed @ 24.0%
- −$2,098
- After-tax cash flow
- $6,970/yr
For passive investors: Depreciation is non-cash, so a rental often shows a tax loss while cash-flowing — sheltering income. Rental losses are passive: they offset passive income freely, and up to $25,000/yr can offset ordinary (W-2) income if you actively participate and your MAGI is under $100k (phasing out to $0 by $150k); unused losses carry forward. On sale, claimed depreciation is recaptured at up to 25%, and gains may owe capital-gains tax (a 1031 exchange can defer both). Figures are a year-1 estimate at your 24.0% rate — not tax advice; consult a CPA.
Schools (NCES district)
- District
- Waskom ISD
- NCES district ID
- 4844670
- Math proficiency
- 38% ▼ -4.00%
- Reading proficiency
- 43% ▲ 1.00%
- Median HH income
- $49,184
- Composite
- 34.82/100
- National rank
- #5103
- State rank
- #387 of 826 in TX
Livability — Waskom
- Score
- 74/100
- State rank
- #168
- US rank
- #4434
Category grades
Schools grade is shown separately in the Schools card above.
Census & demographics
- Population (ZIP)
- 5,255
Population outlook (Harrison County) Hauer SSP2
- Today (2025)
- 68,691 people
- By 2030
- 69,317 · +0.9%
- By 2040
- 69,973 · +1.9%
- By 2050
- 70,090 · +2.0%
- By 2075
- 70,607 · +2.8%
- By 2100
- 67,546 · -1.7%
Race, ethnicity, and origin ACS 2023
- Neighborhood character
- Predominantly White (80%)
- Race & ethnicity
- White 80% Black 11% Hispanic / Latino 7% Two or more races 5%
- Hispanic origin (detail)
- Mexican 6%
- Common ancestry
- Italian 1% Romanian 1% Slovak 1%
- Foreign-born
- 3% · Canada
- Languages at home
- 94% English-only · Spanish 6%
Political lean MEDSL · Harrison
- 2024 margin
- Solid R (+50.6) · D 24.4% · R 75.0%
- 2008→2024 swing
- -19.2pp toward R · 2008: -31.4pp · 2024: -50.6pp
- All cycles
- 2024: R+50.6 2020: R+45.6 2016: R+43.9 2012: R+34.6 2008: R+31.4
Not yet ingested
- Civics
- —
Market trends
- HPI YoY
- ▼ -66.51%
- Current HPI
- 144.1058
- Rent YoY
- —
- Metro
- —
- State GDP YoY
- ▲ 3.95%
- F500 in state
- 110
Industry mix (Fortune 500 HQ in TX)
| Industry | F500 HQs | Revenue |
|---|---|---|
| Energy | 16 | $1,198B |
|
||
| Technology | 5 | $198B |
|
||
| Engineering / Construction | 4 | $72B |
|
||
| Energy Services | 3 | $60B |
|
||
| Utilities | 3 | $41B |
|
||
| Healthcare | 2 | $330B |
|
||
Price history
-9.1% since first listed7 events — show timeline
- 2026-06-15 Pending — NTREIS
- 2026-06-15 Sold (MLS) — NTREIS
- 2026-06-03 Sold (MLS) — LAAR
- 2026-05-21 Pending — LAAR
- 2026-05-11 Listed $49,900 LAAR
- 2026-05-08 Listed $54,900 NTREIS
- 2001-07-12 Sold (Public Records) — Public Records
Property tax history
-0.5%/yrLatest (2025): $1,269 · -3.4% YoY. Source: county tax records.
Cash-flow waterfall
monthlySold comps — $/sqft
last 12 mo · ≤1 miLoading sold comps…