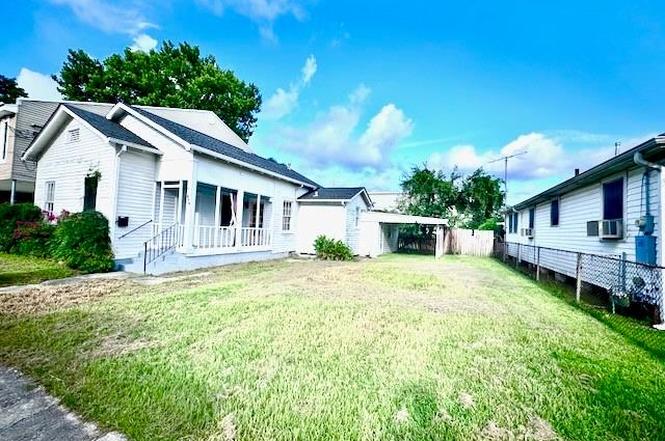
439 Brooklyn Ave · Jefferson, LA
Flood risk 8/10 · Major
- FEMA flood zone
- X
- Chance of flooding over 30 yrs
- 0.73%
- Est. flood insurance / yr
- $507 – $1,088
Fire risk 1/10 · Minimal
- Est. fire insurance / yr
- $1,269 – $2,357
Heat risk 10/10 · Severe
- Hot days now (above 108°F)
- 7 days/yr
- Hot days in 30 yrs
- 21 days/yr
Wind risk 10/10 · Severe
- Chance of severe wind over 30 yrs
- 99.0%
Air-quality risk 4/10 · Minor
- Unhealthy air days now
- 4 days/yr
- Unhealthy air days in 30 yrs
- 4 days/yr
Risk factors via First Street. Map © Google.
Why this score? — see what drove the B- grade
The composite is a weighted blend of 9 inputs, each scored 0–100. Each bar is that input's sub-score; the figure is the points it added to the 100-point composite (weight × sub-score).
- Cash flow +24.3/30.0
- ARV discount +15.0/15.0
- DSCR +7.8/10.0
- 1% rule +5.7/10.0
- Rent growth +3.8/5.0
- Livability +3.6/5.0
- Schools +2.5/10.0
- Condition / age +2.5/5.0
- Appreciation +0.0/10.0
$175,000
🖨 Deal sheet 📄 Offer letter ✓ Due diligence
Listing remarks MLS
Set on one of Jefferson's most storied streets, this 125-year-old Craftsman is among the original homes on historic Brooklyn Avenue, and it's ready for its next chapter. Behind the classic lines and welcoming front porch is a rare opportunity: a characterful home on a generous lot, in a location that's tough to beat. You're minutes from Ochsner Medical Center, Audubon Zoo, and a quick ride into the heart of New Orleans. Inside, large light-filled front rooms set the tone for easy living, while the oversized kitchen and dining area give you real space to gather. The home offers 2-3 flexible bedrooms, a full bath, a covered carport, and ample parking. The standout is the lot itself, room to garden, relax, or expand and build equity over time. A true blank canvas. Whether you're a buyer dreaming of a timeless home to make your own or an investor looking to add value in an established, high-demand area, the bones and location are here. Bring your vision and write yourself into Brooklyn Avenue's history. Showings available now!
Key facts
- Generous lot
- Covered carport
- Craftsman home
Tags
Property features AI
Exterior
- Parking: Driveway with three or more spaces
- Utilities: Public water; Public sewer
- Home design: Single-story; Raised foundation; Average condition
- Construction: Wood siding; Asphalt shingle roof; Built with interior painted
- Exterior features: Wood patio/porch; Fence; Shed(s)
Interior
- Kitchen: New panel in kitchen
- Bedrooms: 5 total rooms (bedrooms and living spaces combined)
- Flooring: New bathroom flooring
- Bathrooms: 1 full bathroom
- Heating & cooling: Central heating; Central air; Window unit(s)
- Interior features: Ceiling fan(s)
Neighborhood map
What this means for you Summary
Snapshot
- This is a 3-bed/1.0-bath single-family listed at $175k.
Deal economics
- At list price, monthly cash flow is $285 ($3k/yr) — positive.
- The deal already cash-flows at list — no discount required.
- Meets the 1% rule at list price ($2k rent vs $175k).
- Cap rate 8.7% vs local median 4.6% in Jefferson — top-decile yield for the area; either an underpriced asset or a hidden risk that comps aren't pricing in. Stress-test before assuming the spread holds.
Location & tenants
- Location reads 72/100 on livability (#42 in LA) — a middle-class / working-renter tenant base. Strengths: cost of living A+, health & safety A+, housing A; Watch: employment D, amenities F, commute F.
- Jefferson Parish (suburban): math 24% / reading 34% proficiency, ranked #44 of 98 in LA (top 45%) — low school quality limits family demand, transient renter base, plan for 1-2y turnover; 70% free/reduced lunch — lower-income household profile, screen leases tightly.
- Market conditions: Rents rising fast (+5.1%/yr); 100 active listings in the ZIP; 40 comparable units currently listed for rent nearby; rentals at typical pace (median 24d on market — plan ~3-4 weeks tenant-placement turnaround); 518 units permitted in Jefferson Parish in 2024 (43 in 5+ unit buildings).
- This rent runs 38% of the median local income ($60k/yr) — at the standard rent-burdened threshold; future hikes will face affordability resistance.
Forward outlook
- Local home prices are declining (-3.0%/yr); year-one equity from $1k of loan paydown is wiped out by about $5k of value loss. Plan a longer hold.
Negotiation context
- Only 2 days on market — expect competitive offers; lowballing is unlikely to land.
- 7 sale attempts since 3y ago with the ask held roughly flat each time — persistent listings suggest the price (not the market) is what's stuck; bring a comps-based counter.
- Current owner paid $79k; list at $175k implies a 122% gain — meaningful room to come down on a strong offer.
Risks & watch-outs
- Watch-outs: flood insurance adds $66/mo; built in 1900 — expect roof / HVAC / electrical / plumbing capex.
- Climate carrying-cost: severe flood risk; severe wind risk, 99% chance of damaging wind over 30y; extreme-heat days projected 7→21/yr by 2055 (HVAC capex compounding) — expect insurance premiums to compound above CPI over the hold.
Questions for the listing agent
- Built in 1900 — when were the roof, HVAC, electrical panel, plumbing, and water heater last replaced?
- What's the actual annual flood-insurance premium (NFIP or private), and is the property in a SFHA with mandatory coverage?
- Is there a deadline driving the sale (1031 exchange, divorce, estate, relocation)? That informs how much negotiation room exists.
- What's the average days-on-market for RENTAL listings here right now (not sales)? A rising rental-DOM trend means longer vacancies and softer asking-rent achievability than the comps imply.
- What's the recent tenant-quality profile in this submarket — average credit score on applications, eviction rate, late-payment / NSF rate, and stable-employment percentage? A property-management company in the area should have these aggregated.
- How much new for-sale + rental construction is in the pipeline within 1–3 miles? Heavy new supply typically softens prices + rents 12–24 months out; constrained supply supports both.
Investment metrics
- 1% rule
- 1.07% ✓
- Cap rate
- 8.71%
- Cash-on-cash
- 8.62%
- DSCR
- 1.38
- GRM
- 7.8
CMA / ARV
- ARV (on-the-fly)
- $291,168
- Comps found
- 12
Show comp detail 12 sales within ~0.75 mi
| Address | Dist | Beds/Ba | Sqft | Sold | Price | $/sf | Match |
|---|---|---|---|---|---|---|---|
| 228 Jules Ave | 0.27mi | 3/2.0 | 1,309 (-3%) | 4mo | $262,000 | $200 | 76 |
| 290 Brooklyn Ave | 0.22mi | 3/3.0 | 1,326 (-2%) | 5mo | $320,000 | $241 | 75 |
| 505 Betz Ave | 0.44mi | 3/2.0 | 1,435 (+6%) | 1mo | $310,000 | $216 | 64 |
| 913 Odwyer Pl | 0.39mi | 2/3.0 (-1) | 1,400 (+4%) | 5mo | $250,000 | $179 | 58 |
| 222 Harding St | 0.32mi | 2/2.0 (-1) | 1,210 (-10%) | 2mo | $295,000 | $244 | 58 |
| 1721 Eagle St | 0.71mi | 3/2.0 | 1,424 (+6%) | 6mo | $280,000 | $197 | 48 |
| 2510 General Ogden St | 0.75mi | 3/1.0 | 1,500 (+11%) | 2mo | $55,000 | $37 | 45 |
| 501 Betz Ave | 0.44mi | 3/2.0 | 1,148 (-15%) | 7mo | $225,000 | $196 | 45 |
| 4 Sonia Pl | 0.64mi | 3/1.5 | 1,187 (-12%) | 4mo | $309,000 | $260 | 44 |
| 8817 Birch St | 0.69mi | 3/3.0 | 1,430 (+6%) | 12mo | $335,000 | $234 | 40 |
| 2101 Neely St | 0.71mi | 2/2.0 (-1) | 1,171 (-13%) | 1mo | $205,765 | $176 | 36 |
| 2109 James St | 0.70mi | 3/3.0 | 1,500 (+11%) | 9mo | $375,000 | $250 | 33 |
Match score weights: distance 35% · size 25% · config 20% · recency 20%. Top-matched comps best support the ARV.
Projected returns pro-forma
-3.0% appreciation · 5.1% rent growth · sell at horizon
- IRR
- -3.2%
- Equity multiple
- 0.88×
- Total profit
- $-6,112
- Equity at exit
- $26,093
- IRR
- 8.7%
- Equity multiple
- 1.72×
- Total profit
- $35,521
- Equity at exit
- $15,131
Cash invested: $49,000 (down + closing). Projections, not guarantees.
Landlord ↔ Tenant lean methodology
- Overall (STATE)
- 90 Strongly Landlord-Friendly
- State Louisiana
- 90 Strongly Landlord-Friendly · R+12
- County
- — inherits STATE
- City
- — inherits STATE
ZIP-level market 70121
- Rents YoY
- 5.1%
- Active inventory
- 100
- Price-to-rent
- 7.8×
Monthly cashflow live
- Estimated rent
- $1,878 high interval (Pro) →
- Mortgage (P&I)
- −$918
- Tax from tax record
- −$141 /mo · $1,696/yr
- Insurance
- −$73
- Flood insurance flood zone
- −$66 /mo · $798/yr
- HOA
- −$0
- Vacancy / Maint / Mgmt
- −$394
- Net cashflow
- $285
Break-even live
UW: 25.0% down · 7.5% · 30yr · 1.5% tax · 5.0% vac · 8.0% maint · 8.0% mgmt
Financing live
Cash to close
- Down payment
- $43,750
- Closing costs
- $5,250
- Reserves months
- —
- Total cash needed
- —
Loan-product check · same deal, 3 products live
Conventional
25% down · 7.5% · 30yr
- Down + closing
- —
- Monthly P&I
- —
- Monthly cashflow
- —
- DSCR
- —
- Eligible?
- —
Personal DTI + credit; lowest rate.
DSCR
20% down · 8.5% · 30yr
- Down + closing
- —
- Monthly P&I
- —
- Monthly cashflow
- —
- DSCR
- —
- Eligible?
- —
No personal income docs; deal must DSCR.
Hard money
10% down · 12.0% · 12mo
- Down + closing
- —
- Monthly P&I
- —
- Monthly cashflow
- —
- DSCR
- —
- Eligible?
- —
Short-term bridge; refi at stabilization.
Rent comps 40 comps
| Address | Beds | Baths | Sqft | Rent | $/sqft | DOM | Units | Dist |
|---|---|---|---|---|---|---|---|---|
| 439 Brooklyn Ave New Orleans, LA | 2.0 | 1.0 | 1000 | $1,650 | $1.65 | 43d | 1 | 0.02mi |
| 212 Harding St New Orleans, LA | 3.0 | 2.0 | 1400 | $2,100 | $1.50 | 23d | 1 | 0.32mi |
| 419 Betz Ave New Orleans, LA | 3.0 | 2.0 | 1100 | $2,500 | $2.27 | 21d | 1 | 0.42mi |
| 113 Harding St New Orleans, LA | 2.0 | 1.0 | 1188 | $2,075 | $1.75 | 4d | 1 | 0.43mi |
| 912 Monticello Ave New Orleans, LA | 3.0 | 2.0 | 1750 | $2,500 | $1.43 | 43d | 1 | 0.44mi |
| 335 Deckbar Ave Unit B Jefferson, LA | 2.0 | 2.5 | 1300 | $1,800 | $1.38 | 23d | 1 | 0.48mi |
| 339 Deckbar Ave Unit A Jefferson, LA | 2.0 | 2.5 | 1344 | $1,600 | $1.19 | 43d | 1 | 0.48mi |
| 319 Deckbar Ave #102 New Orleans, LA | 2.0 | 1.0 | 1300 | $1,550 | $1.19 | 14d | 1 | 0.49mi |
| 424 Deckbar Ave Unit D Jefferson, LA | 2.0 | 2.5 | 1100 | $1,550 | $1.41 | 4d | 1 | 0.50mi |
| 425 Rio Vista Ave New Orleans, LA | 3.0 | 1.0 | 1450 | $2,100 | $1.45 | 3d | 1 | 0.54mi |
| 9215 S Claiborne Ave New Orleans, LA | 2.0 | 2.0 | 1100 | $2,000 | $1.82 | 11d | 1 | 0.55mi |
| 117 Addison St New Orleans, LA | 2.0 | 1.5 | 1088 | $1,350 | $1.24 | 23d | 1 | 0.58mi |
| 8927 Hickory St New Orleans, LA | 2.0 | 1.0 | 1440 | $1,500 | $1.04 | 23d | 1 | 0.61mi |
| 1836 General Ogden St New Orleans, LA | 3.0 | 2.0 | 1368 | $1,675 | $1.22 | 23d | 1 | 0.63mi |
| 9129 Nelson St New Orleans, LA | 2.0 | 1.5 | 1434 | $1,900 | $1.32 | 23d | 1 | 0.63mi |
| 8943 Jeannette St New Orleans, LA | 2.0 | 2.0 | 1040 | $1,375 | $1.32 | 11d | 1 | 0.63mi |
| 9122 Nelson St New Orleans, LA | 2.0 | 2.0 | 1100 | $1,550 | $1.41 | 23d | 1 | 0.63mi |
| 2013 James St Jefferson, LA | 2.0 | 2.0 | 1000 | $2,000 | $2.00 | 3d | 1 | 0.64mi |
| 1916 Eagle St New Orleans, LA | 3.0 | 2.0 | 1000 | $1,250 | $1.25 | 2d | 1 | 0.70mi |
| 1916 Eagle St New Orleans, LA | 3.0 | 2.0 | 1000 | $1,250 | $1.25 | 23d | 1 | 0.70mi |
| 8728 Jeannette St New Orleans, LA | 3.0 | 2.0 | 1511 | $1,995 | $1.32 | 3d | 1 | 0.78mi |
| 8635 Green St New Orleans, LA | 3.0 | 1.0 | 950 | $950 | $1.00 | 14d | 1 | 0.80mi |
| 8626 Green St New Orleans, LA | 3.0 | 1.5 | 1450 | $1,500 | $1.03 | 16d | 1 | 0.81mi |
| 8609 Green St New Orleans, LA | 3.0 | 2.0 | 1009 | $1,800 | $1.78 | 16d | 1 | 0.83mi |
| 8812 Apple St New Orleans, LA | 3.0 | 2.0 | 1085 | $1,650 | $1.52 | 15d | 1 | 0.83mi |
| 2527 Eagle St New Orleans, LA | 3.0 | 2.0 | 1571 | $2,200 | $1.40 | 23d | 1 | 0.87mi |
| 9107 Fig St New Orleans, LA | 3.0 | 3.0 | 1230 | $2,000 | $1.63 | 3d | 1 | 0.91mi |
| 8515 Jeannette St New Orleans, LA | 2.0 | 2.0 | 1215 | $2,000 | $1.65 | 15d | 1 | 0.92mi |
| 8537 S Claiborne Ave New Orleans, LA | 2.0 | 1.0 | 1450 | $1,400 | $0.97 | 3d | 1 | 0.93mi |
| 8526 Willow St New Orleans, LA | 2.0 | 1.0 | 1056 | $1,475 | $1.40 | 23d | 1 | 0.93mi |
| 8426 Spruce St New Orleans, LA | 3.0 | 2.0 | 1700 | $3,000 | $1.76 | 43d | 1 | 0.94mi |
| 8423 Cohn St New Orleans, LA | 2.0 | 2.0 | 887 | $1,700 | $1.92 | 23d | 1 | 0.95mi |
| 8421 Cohn St New Orleans, LA | 2.0 | 2.0 | 887 | $1,750 | $1.97 | 23d | 1 | 0.95mi |
| 1820 Cambronne St New Orleans, LA | 2.0 | 1.5 | 900 | $1,600 | $1.78 | 14d | 1 | 0.96mi |
| 1822 Cambronne St New Orleans, LA | 2.0 | 1.5 | 900 | $1,600 | $1.78 | 14d | 1 | 0.96mi |
| 2305 Joliet St New Orleans, LA | 3.0 | 2.0 | 1451 | $2,500 | $1.72 | 43d | 1 | 0.96mi |
| 2311 Joliet St New Orleans, LA | 2.0 | 2.0 | 950 | $1,900 | $2.00 | 23d | 1 | 0.97mi |
| 9438 Forshey St New Orleans, LA | 3.0 | 2.0 | 1274 | $2,000 | $1.57 | 23d | 1 | 0.98mi |
| 300 Maine St Unit A Jefferson, LA | 2.0 | 1.0 | 875 | $1,600 | $1.83 | 4d | 1 | 0.99mi |
| 300 Maine St New Orleans, LA | 3.0 | 2.0 | 1169 | $2,300 | $1.97 | 43d | 1 | 0.99mi |
Listing history 3 events
-
2026-06-18days on market $175,000 Active 2 DOM
-
2026-06-17remarks 693-char remark
-
2026-06-17$175,000 Active 1 DOM
ⓘ Source: listings_history table (triggers on properties + properties_extension) + one-shot
backfill from property_details.listing_events for pre-trigger history.
Tax reassessment forecast LA · Resets to sale price
- Current annual tax
- $1,696 · $141/mo
- Projected year-2 tax
- $1,696 · $141/mo
- Expected delta
- $0/yr ($0/mo · 0.0%)
ⓘ Screening estimate from a state-policy table — verify with the county assessor before closing.
Climate risk First Street
- Flood 8/10 Severe FEMA zone X · 73% chance over 30 yrs
- Wildfire 1/10 Low
- Heat 10/10 Extreme 7 d/yr ≥108°F today · 21 d/yr by 30 yrs out
- Wind 10/10 Extreme 99% chance of damaging wind over 30 yrs
- Air quality 4/10 Moderate 4 unhealthy d/yr today · 4 by 30 yrs out
Nearby sold comps map
Loading sold comps map…
Walkable amenities ~0.75 mi
Loading nearby amenities…
Taxation est. · year 1
- Rental income
- $22,538
- − Mortgage interest
- −$9,803
- − Property taxes
- −$1,696
- − Insurance
- −$1,672
- − Repairs & maintenance
- −$1,803
- − Management
- −$1,803
- − Depreciation
- −$5,091
- Taxable income
- $670
- Est. tax owed @ 24.0%
- −$161
- After-tax cash flow
- $3,263/yr
For passive investors: Depreciation is non-cash, so a rental often shows a tax loss while cash-flowing — sheltering income. Rental losses are passive: they offset passive income freely, and up to $25,000/yr can offset ordinary (W-2) income if you actively participate and your MAGI is under $100k (phasing out to $0 by $150k); unused losses carry forward. On sale, claimed depreciation is recaptured at up to 25%, and gains may owe capital-gains tax (a 1031 exchange can defer both). Figures are a year-1 estimate at your 24.0% rate — not tax advice; consult a CPA.
Schools (NCES district)
- District
- Jefferson Parish
- NCES district ID
- 2200840
- Math proficiency
- 24% ▼ -36.00%
- Reading proficiency
- 34% ▼ -30.00%
- Median HH income
- $48,421
- Composite
- 25.19/100
- National rank
- #7511
- State rank
- #44 of 98 in LA
Livability — Jefferson
- Score
- 72/100
- State rank
- #42
- US rank
- #6166
Category grades
Schools grade is shown separately in the Schools card above.
Census & demographics
- Census place
- Jefferson, LA
- County
- Jefferson Parish · 426,999 people
- City population
- 10,558
- Metro
- New Orleans-Metairie, LA
- Population (ZIP)
- 10,558
- Household income
- $59,562
- Rent vs Own
- Severe rent burden
- 593.0
Population outlook (Jefferson County) Hauer SSP2
- Today (2025)
- 451,696 people
- By 2030
- 455,451 · +0.8%
- By 2040
- 458,308 · +1.5%
- By 2050
- 461,031 · +2.1%
- By 2075
- 476,351 · +5.5%
- By 2100
- 499,377 · +10.6%
Race, ethnicity, and origin ACS 2023
- Neighborhood character
- Majority White (63%)
- Race & ethnicity
- White 63% Black 19% Hispanic / Latino 13% Two or more races 9% Asian 2%
- Hispanic origin (detail)
- Mexican 2% Cuban 1%
- Common ancestry
- Lithuanian 14% Slovak 2% Italian 1%
- Foreign-born
- 8% · Canada, Jamaica, China
- Languages at home
- 88% English-only · Spanish 9% Other Indo-European 1% French/Haitian/Cajun 1%
Political lean MEDSL · Jefferson
- 2024 margin
- R (+12.9) · D 42.5% · R 55.5% · Other 2.1%
- 2008→2024 swing
- +13.6pp toward D · 2008: -26.6pp · 2024: -12.9pp
- All cycles
- 2024: R+12.9 2020: R+11.1 2016: R+14.8 2012: R+18.4 2008: R+26.6
Not yet ingested
- Civics
- —
Market trends
- HPI YoY
- ▼ -134.66%
- Current HPI
- 107.0611
- Rent YoY
- ▲ 5.10%
- Metro
- New Orleans-Metairie, LA
- State GDP YoY
- ▲ 3.29%
- F500 in state
- 10
Industry mix (Fortune 500 HQ in LA)
| Industry | F500 HQs | Revenue |
|---|---|---|
| Telecommunications | 2 | $23B |
|
||
| Utilities | 1 | $12B |
|
||
| Wholesale / Distribution | 1 | $5B |
|
||
| Advertising | 1 | $2B |
|
||
Price history
+121.5% since first listed13 events — show timeline
- 2026-06-16 Listed $175,000 AcadianaMLS
- 2026-06-16 Listed $175,000 GSREIN
- 2026-05-15 Rental Removed $1,650 GSREIN
- 2025-11-18 Listed for Rent $1,650 GSREIN
- 2025-11-14 Rental Removed $1,650 GSREIN
- 2025-10-23 Listed for Rent $1,650 GSREIN
- 2025-01-25 Price Changed $175,000 GSREIN
- 2024-12-10 Rental Removed $1,650 GSREIN
- 2024-12-10 Listed $175,000 AcadianaMLS
- 2024-06-06 Listed for Rent $1,650 GSREIN
- 2024-04-01 Rental Removed $1,650 GSREIN
- 2023-12-07 Listed for Rent $1,650 GSREIN
- 2000-03-01 Sold (Public Records) $79,000 Public Records
Property tax history
+2.1%/yrLatest (2025): $1,696 · +0.2% YoY. Source: county tax records.
Cash-flow waterfall
monthlySold comps — $/sqft
last 12 mo · ≤1 miLoading sold comps…