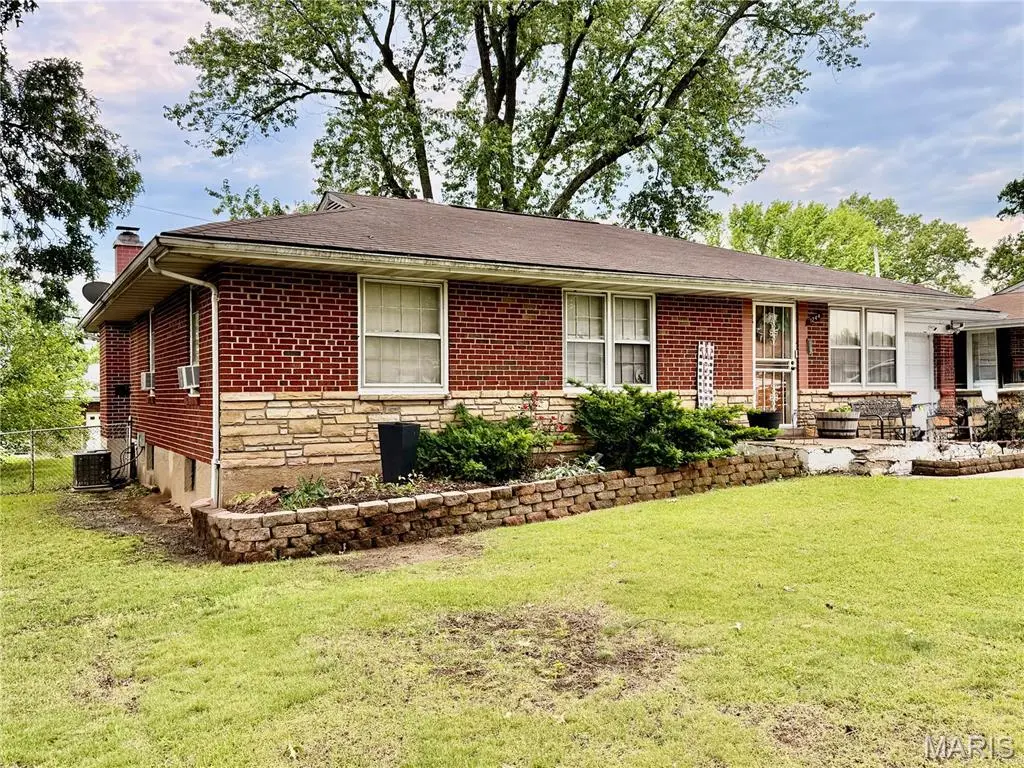
1244 Forest Home Dr · Bellefontaine Neighbors, MO
Flood risk 1/10 · Minimal
- FEMA flood zone
- X (unshaded)
- Chance of flooding over 30 yrs
- 0.0%
- Est. flood insurance / yr
- $473 – $860
Fire risk 1/10 · Minimal
- Est. fire insurance / yr
- $1,054 – $1,958
Heat risk 5/10 · Moderate
- Hot days now (above 107°F)
- 7 days/yr
- Hot days in 30 yrs
- 21 days/yr
Wind risk 2/10 · Minimal
- Chance of severe wind over 30 yrs
- 1.0%
Air-quality risk 4/10 · Minor
- Unhealthy air days now
- 5 days/yr
- Unhealthy air days in 30 yrs
- 6 days/yr
Risk factors via First Street. Map © Google.
Why this score? — see what drove the D+ grade
The composite is a weighted blend of 9 inputs, each scored 0–100. Each bar is that input's sub-score; the figure is the points it added to the 100-point composite (weight × sub-score).
- Cash flow +23.9/30.0
- DSCR +7.7/10.0
- 1% rule +6.1/10.0
- Rent growth +4.1/5.0
- Livability +2.9/5.0
- Condition / age +2.5/5.0
- Schools +0.4/10.0
- ARV discount +0.0/15.0
- Appreciation +0.0/10.0
$129,900
🖨 Deal sheet 📄 Offer letter ✓ Due diligence
Listing remarks MLS
Great Investment Opportunity - Tenant Occupied 3 Bedroom 1 Bath House with Garage and Full Basement. Solid house, Quality Tenant, Great Neighborhood.
Key facts
- 7,200 sq ft lot
- Garage
- Built 1953
Property features AI
Finance
- Financial info: Annual property tax shown
Exterior
- Parking: Attached garage (1-car)
- Utilities: Public water; Public sewer; Single-phase electric with 220 volts; Cable connected, electricity connected, natural gas connected, sewer connected, water connected
- Home design: Single-family residence; One story
- Construction: Brick construction; Architectural shingle roof
- Exterior features: Level lot with many trees; Lot dimensions approximately 72 x 100
Interior
- Kitchen: Dishwasher; Oven; Free-standing range; Free-standing refrigerator
- Bedrooms: Three bedrooms, all on the main level
- Flooring: Carpet; Hardwood; Laminate
- Bathrooms: One full bathroom (main level)
- Heating & cooling: Forced air heating (natural gas); Central air conditioning
- Interior features: Fireplace (1) with other-style fireplace; Unfinished basement
Neighborhood map
What this means for you Summary
Snapshot
- This is a 3-bed/1.0-bath single-family listed at $130k.
Deal economics
- At list price, monthly cash flow is $252 ($3k/yr) — positive.
- The deal already cash-flows at list — no discount required.
- Meets the 1% rule at list price ($1k rent vs $130k).
Location & tenants
- Location reads 58/100 on livability (#592 in MO) — a working-class tenant base; expect higher turnover. Strengths: cost of living A+, housing B+; Watch: employment D+, crime F, amenities F.
- Riverview Gardens (suburban): math 2% / reading 9% proficiency, ranked #324 of 324 in MO (top 100%) — low school quality limits family demand, transient renter base, plan for 1-2y turnover; 90% free/reduced lunch — lower-income household profile, screen leases tightly.
- Zoned schools: Gibson Elem. (math 0% / reading 7%, grade F, #1,097 of 1,115 statewide, top 98%, 429 students, 99% FRL); Riverview Gardens Sr. High (math 2% / reading 18%, grade F, #501 of 521 statewide, top 97%, 1,331 students, 100% FRL).
- Market conditions: Rents rising fast (+6.6%/yr); 201 active listings in the ZIP; 40 comparable units currently listed for rent nearby; rentals at typical pace (median 24d on market — plan ~3-4 weeks tenant-placement turnaround); lower-income renter base — watch delinquency; 920 units permitted in St. Louis County in 2024 (250 in 5+ unit buildings).
- This rent runs 40% of the median local income ($43k/yr) — at the standard rent-burdened threshold; future hikes will face affordability resistance.
Forward outlook
- Local home prices are declining (-3.0%/yr); year-one equity from $898 of loan paydown is wiped out by about $4k of value loss. Plan a longer hold.
- At projected returns (-3.0% appreciation + 6.6% rent growth), your $36k cash investment doubles in ~9 years — after that, you're playing with house money.
Negotiation context
- Only 7 days on market — expect competitive offers; lowballing is unlikely to land.
- 4 sale attempts since 5y ago with the ask held roughly flat each time — persistent listings suggest the price (not the market) is what's stuck; bring a comps-based counter.
- Current owner paid $66k; list at $130k implies a 97% gain — meaningful room to come down on a strong offer.
Risks & watch-outs
- Watch-outs: built in 1953 — expect roof / HVAC / electrical / plumbing capex.
- Climate carrying-cost: extreme-heat days projected 7→21/yr by 2055 (HVAC capex compounding) — expect insurance premiums to compound above CPI over the hold.
Questions for the listing agent
- Built in 1953 — when were the roof, HVAC, electrical panel, plumbing, and water heater last replaced?
- Is there a deadline driving the sale (1031 exchange, divorce, estate, relocation)? That informs how much negotiation room exists.
- Schools are F-rated, which usually means shorter tenancies and higher turnover. Who's the typical renter profile here, and what's been the actual vacancy rate?
- Crime grade is F in this area — have there been break-ins, vandalism, or insurance claims at this property in the last 3 years? What carrier currently insures it and at what premium?
- The area grade is low — what's the realistic commute time and amenity access for the typical tenant pool here? Any planned neighborhood developments (good or bad) we should know about?
- What's the average days-on-market for RENTAL listings here right now (not sales)? A rising rental-DOM trend means longer vacancies and softer asking-rent achievability than the comps imply.
- What's the recent tenant-quality profile in this submarket — average credit score on applications, eviction rate, late-payment / NSF rate, and stable-employment percentage? A property-management company in the area should have these aggregated.
- How much new for-sale + rental construction is in the pipeline within 1–3 miles? Heavy new supply typically softens prices + rents 12–24 months out; constrained supply supports both.
Investment metrics
- 1% rule
- 1.11% ✓
- Cap rate
- 8.62%
- Cash-on-cash
- 8.31%
- DSCR
- 1.37
- GRM
- 7.5
CMA / ARV
- ARV (on-the-fly)
- $102,960
- Comps found
- 12
Show comp detail 12 sales within ~0.75 mi
| Address | Dist | Beds/Ba | Sqft | Sold | Price | $/sf | Match |
|---|---|---|---|---|---|---|---|
| 1250 Admiral Dr | 0.05mi | 3/2.0 | 1,287 (0%) | 4mo | $115,000 | $89 | 91 |
| 1331 Norchester Dr | 0.25mi | 3/2.0 | 1,240 (-4%) | 2mo | $209,900 | $169 | 76 |
| 1201 Ensley | 0.19mi | 3/1.0 | 1,475 (+15%) | 3mo | $139,900 | $95 | 64 |
| 2410 Netherwood Dr | 0.74mi | 3/2.0 | 1,320 (+3%) | 1mo | $85,100 | $64 | 56 |
| 9737 Wendell Dr | 0.58mi | 3/1.0 | 1,183 (-8%) | 4mo | $60,000 | $51 | 56 |
| 9815 Portage Dr | 0.54mi | 4/2.0 (+1) | 1,252 (-3%) | 7mo | $155,000 | $124 | 55 |
| 9732 Cambria Dr | 0.41mi | 4/1.0 (+1) | 1,434 (+11%) | 2mo | $114,900 | $80 | 55 |
| 10006 Castle Dr | 0.62mi | 3/1.0 | 1,178 (-8%) | 5mo | $35,900 | $30 | 53 |
| 1295 Chambers Rd | 0.38mi | 2/2.0 (-1) | 1,148 (-11%) | 7mo | $87,000 | $76 | 50 |
| 9922 Lanier Dr | 0.70mi | 3/1.0 | 1,159 (-10%) | 5mo | $85,000 | $73 | 47 |
| 10129 Ashbrook Dr | 0.72mi | 2/1.0 (-1) | 1,445 (+12%) | 4mo | $79,900 | $55 | 38 |
| 10233 Unicorn Dr | 0.72mi | 2/1.0 (-1) | 1,116 (-13%) | 6mo | $146,450 | $131 | 35 |
Match score weights: distance 35% · size 25% · config 20% · recency 20%. Top-matched comps best support the ARV.
Projected returns pro-forma
-3.0% appreciation · 6.59% rent growth · sell at horizon
- IRR
- 0.3%
- Equity multiple
- 1.01×
- Total profit
- $412
- Equity at exit
- $19,369
- IRR
- 13.3%
- Equity multiple
- 2.24×
- Total profit
- $44,951
- Equity at exit
- $11,231
Cash invested: $36,372 (down + closing). Projections, not guarantees.
Landlord ↔ Tenant lean methodology
- Overall (STATE)
- 81 Strongly Landlord-Friendly
- State Missouri
- 81 Strongly Landlord-Friendly · R+10
- County
- — inherits STATE
- City
- — inherits STATE
ZIP-level market 63137
- Rents YoY
- 6.6%
- Active inventory
- 201
- Price-to-rent
- 7.5×
Monthly cashflow live
- Estimated rent
- $1,443 high interval (Pro) →
- Mortgage (P&I)
- −$681
- Tax from tax record
- −$153 /mo · $1,837/yr
- Insurance
- −$54
- HOA
- −$0
- Vacancy / Maint / Mgmt
- −$303
- Net cashflow
- $252
Break-even live
UW: 25.0% down · 7.5% · 30yr · 1.5% tax · 5.0% vac · 8.0% maint · 8.0% mgmt
Financing live
Cash to close
- Down payment
- $32,475
- Closing costs
- $3,897
- Reserves months
- —
- Total cash needed
- —
Loan-product check · same deal, 3 products live
Conventional
25% down · 7.5% · 30yr
- Down + closing
- —
- Monthly P&I
- —
- Monthly cashflow
- —
- DSCR
- —
- Eligible?
- —
Personal DTI + credit; lowest rate.
DSCR
20% down · 8.5% · 30yr
- Down + closing
- —
- Monthly P&I
- —
- Monthly cashflow
- —
- DSCR
- —
- Eligible?
- —
No personal income docs; deal must DSCR.
Hard money
10% down · 12.0% · 12mo
- Down + closing
- —
- Monthly P&I
- —
- Monthly cashflow
- —
- DSCR
- —
- Eligible?
- —
Short-term bridge; refi at stabilization.
Rent comps 40 comps
| Address | Beds | Baths | Sqft | Rent | $/sqft | DOM | Units | Dist |
|---|---|---|---|---|---|---|---|---|
| 1130 Forest Home Dr Saint Louis, MO | 3.0 | 1.0 | 1025 | $1,275 | $1.24 | 43d | 1 | 0.24mi |
| 9908 Norbridge Ln Saint Louis, MO | 2.0 | 2.0 | 1240 | $1,650 | $1.33 | 19d | 1 | 0.29mi |
| 1255 Bosworth Dr Saint Louis, MO | 3.0 | 1.0 | 1071 | $1,575 | $1.47 | 10d | 1 | 0.43mi |
| 9723 Portage Dr Saint Louis, MO | 3.0 | 1.0 | 1014 | $1,450 | $1.43 | 7d | 1 | 0.55mi |
| 9744 Lanier Dr Saint Louis, MO | 3.0 | 1.0 | 1014 | $1,345 | $1.33 | 43d | 1 | 0.69mi |
| 10200 Tappan Dr Saint Louis, MO | 3.0 | 1.0 | 912 | $1,450 | $1.59 | 16d | 1 | 0.73mi |
| 1520 Attica Dr Saint Louis, MO | 2.0 | 1.0 | 1062 | $1,200 | $1.13 | 23d | 1 | 0.75mi |
| 2321 Noll Dr Saint Louis, MO | 3.0 | 1.0 | 975 | $1,320 | $1.35 | 23d | 1 | 0.81mi |
| 10139 Royal Dr Saint Louis, MO | 2.0 | 1.0 | 1016 | $900 | $0.89 | 43d | 1 | 0.87mi |
| 2326 Chambers Rd Saint Louis, MO | 2.0 | 1.0 | 1056 | $1,050 | $0.99 | 23d | 1 | 0.88mi |
| 637 Karess Dr Saint Louis, MO | 2.0 | 2.0 | 1190 | $1,525 | $1.28 | 12d | 1 | 0.89mi |
| 10331 Ewell Dr Saint Louis, MO | 3.0 | 1.0 | 1658 | $1,540 | $0.93 | 4d | 1 | 0.90mi |
| 9517 West Ave Unit 1F St. Louis, MO | 3.0 | 1.0 | 1300 | $1,300 | $1.00 | 43d | 1 | 0.90mi |
| 1225 Newark Dr Saint Louis, MO | 3.0 | 2.0 | 944 | $1,400 | $1.48 | 3d | 1 | 0.96mi |
| 1115 Bakewell Dr Saint Louis, MO | 3.0 | 1.0 | 916 | $1,300 | $1.42 | 43d | 1 | 1.00mi |
| 10367 Coburg Lands Dr Saint Louis, MO | 3.0 | 1.0 | 912 | $1,270 | $1.39 | 43d | 1 | 1.01mi |
| 10113 Count Dr Saint Louis, MO | 2.0 | 1.0 | 882 | $775 | $0.88 | 43d | 1 | 1.01mi |
| 2257 Chambers Rd Saint Louis, MO | 3.0 | 1.0 | 1200 | $1,400 | $1.17 | 23d | 1 | 1.02mi |
| 9924 Gloucester Dr Saint Louis, MO | 3.0 | 2.0 | 992 | $1,565 | $1.58 | 10d | 1 | 1.02mi |
| 956 Fontaine Pl Saint Louis, MO | 2.0 | 2.0 | 1192 | $1,400 | $1.17 | 23d | 1 | 1.05mi |
| 1009 Bliss Dr Saint Louis, MO | 3.0 | 1.0 | 912 | $1,400 | $1.54 | 43d | 1 | 1.06mi |
| 9943 Lilac Dr Saint Louis, MO | 2.0 | 1.0 | 1086 | $1,000 | $0.92 | 43d | 1 | 1.06mi |
| 10066 Dorothy Ave Saint Louis, MO | 2.0 | 1.0 | 916 | $1,225 | $1.34 | 21d | 1 | 1.07mi |
| 1230 Roxton Dr Saint Louis, MO | 3.0 | 1.0 | 912 | $1,400 | $1.54 | 21d | 1 | 1.07mi |
| 2152 Nemnich Rd Saint Louis, MO | 2.0 | 1.5 | 1030 | $1,100 | $1.07 | 43d | 1 | 1.08mi |
| 10203 Trio Ln Saint Louis, MO | 3.0 | 1.0 | 912 | $1,435 | $1.57 | 16d | 1 | 1.09mi |
| 9418 Pattonwood Dr Saint Louis, MO | 2.0 | 2.0 | 982 | $1,500 | $1.53 | 23d | 1 | 1.11mi |
| 10201 McCartney Ln Saint Louis, MO | 3.0 | 2.0 | 1504 | $1,565 | $1.04 | 16d | 1 | 1.14mi |
| 10421 Prince Dr Saint Louis, MO | 3.0 | 2.0 | 1023 | $1,275 | $1.25 | 23d | 1 | 1.17mi |
| 460 Bluff Dr Saint Louis, MO | 3.0 | 1.0 | 1002 | $1,300 | $1.30 | 43d | 1 | 1.19mi |
| 10052 Lilac Ave Saint Louis, MO | 3.0 | 1.5 | 1143 | $1,100 | $0.96 | 7d | 1 | 1.19mi |
| 1238 Hoyt Dr Saint Louis, MO | 3.0 | 1.0 | 1176 | $1,400 | $1.19 | 21d | 1 | 1.21mi |
| 10441 Prince Dr Saint Louis, MO | 4.0 | 1.5 | 1380 | $1,380 | $1.00 | 43d | 1 | 1.21mi |
| 808 Bella Ln Saint Louis, MO | 4.0 | 2.0 | 1300 | $1,650 | $1.27 | 17d | 1 | 1.22mi |
| 435 Adrian Dr Saint Louis, MO | 3.0 | 1.0 | 1100 | $950 | $0.86 | 20d | 1 | 1.25mi |
| 10508 Druid Dr Saint Louis, MO | 3.0 | 1.0 | 1122 | $1,475 | $1.31 | 16d | 1 | 1.26mi |
| 1208 Rapid Dr Saint Louis, MO | 3.0 | 1.0 | 992 | $1,375 | $1.39 | 4d | 1 | 1.27mi |
| 10322 Monarch Dr Saint Louis, MO | 3.0 | 2.0 | 1073 | $1,728 | $1.61 | 23d | 1 | 1.29mi |
| 10201 Gourock Dr Saint Louis, MO | 3.0 | 1.0 | 886 | $1,275 | $1.44 | 43d | 1 | 1.29mi |
| 10409 Count Dr Saint Louis, MO | 3.0 | 1.0 | 912 | $1,100 | $1.21 | 21d | 1 | 1.30mi |
Listing history 7 events
-
2026-06-18days on market $129,900 Active 7 DOM
-
2026-06-17days on market $129,900 Active 6 DOM
-
2026-06-16days on market $129,900 Active 5 DOM
-
2026-06-15days on market $129,900 Active 4 DOM
-
2026-06-13days on market $129,900 Active 2 DOM
-
2026-06-13remarks 351-char remark
-
2026-06-13$129,900 Active 1 DOM
ⓘ Source: listings_history table (triggers on properties + properties_extension) + one-shot
backfill from property_details.listing_events for pre-trigger history.
Tax reassessment forecast MO · Resets to sale price
- Current annual tax
- $1,837 · $153/mo
- Projected year-2 tax
- $1,837 · $153/mo
- Expected delta
- $0/yr ($0/mo · 0.0%)
ⓘ Screening estimate from a state-policy table — verify with the county assessor before closing.
Climate risk First Street
- Flood 1/10 Low FEMA zone X (unshaded) · 0% chance over 30 yrs
- Wildfire 1/10 Low
- Heat 5/10 Major 7 d/yr ≥107°F today · 21 d/yr by 30 yrs out
- Wind 2/10 Low 100% chance of damaging wind over 30 yrs
- Air quality 4/10 Moderate 5 unhealthy d/yr today · 6 by 30 yrs out
Nearby sold comps map
Loading sold comps map…
Walkable amenities ~0.75 mi
Loading nearby amenities…
Taxation est. · year 1
- Rental income
- $17,322
- − Mortgage interest
- −$7,276
- − Property taxes
- −$1,837
- − Insurance
- −$650
- − Repairs & maintenance
- −$1,386
- − Management
- −$1,386
- − Depreciation
- −$3,779
- Taxable income
- $1,008
- Est. tax owed @ 24.0%
- −$242
- After-tax cash flow
- $2,781/yr
For passive investors: Depreciation is non-cash, so a rental often shows a tax loss while cash-flowing — sheltering income. Rental losses are passive: they offset passive income freely, and up to $25,000/yr can offset ordinary (W-2) income if you actively participate and your MAGI is under $100k (phasing out to $0 by $150k); unused losses carry forward. On sale, claimed depreciation is recaptured at up to 25%, and gains may owe capital-gains tax (a 1031 exchange can defer both). Figures are a year-1 estimate at your 24.0% rate — not tax advice; consult a CPA.
Schools (NCES district)
- District
- Riverview Gardens
- NCES district ID
- 2926670
- Math proficiency
- 2% ▼ -6.00%
- Reading proficiency
- 9% ▼ -6.00%
- Median HH income
- $32,759
- Composite
- 4.22/100
- National rank
- #10058
- State rank
- #324 of 324 in MO
Livability — Bellefontaine Neighbors
- Score
- 58/100
- State rank
- #592
- US rank
- #20944
Category grades
Schools grade is shown separately in the Schools card above.
Census & demographics
- Census place
- Bellefontaine Neighbors, MO
- County
- Saint Louis County · 888,823 people
- City population
- 19,684
- Metro
- St. Louis, MO-IL
- Population (ZIP)
- 19,684
- Household income
- $43,422
- Rent vs Own
- Severe rent burden
- 1863.0
Population outlook (St. Louis County) Hauer SSP2
- Today (2025)
- 1,025,227 people
- By 2030
- 1,028,023 · +0.3%
- By 2040
- 1,020,940 · -0.4%
- By 2050
- 1,007,280 · -1.8%
- By 2075
- 987,277 · -3.7%
- By 2100
- 921,984 · -10.1%
Race, ethnicity, and origin ACS 2023
- Neighborhood character
- Predominantly Black (82%)
- Race & ethnicity
- Black 82% White 13% Two or more races 3%
- Common ancestry
- Romanian 1% Lithuanian 1% Italian 1%
- Foreign-born
- 1%
Political lean MEDSL · St. Louis
- 2024 margin
- Strong D (+23.4) · D 60.8% · R 37.4% · Other 1.7%
- 2008→2024 swing
- +3.5pp toward D · 2008: 19.9pp · 2024: 23.4pp
- All cycles
- 2024: D+23.4 2020: D+24.0 2016: D+16.2 2012: D+13.7 2008: D+19.9
Not yet ingested
- Civics
- —
Market trends
- HPI YoY
- ▼ -96.70%
- Current HPI
- 130.6765
- Rent YoY
- ▲ 6.59%
- Metro
- St. Louis, MO-IL
- State GDP YoY
- ▲ 1.84%
- F500 in state
- 20
Industry mix (Fortune 500 HQ in MO)
| Industry | F500 HQs | Revenue |
|---|---|---|
| Healthcare | 1 | $163B |
|
||
| Insurance | 1 | $21B |
|
||
| Industrial Technology | 1 | $17B |
|
||
| Retail | 1 | $16B |
|
||
| Industrial Distribution | 1 | $10B |
|
||
| Utilities | 1 | $9B |
|
||
Price history
+103.0% since first listed13 events — show timeline
- 2026-06-11 Listed $129,900 MARIS as Distributed by MLS Grid
- 2022-02-18 Sold (Public Records) — Public Records
- 2022-02-16 Pending — MARIS as Distributed by MLS Grid
- 2022-02-15 Sold (MLS) — MARIS as Distributed by MLS Grid
- 2022-01-11 Contingent — MARIS as Distributed by MLS Grid
- 2022-01-05 Relisted — MARIS as Distributed by MLS Grid
- 2021-10-08 Pending — MARIS as Distributed by MLS Grid
- 2021-09-08 Contingent — MARIS as Distributed by MLS Grid
- 2021-09-03 Relisted — MARIS as Distributed by MLS Grid
- 2021-08-27 Contingent — MARIS as Distributed by MLS Grid
- 2021-08-18 Listed $85,000 MARIS as Distributed by MLS Grid
- 1997-06-20 Sold (Public Records) $65,900 Public Records
- 1989-02-01 Sold (Public Records) $64,000 Public Records
Property tax history
+4.1%/yrLatest (2022): $1,837 · +0.9% YoY. Source: county tax records.
Cash-flow waterfall
monthlySold comps — $/sqft
last 12 mo · ≤1 miLoading sold comps…