9857 Rembrandt Way · Tyrone, MI
Flood risk No data
- FEMA flood zone
- —
- Chance of flooding over 30 yrs
- —
- Est. flood insurance / yr
- —
Fire risk No data
- Est. fire insurance / yr
- —
Heat risk No data
- Hot days now (above threshold)
- —
- Hot days in 30 yrs
- —
Wind risk No data
- Chance of severe wind over 30 yrs
- —
Air-quality risk No data
- Unhealthy air days now
- —
- Unhealthy air days in 30 yrs
- —
Risk factors via First Street. Map © Google.
Why this score? — see what drove the C+ grade
The composite is a weighted blend of 9 inputs, each scored 0–100. Each bar is that input's sub-score; the figure is the points it added to the 100-point composite (weight × sub-score).
- Cash flow +30.0/30.0
- 1% rule +10.0/10.0
- DSCR +10.0/10.0
- Schools +5.2/10.0
- Rent growth +3.1/5.0
- Livability +2.5/5.0
- Condition / age +2.2/5.0
- ARV discount +0.0/15.0
- Appreciation +0.0/10.0
$110,000
🖨 Deal sheet 📄 Offer letter ✓ Due diligence
Listing remarks
step inside this move-in ready home offering exceptional family living space throughout. The kitchen features abundant cabinet and countertop space along with a central island and seating area, perfect for everyday living and casual dining. A formal dining room provides an ideal setting for hosting gatherings and special occasions. Each bedroom offers generous space, giving every member of the family their own comfortable retreat. Step outside to a large deck designed for outdoor seating and entertaining. Residents will also enjoy outstanding community amenities, including a pool, splash pad, and clubhouse. Conveniently located close to local amenities, this home is a must-see. Schedule you
Key facts
- Central island
- Large deck
- Formal dining room
Tags
Neighborhood map
What this means for you Summary
Snapshot
- This is a 4-bed/2.5-bath single-family listed at $110k. Condition is rated fair.
Deal economics
- At list price, monthly cash flow is $880 ($11k/yr) — positive.
- The deal already cash-flows at list — no discount required.
- Meets the 1% rule at list price ($2k rent vs $110k).
Location & tenants
- Location reads: area grade C — affects rentability + tenant quality, not the cash-flow math above.
- Hartland Consolidated Schools (suburban): math 52% / reading 62% proficiency, ranked #41 of 540 in MI (top 8%) — acceptable for families but not a draw, mixed tenant base, ~2y average lease; only 11% free/reduced lunch — higher-income household profile.
- Market conditions: Rents rising (+2.6%/yr); 311 active listings in the ZIP; 1 comparable units currently listed for rent nearby; solid renter incomes; 488 units permitted in Livingston County in 2024 (0 in 5+ unit buildings).
Forward outlook
- Local home prices are declining (-3.0%/yr); year-one equity from $761 of loan paydown is wiped out by about $3k of value loss. Plan a longer hold.
- Livingston County population projected at +7% by 2050 — modest demand growth; plan on rents tracking national, not racing it.
- At projected returns (-3.0% appreciation + 2.6% rent growth), your $31k cash investment doubles in ~4 years — after that, you're playing with house money.
Negotiation context
- Only 1 days on market — expect competitive offers; lowballing is unlikely to land.
Questions for the listing agent
- Have any recent inspections been done? Can we get a copy of the seller's disclosures and any deferred-maintenance estimates?
- Is there a deadline driving the sale (1031 exchange, divorce, estate, relocation)? That informs how much negotiation room exists.
- What's the average days-on-market for RENTAL listings here right now (not sales)? A rising rental-DOM trend means longer vacancies and softer asking-rent achievability than the comps imply.
- What's the recent tenant-quality profile in this submarket — average credit score on applications, eviction rate, late-payment / NSF rate, and stable-employment percentage? A property-management company in the area should have these aggregated.
- How much new for-sale + rental construction is in the pipeline within 1–3 miles? Heavy new supply typically softens prices + rents 12–24 months out; constrained supply supports both.
Investment metrics
- 1% rule
- 1.89% ✓
- Cap rate
- 15.89%
- Cash-on-cash
- 34.28%
- DSCR
- 2.53
- GRM
- 4.4
CMA / ARV
- ARV (on-the-fly)
- $93,840
- Comps found
- 5
Show comp detail 5 sales within ~0.75 mi
| Address | Dist | Beds/Ba | Sqft | Sold | Price | $/sf | Match |
|---|---|---|---|---|---|---|---|
| 6195 Andora Ave | 0.13mi | 4/2.5 | 2,180 (+7%) | 8mo | $100,000 | $46 | 76 |
| 6252 Juliet Blvd | 0.17mi | 4/2.0 | 2,250 (+10%) | 7mo | $80,000 | $36 | 67 |
| 9922 Macbeth St | 0.34mi | 3/2.0 (-1) | 1,950 (-4%) | 4mo | $159,900 | $82 | 66 |
| 6283 Leigh Ct | 0.15mi | 3/2.0 (-1) | 1,736 (-15%) | 9mo | $68,000 | $39 | 54 |
| 6408 Scenic Way | 0.38mi | 4/2.0 | 1,792 (-12%) | 23mo | $100,000 | $56 | 41 |
Match score weights: distance 35% · size 25% · config 20% · recency 20%. Top-matched comps best support the ARV.
Projected returns pro-forma
-3.0% appreciation · 2.59% rent growth · sell at horizon
- IRR
- 29.2%
- Equity multiple
- 2.21×
- Total profit
- $37,389
- Equity at exit
- $16,401
- IRR
- 36.4%
- Equity multiple
- 4.29×
- Total profit
- $101,367
- Equity at exit
- $9,511
Cash invested: $30,800 (down + closing). Projections, not guarantees.
Landlord ↔ Tenant lean methodology
- Overall (STATE)
- 62 Landlord-Friendly
- State Michigan
- 62 Landlord-Friendly · EVEN
- County
- — inherits STATE
- City
- — inherits STATE
ZIP-level market 48430
- Rents YoY
- 2.6%
- Active inventory
- 311
- Price-to-rent
- 4.4×
Monthly cashflow live
- Estimated rent
- $2,076 medium interval (Pro) →
- Mortgage (P&I)
- −$577
- Tax est. 1.5%
- −$138 /mo · $1,650/yr
- Insurance
- −$46
- HOA
- −$0
- Vacancy / Maint / Mgmt
- −$436
- Net cashflow
- $880
Break-even live
UW: 25.0% down · 7.5% · 30yr · 1.5% tax · 5.0% vac · 8.0% maint · 8.0% mgmt
Financing live
Cash to close
- Down payment
- $27,500
- Closing costs
- $3,300
- Reserves months
- —
- Total cash needed
- —
Loan-product check · same deal, 3 products live
Conventional
25% down · 7.5% · 30yr
- Down + closing
- —
- Monthly P&I
- —
- Monthly cashflow
- —
- DSCR
- —
- Eligible?
- —
Personal DTI + credit; lowest rate.
DSCR
20% down · 8.5% · 30yr
- Down + closing
- —
- Monthly P&I
- —
- Monthly cashflow
- —
- DSCR
- —
- Eligible?
- —
No personal income docs; deal must DSCR.
Hard money
10% down · 12.0% · 12mo
- Down + closing
- —
- Monthly P&I
- —
- Monthly cashflow
- —
- DSCR
- —
- Eligible?
- —
Short-term bridge; refi at stabilization.
Rent comps 1 comps
| Address | Beds | Baths | Sqft | Rent | $/sqft | DOM | Units | Dist |
|---|---|---|---|---|---|---|---|---|
| 9900 Townsquare Blvd Fenton, MI | 3.0 | 2.0 | 1456 | $1,449 | $1.00 | 1d | 1 | 0.07mi |
Listing history 15 events
-
2026-06-19remarks 699-char remark
-
2026-06-19days on market $110,000 Active 1 DOM
-
2026-06-18days on market $110,000 Active 17 DOM
-
2026-06-17days on market $110,000 Active 16 DOM
-
2026-06-16days on market $110,000 Active 15 DOM
-
2026-06-15days on market $110,000 Active 14 DOM
-
2026-06-13days on market $110,000 Active 12 DOM
-
2026-06-13days on market $110,000 Active 11 DOM
-
2026-06-09days on market $110,000 Active 8 DOM
-
2026-06-08days on market $110,000 Active 7 DOM
-
2026-06-07days on market $110,000 Active 6 DOM
-
2026-06-04days on market $110,000 Active 3 DOM
-
2026-06-03days on market $110,000 Active 2 DOM
-
2026-06-02remarks 295-char remark
-
2026-06-02$110,000 Active 1 DOM
ⓘ Source: listings_history table (triggers on properties + properties_extension) + one-shot
backfill from property_details.listing_events for pre-trigger history.
Nearby sold comps map
Loading sold comps map…
Walkable amenities ~0.75 mi
Loading nearby amenities…
Taxation est. · year 1
- Rental income
- $24,911
- − Mortgage interest
- −$6,162
- − Property taxes
- −$1,650
- − Insurance
- −$550
- − Repairs & maintenance
- −$1,993
- − Management
- −$1,993
- − Depreciation
- −$3,200
- Taxable income
- $9,364
- Est. tax owed @ 24.0%
- −$2,247
- After-tax cash flow
- $8,310/yr
For passive investors: Depreciation is non-cash, so a rental often shows a tax loss while cash-flowing — sheltering income. Rental losses are passive: they offset passive income freely, and up to $25,000/yr can offset ordinary (W-2) income if you actively participate and your MAGI is under $100k (phasing out to $0 by $150k); unused losses carry forward. On sale, claimed depreciation is recaptured at up to 25%, and gains may owe capital-gains tax (a 1031 exchange can defer both). Figures are a year-1 estimate at your 24.0% rate — not tax advice; consult a CPA.
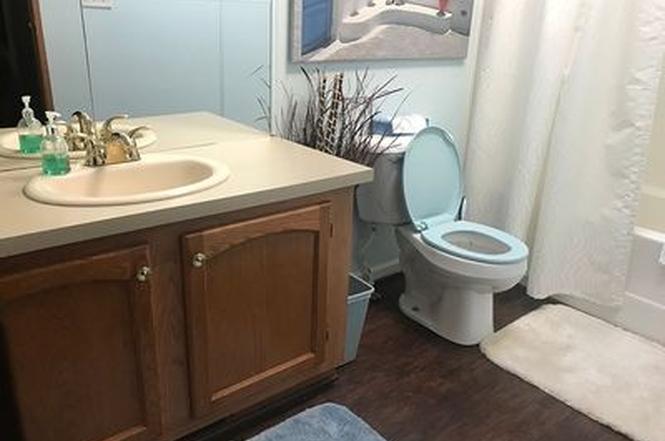
Condition & rehab AI · 2 photos
This home is in fair condition with average systems and minimal visible wear. It requires some cosmetic updates, such as painting and landscaping, to improve its resale and rental value.
Repairs flagged
- Minor Paint — Paint appears slightly faded
Value-add opportunities
- Both Paint exterior and interior — Fresh paint enhances curb appeal and interior aesthetics
- Both Landscaping — Well-maintained landscaping improves curb appeal and adds value
Renovation cost estimate screening
| Repair item | Severity | Est. cost |
|---|---|---|
| Paint · Paint appears slightly faded | Minor | $500–3,000 |
| Total estimated repair cost · 1 items | $500–3,000 |
Value-add ROI direction
- Both Paint exterior and interior — Fresh paint enhances curb appeal and interior aesthetics ↑
- Both Landscaping — Well-maintained landscaping improves curb appeal and adds value ↑
ⓘ Cost ranges are severity-bucket heuristics (US national rule-of-thumb). Get contractor quotes + a written scope before underwriting a rehab budget.
Schools (NCES district)
- District
- Hartland Consolidated Schools
- NCES district ID
- 2617910
- Math proficiency
- 52% ▼ -8.00%
- Reading proficiency
- 62% ▼ -7.00%
- Median HH income
- $85,269
- Composite
- 51.93/100
- National rank
- #1647
- State rank
- #41 of 540 in MI
Livability — Tyrone
No livability data for this city. (Only ~50 U.S. cities are tracked.)
Census & demographics
- County
- Livingston County · 121,626 people
- Metro
- Detroit-Warren-Dearborn, MI
- Population (ZIP)
- 39,309
- Household income
- $100,193
- Rent vs Own
- Severe rent burden
- 642.0
Population outlook (Livingston County) Hauer SSP2
- Today (2025)
- 202,920 people
- By 2030
- 209,173 · +3.1%
- By 2040
- 216,878 · +6.9%
- By 2050
- 217,485 · +7.2%
- By 2075
- 217,590 · +7.2%
- By 2100
- 197,095 · -2.9%
Race, ethnicity, and origin ACS 2023
- Neighborhood character
- Predominantly White (91%)
- Race & ethnicity
- White 91% Two or more races 4% Hispanic / Latino 3% Asian 1% Black 1%
- Common ancestry
- Romanian 10% Lithuanian 5% Slovak 3%
- Foreign-born
- 2% · Canada
- Languages at home
- 97% English-only · Spanish 1% Other Asian/Pacific 1% Other Indo-European 1%
Political lean MEDSL · Livingston
- 2024 margin
- Strong R (+23.9) · D 37.4% · R 61.3% · Other 1.3%
- 2008→2024 swing
- -10.7pp toward R · 2008: -13.3pp · 2024: -23.9pp
- All cycles
- 2024: R+23.9 2020: R+22.6 2016: R+29.6 2012: R+23.3 2008: R+13.3
Not yet ingested
- Civics
- —
Market trends
- HPI YoY
- ▼ -298.66%
- Current HPI
- 238.8371
- Rent YoY
- ▲ 2.59%
- Metro
- Detroit-Warren-Dearborn, MI
- State GDP YoY
- ▲ 1.37%
- F500 in state
- 28
Industry mix (Fortune 500 HQ in MI)
| Industry | F500 HQs | Revenue |
|---|---|---|
| Automotive Parts | 3 | $48B |
|
||
| Automotive | 2 | $372B |
|
||
| Chemicals | 1 | $45B |
|
||
| Automotive Retail | 1 | $29B |
|
||
| Healthcare / Medical Devices | 1 | $23B |
|
||
| Automotive Technology | 1 | $20B |
|
||
Price history
1 event — show timeline
- 2026-06-02 Listed $110,000 FSBO.com
Cash-flow waterfall
monthlySold comps — $/sqft
last 12 mo · ≤1 miLoading sold comps…