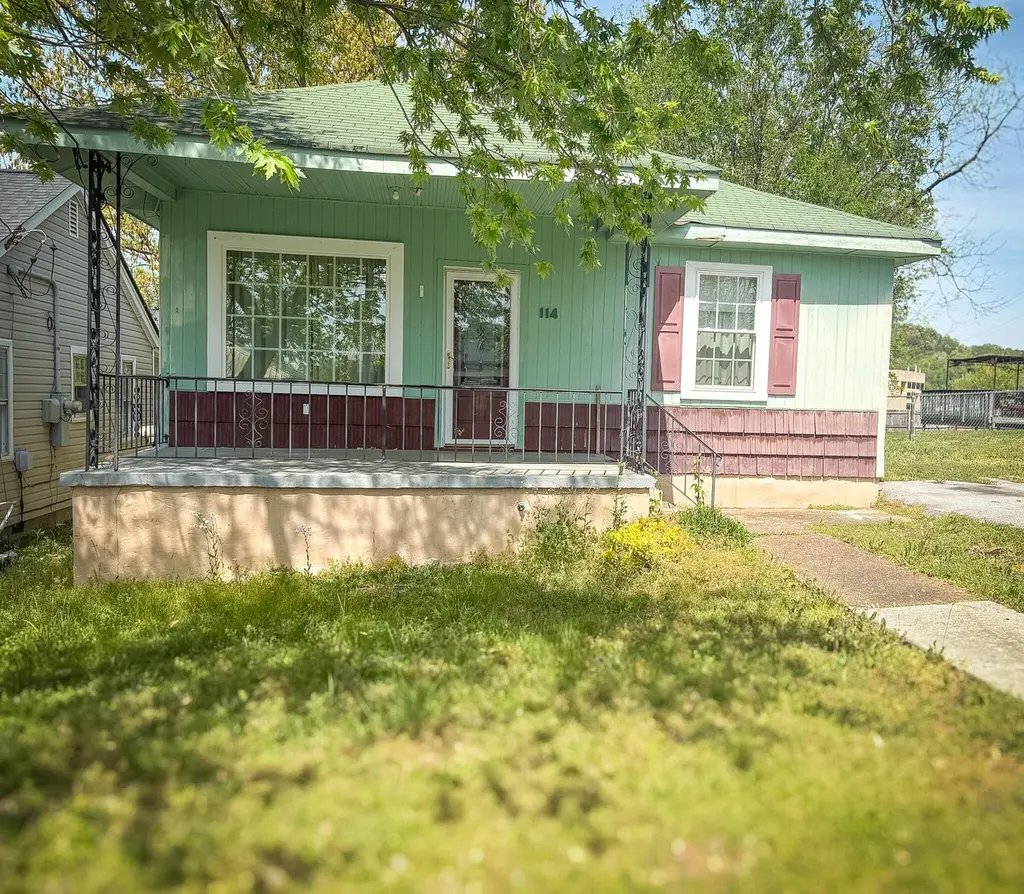
114 Wilson St · Rossville, GA
Flood risk 1/10 · Minimal
- FEMA flood zone
- X (unshaded)
- Chance of flooding over 30 yrs
- 0.0%
- Est. flood insurance / yr
- $507 – $1,088
Fire risk 4/10 · Minor
- Est. fire insurance / yr
- $963 – $1,789
Heat risk 6/10 · Moderate
- Hot days now (above 104°F)
- 7 days/yr
- Hot days in 30 yrs
- 21 days/yr
Wind risk 4/10 · Minor
- Chance of severe wind over 30 yrs
- 11.0%
Air-quality risk 3/10 · Minor
- Unhealthy air days now
- 2 days/yr
- Unhealthy air days in 30 yrs
- 2 days/yr
Risk factors via First Street. Map © Google.
Why this score? — see what drove the C grade
The composite is a weighted blend of 9 inputs, each scored 0–100. Each bar is that input's sub-score; the figure is the points it added to the 100-point composite (weight × sub-score).
- Cash flow +21.4/30.0
- ARV discount +12.4/15.0
- DSCR +6.8/10.0
- Rent growth +4.4/5.0
- 1% rule +4.3/10.0
- Livability +2.8/5.0
- Condition / age +2.5/5.0
- Schools +2.3/10.0
- Appreciation +0.0/10.0
$131,000
🖨 Deal sheet 📄 Offer letter ✓ Due diligence
Listing remarks MLS
Unlock the potential in this charming 2-bedroom, 1-bath home with 896 square feet of living space! Featuring a kitchen with generous cabinetry full of character and a primary suite with built-in shelving, this home offers a great starting point to make your own. Enjoy the convenience of alley access and a wide gate for easy backyard parking. Situated in a growing area just minutes from the popular new eateries along McFarland Ave, this is an exciting opportunity you won't want to miss!
Key facts
- Alley access
- Wide gate
- Generous cabinetry
Tags
Neighborhood map
What this means for you Summary
Snapshot
- This is a 2-bed/1.0-bath single-family listed at $131k.
Deal economics
- At list price, monthly cash flow is $195 ($2k/yr) — positive.
- The deal already cash-flows at list — no discount required.
- To meet the 1% rule (rent ≥ 1% of price), the offer needs to be $122k (7.1% below list).
- Recommended offer: $122k (7.1% below list) — sets the bar for 1% rule.
- Cap rate 8.1% vs local median 5.3% in Rossville — top-decile yield for the area; either an underpriced asset or a hidden risk that comps aren't pricing in. Stress-test before assuming the spread holds.
Location & tenants
- Location reads 56/100 on livability (#484 in GA) — a working-class tenant base; expect higher turnover. Strengths: cost of living A+, housing A-, crime B+; Watch: schools F, amenities F, commute F.
- Walker County (rural): math 25% / reading 29% proficiency, ranked #114 of 174 in GA (top 66%) — low school quality limits family demand, transient renter base, plan for 1-2y turnover; 61% free/reduced lunch — lower-income household profile, screen leases tightly.
- Market conditions: Rents rising fast (+7.4%/yr); 425 active listings in the ZIP; 18 comparable units currently listed for rent nearby; rentals at typical pace (median 21d on market — plan ~3-4 weeks tenant-placement turnaround); 347 units permitted in Walker County in 2024 (24 in 5+ unit buildings).
Forward outlook
- Local home prices are declining (-3.0%/yr); year-one equity from $906 of loan paydown is wiped out by about $4k of value loss. Plan a longer hold.
- Walker County population projected at -16% by 2050 — secular population decline; favor cash flow + early exit over multi-decade hold.
- At projected returns (-3.0% appreciation + 7.4% rent growth), your $37k cash investment doubles in ~9 years — after that, you're playing with house money.
Negotiation context
- It's been on market 69 days — a 6% lower offer ($123k) is reasonable based on typical stale-listing flexibility.
Risks & watch-outs
- Watch-outs: built in 1920 — expect roof / HVAC / electrical / plumbing capex.
- Climate carrying-cost: extreme-heat days projected 7→21/yr by 2055 (HVAC capex compounding) — expect insurance premiums to compound above CPI over the hold.
Questions for the listing agent
- It's been on market 69 days. Have you received any prior offers? Is the seller open to a 7% concession, seller financing, or rate buy-down credit?
- Built in 1920 — when were the roof, HVAC, electrical panel, plumbing, and water heater last replaced?
- Why hasn't it sold? Are there any deal-killer items the seller is aware of (foundation, flood, title, zoning, code violations)?
- Is there a deadline driving the sale (1031 exchange, divorce, estate, relocation)? That informs how much negotiation room exists.
- Schools are F-rated, which usually means shorter tenancies and higher turnover. Who's the typical renter profile here, and what's been the actual vacancy rate?
- What's the average days-on-market for RENTAL listings here right now (not sales)? A rising rental-DOM trend means longer vacancies and softer asking-rent achievability than the comps imply.
- What's the recent tenant-quality profile in this submarket — average credit score on applications, eviction rate, late-payment / NSF rate, and stable-employment percentage? A property-management company in the area should have these aggregated.
- How much new for-sale + rental construction is in the pipeline within 1–3 miles? Heavy new supply typically softens prices + rents 12–24 months out; constrained supply supports both.
Investment metrics
- 1% rule
- 0.93% ✗
- Cap rate
- 8.08%
- Cash-on-cash
- 6.38%
- DSCR
- 1.28
- GRM
- 9.0
CMA / ARV
- ARV (median comp)
- $147,009
- List price
- $131,000
- Delta
- -10.89%
- Verdict
- UNDERPRICED
- Comps
- 20 within 1.0 mi
Show comp detail 12 sales within ~0.75 mi
| Address | Dist | Beds/Ba | Sqft | Sold | Price | $/sf | Match |
|---|---|---|---|---|---|---|---|
| 106 Beech St | 0.19mi | 2/1.0 | 848 (-5%) | 11mo | $45,000 | $53 | 73 |
| 207 Wilson St | 0.06mi | 2/1.0 | 1,016 (+13%) | 2mo | $140,000 | $138 | 73 |
| 801 Lee Ave | 0.60mi | 2/1.0 | 856 (-4%) | 2mo | $160,000 | $187 | 63 |
| 712 Henderson Ave | 0.65mi | 2/1.0 | 928 (+4%) | 2mo | $135,000 | $145 | 62 |
| 1204 Wooden Ave | 0.72mi | 2/1.0 | 925 (+3%) | 5mo | $85,000 | $92 | 57 |
| 707 Bronson St | 0.33mi | 3/1.0 (+1) | 1,008 (+12%) | 5mo | $175,000 | $174 | 55 |
| 102 Mt View Dr | 0.56mi | 2/1.0 | 817 (-9%) | 9mo | $90,000 | $110 | 52 |
| 129 Summitt St | 0.63mi | 2/1.5 | 960 (+7%) | 9mo | $175,000 | $182 | 49 |
| 1502 E 49th St | 0.48mi | 3/1.0 (+1) | 980 (+9%) | 10mo | $129,000 | $132 | 49 |
| 2806 E 46th St | 0.57mi | 1/1.0 (-1) | 798 (-11%) | 3mo | $50,000 | $63 | 48 |
| 505 Carden Ave | 0.55mi | 3/1.0 (+1) | 980 (+9%) | 9mo | $157,000 | $160 | 46 |
| 803 Lee Ave | 0.61mi | 2/1.5 | 815 (-9%) | 11mo | $149,000 | $183 | 45 |
Match score weights: distance 35% · size 25% · config 20% · recency 20%. Top-matched comps best support the ARV.
Projected returns pro-forma
-3.0% appreciation · 7.44% rent growth · sell at horizon
- IRR
- -2.2%
- Equity multiple
- 0.91×
- Total profit
- $-3,202
- Equity at exit
- $19,533
- IRR
- 11.3%
- Equity multiple
- 2.05×
- Total profit
- $38,468
- Equity at exit
- $11,326
Cash invested: $36,680 (down + closing). Projections, not guarantees.
Landlord ↔ Tenant lean methodology
- Overall (STATE)
- 90 Strongly Landlord-Friendly
- State Georgia
- 90 Strongly Landlord-Friendly · R+3
- County
- — inherits STATE
- City
- — inherits STATE
ZIP-level market 30741
- Home prices YoY
- -30.7%
- Rents YoY
- 7.4%
- Active inventory
- 425
- Price-to-rent
- 9.0×
Monthly cashflow live
- Estimated rent
- $1,217 high interval (Pro) →
- Mortgage (P&I)
- −$687
- Tax from tax record
- −$25 /mo · $298/yr
- Insurance
- −$55
- HOA
- −$0
- Vacancy / Maint / Mgmt
- −$256
- Net cashflow
- $195
Break-even live
UW: 25.0% down · 7.5% · 30yr · 1.5% tax · 5.0% vac · 8.0% maint · 8.0% mgmt
Financing live
Cash to close
- Down payment
- $32,750
- Closing costs
- $3,930
- Reserves months
- —
- Total cash needed
- —
Loan-product check · same deal, 3 products live
Conventional
25% down · 7.5% · 30yr
- Down + closing
- —
- Monthly P&I
- —
- Monthly cashflow
- —
- DSCR
- —
- Eligible?
- —
Personal DTI + credit; lowest rate.
DSCR
20% down · 8.5% · 30yr
- Down + closing
- —
- Monthly P&I
- —
- Monthly cashflow
- —
- DSCR
- —
- Eligible?
- —
No personal income docs; deal must DSCR.
Hard money
10% down · 12.0% · 12mo
- Down + closing
- —
- Monthly P&I
- —
- Monthly cashflow
- —
- DSCR
- —
- Eligible?
- —
Short-term bridge; refi at stabilization.
Rent comps 18 comps
| Address | Beds | Baths | Sqft | Rent | $/sqft | DOM | Units | Dist |
|---|---|---|---|---|---|---|---|---|
| 505 Flegal Ave Rossville, GA | 2.0 | 1.0 | 768 | $1,050 | $1.37 | 23d | 1 | 0.50mi |
| 515 W Gordon Ave Rossville, GA | 2.0 | 1.0 | 906 | $999 | $1.10 | 43d | 1 | 0.52mi |
| 304 Cherry St Rossville, GA | 2.0 | 1.0 | 982 | $1,675 | $1.71 | 43d | 1 | 0.57mi |
| 1591 Park City Rd Apt E15 Rossville, GA | 2.0 | 1.0 | 1050 | $1,145 | $1.09 | 23d | 1 | 0.59mi |
| 813 Chickamauga Ave Unit A Rossville, GA | 2.0 | 1.0 | 900 | $1,099 | $1.22 | 23d | 1 | 0.66mi |
| 804 Henderson Ave Rossville, GA | 2.0 | 1.0 | 948 | $1,025 | $1.08 | 13d | 1 | 0.69mi |
| 817 Henderson Ave Rossville, GA | 2.0 | 1.0 | 844 | $1,150 | $1.36 | 13d | 1 | 0.75mi |
| 819 Asterwood Dr Unit B Rossville, GA | 2.0 | 2.0 | 975 | $1,445 | $1.48 | 13d | 1 | 0.93mi |
| 340 Alpine Dr Rossville, GA | 2.0 | 1.0 | 836 | $1,275 | $1.53 | 13d | 1 | 1.01mi |
| 108 Suggs St Rossville, GA | 2.0 | 1.0 | 900 | $1,525 | $1.69 | 13d | 1 | 1.05mi |
| 1007 Glentana St Lot 62 Rossville, GA | 2.0 | 2.0 | 840 | $35,995 | $42.85 | 43d | 1 | 1.16mi |
| 107 Stegall St Rossville, GA | 2.0 | 1.5 | 986 | $1,149 | $1.17 | 13d | 1 | 1.21mi |
| 2904 E 37th St Chattanooga, TN | 1.0 | 1.0 | 800 | $850 | $1.06 | 23d | 1 | 1.23mi |
| 1106 Carline Rd Apt B Rossville, GA | 2.0 | 1.5 | 877 | $1,095 | $1.25 | 21d | 1 | 1.31mi |
| 1106 Carline Rd Rossville, GA | 2.0 | 1.5 | 1012 | $1,095 | $1.08 | 13d | 1 | 1.31mi |
| 124 Callan Dr Rossville, GA | 1.0 | 1.0 | 600 | $899 | $1.50 | 23d | 1 | 1.47mi |
| 3380 Shadowlawn Dr Unit 2 Chattanooga, TN | 2.0 | 2.0 | 629 | $1,323 | $2.10 | 13d | 1 | 1.48mi |
| 3392 Shadowlawn Dr Unit A East Ridge, TN | 1.0 | 1.0 | 800 | $1,003 | $1.25 | 13d | 1 | 1.49mi |
Listing history 19 events
-
2026-06-18days on market $131,000 Active 69 DOM
-
2026-06-17days on market $131,000 Active 68 DOM
-
2026-06-16days on market $131,000 Active 67 DOM
-
2026-06-15days on market $131,000 Active 66 DOM
-
2026-06-14days on market $131,000 Active 64 DOM
-
2026-06-13days on market $131,000 Active 63 DOM
-
2026-06-10days on market $131,000 Active 61 DOM
-
2026-06-09days on market $131,000 Active 60 DOM
-
2026-06-08days on market $131,000 Active 59 DOM
-
2026-06-07days on market $131,000 Active 58 DOM
-
2026-06-05days on market $131,000 Active 55 DOM
-
2026-06-03days on market $131,000 Active 54 DOM
-
2026-06-02days on market $131,000 Active 53 DOM
-
2026-06-01days on market $131,000 Active 52 DOM
-
2026-05-31days on market $131,000 Active 51 DOM
-
2026-05-30days on market $131,000 Active 50 DOM
-
2026-05-09price $131,000 490-char remark
Show marketing remark (490 chars)
Unlock the potential in this charming 2-bedroom, 1-bath home with 896 square feet of living space! Featuring a kitchen with generous cabinetry full of character and a primary suite with built-in shelving, this home offers a great starting point to make your own. Enjoy the convenience of alley access and a wide gate for easy backyard parking. Situated in a growing area just minutes from the popular new eateries along McFarland Ave, this is an exciting opportunity you won't want to miss!
-
2026-04-25price $135,000 490-char remark
Show marketing remark (490 chars)
Unlock the potential in this charming 2-bedroom, 1-bath home with 896 square feet of living space! Featuring a kitchen with generous cabinetry full of character and a primary suite with built-in shelving, this home offers a great starting point to make your own. Enjoy the convenience of alley access and a wide gate for easy backyard parking. Situated in a growing area just minutes from the popular new eateries along McFarland Ave, this is an exciting opportunity you won't want to miss!
-
2026-04-11$145,000 Active 490-char remark
Show marketing remark (490 chars)
Unlock the potential in this charming 2-bedroom, 1-bath home with 896 square feet of living space! Featuring a kitchen with generous cabinetry full of character and a primary suite with built-in shelving, this home offers a great starting point to make your own. Enjoy the convenience of alley access and a wide gate for easy backyard parking. Situated in a growing area just minutes from the popular new eateries along McFarland Ave, this is an exciting opportunity you won't want to miss!
ⓘ Source: listings_history table (triggers on properties + properties_extension) + one-shot
backfill from property_details.listing_events for pre-trigger history.
Tax reassessment forecast GA · Resets to sale price
- Current annual tax
- $298 · $25/mo
- Projected year-2 tax
- $1,205 · $100/mo
- Expected delta
- +$907/yr (+$76/mo · 304.6%)
ⓘ Screening estimate from a state-policy table — verify with the county assessor before closing.
Climate risk First Street
- Flood 1/10 Low FEMA zone X (unshaded) · 0% chance over 30 yrs
- Wildfire 4/10 Moderate
- Heat 6/10 Major 7 d/yr ≥104°F today · 21 d/yr by 30 yrs out
- Wind 4/10 Moderate 11% chance of damaging wind over 30 yrs
- Air quality 3/10 Moderate 2 unhealthy d/yr today · 2 by 30 yrs out
Nearby sold comps map
Loading sold comps map…
Walkable amenities ~0.75 mi
Loading nearby amenities…
Taxation est. · year 1
- Rental income
- $14,602
- − Mortgage interest
- −$7,338
- − Property taxes
- −$298
- − Insurance
- −$655
- − Repairs & maintenance
- −$1,168
- − Management
- −$1,168
- − Depreciation
- −$3,811
- Taxable income
- $164
- Est. tax owed @ 24.0%
- −$39
- After-tax cash flow
- $2,300/yr
For passive investors: Depreciation is non-cash, so a rental often shows a tax loss while cash-flowing — sheltering income. Rental losses are passive: they offset passive income freely, and up to $25,000/yr can offset ordinary (W-2) income if you actively participate and your MAGI is under $100k (phasing out to $0 by $150k); unused losses carry forward. On sale, claimed depreciation is recaptured at up to 25%, and gains may owe capital-gains tax (a 1031 exchange can defer both). Figures are a year-1 estimate at your 24.0% rate — not tax advice; consult a CPA.
Schools (NCES district)
- District
- Walker County
- NCES district ID
- 1305370
- Math proficiency
- 25% ▼ -10.00%
- Reading proficiency
- 29% ▼ -10.00%
- Median HH income
- $39,889
- Composite
- 22.74/100
- National rank
- #8035
- State rank
- #114 of 174 in GA
Livability — Rossville
- Score
- 56/100
- State rank
- #484
- US rank
- #22540
Category grades
Schools grade is shown separately in the Schools card above.
Census & demographics
- Census place
- Rossville, GA
- County
- Walker County · 48,831 people
- City population
- 30,041
- Metro
- Chattanooga, TN-GA
- Population (ZIP)
- 30,041
- Household income
- $58,834
- Rent vs Own
- Severe rent burden
- 834.0
Population outlook (Walker County) Hauer SSP2
- Today (2025)
- 66,050 people
- By 2030
- 64,305 · -2.6%
- By 2040
- 60,127 · -9.0%
- By 2050
- 55,551 · -15.9%
- By 2075
- 44,886 · -32.0%
- By 2100
- 34,015 · -48.5%
Race, ethnicity, and origin ACS 2023
- Neighborhood character
- Predominantly White (86%)
- Race & ethnicity
- White 86% Black 5% Two or more races 5% Hispanic / Latino 5%
- Common ancestry
- Slovak 3% Iranian 2% Italian 1%
- Foreign-born
- 2% · Canada
- Languages at home
- 96% English-only · Spanish 3%
Political lean MEDSL · Walker
- 2024 margin
- Solid R (+59.3) · D 20.1% · R 79.4%
- 2008→2024 swing
- -12.5pp toward R · 2008: -46.8pp · 2024: -59.3pp
- All cycles
- 2024: R+59.3 2020: R+59.3 2016: R+61.5 2012: R+50.2 2008: R+46.8
Not yet ingested
- Civics
- —
Market trends
- HPI YoY
- ▼ -118.05%
- Current HPI
- 267.0047
- Rent YoY
- ▲ 7.44%
- Metro
- Chattanooga, TN-GA
- State GDP YoY
- ▲ 2.66%
- F500 in state
- 28
Industry mix (Fortune 500 HQ in GA)
| Industry | F500 HQs | Revenue |
|---|---|---|
| Paper / Packaging | 2 | $29B |
|
||
| Retail | 1 | $160B |
|
||
| Transportation / Logistics | 1 | $91B |
|
||
| Airlines | 1 | $62B |
|
||
| Consumer Goods | 1 | $47B |
|
||
| Utilities | 1 | $25B |
|
||
Price history
-9.7% since first listed3 events — show timeline
- 2026-05-09 Price Changed $131,000 GCAR
- 2026-04-25 Price Changed $135,000 GCAR
- 2026-04-11 Listed $145,000 GCAR
Property tax history
-2.6%/yrLatest (2025): $298 · -5.2% YoY. Source: county tax records.
Cash-flow waterfall
monthlySold comps — $/sqft
last 12 mo · ≤1 miLoading sold comps…