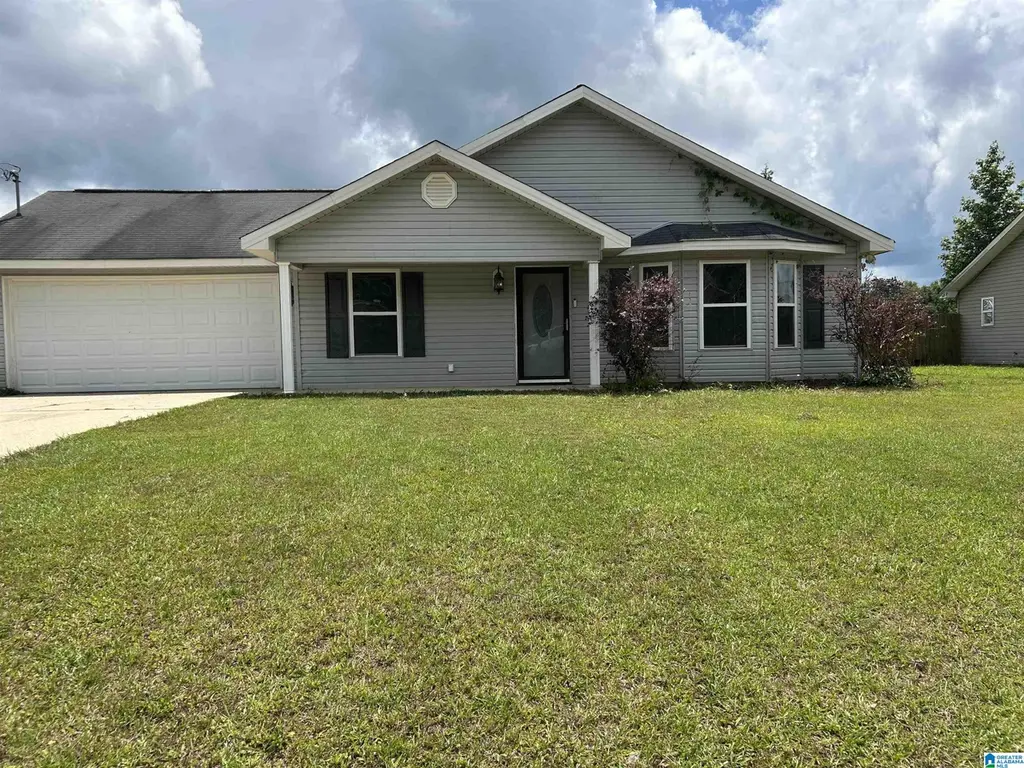
18487 Thoroughbred Dr · Vance, AL
Flood risk 1/10 · Minimal
- FEMA flood zone
- X (unshaded)
- Chance of flooding over 30 yrs
- 0.0%
- Est. flood insurance / yr
- $507 – $1,088
Fire risk 5/10 · Moderate
- Est. fire insurance / yr
- $916 – $1,700
Heat risk 7/10 · Major
- Hot days now (above 107°F)
- 7 days/yr
- Hot days in 30 yrs
- 20 days/yr
Wind risk 6/10 · Moderate
- Chance of severe wind over 30 yrs
- 55.0%
Air-quality risk 2/10 · Minimal
- Unhealthy air days now
- 1 days/yr
- Unhealthy air days in 30 yrs
- 3 days/yr
Risk factors via First Street. Map © Google.
Why this score? — see what drove the C- grade
The composite is a weighted blend of 9 inputs, each scored 0–100. Each bar is that input's sub-score; the figure is the points it added to the 100-point composite (weight × sub-score).
- Cash flow +16.9/30.0
- Appreciation +10.0/10.0
- ARV discount +6.5/15.0
- DSCR +5.3/10.0
- 1% rule +3.3/10.0
- Livability +3.2/5.0
- Schools +2.9/10.0
- Rent growth +2.5/5.0
- Condition / age +2.5/5.0
$199,000
🖨 Deal sheet 📄 Offer letter ✓ Due diligence
Listing remarks
The home is located in Vance, Al in the Bridle Brook Subdivision. Home has new flooring and has been freshly painted throughout.
Key facts
- New flooring
- Freshly painted
- 0.4 acre lot
Tags
Property features AI
Finance
- Other: Located in the Bridle Brook subdivision (Lot 29)
- HOA & community: No association fee
Exterior
- Parking: Front entry attached 2-car garage
- Utilities: Public water; Septic system; Electric water heater; Internet availability unknown
- Home design: Vinyl-sided exterior; Slab foundation; Existing construction
- Construction: Vinyl siding
- Exterior features: Open patio; Porch; Garden/patio area
Interior
- Kitchen: Laminate countertops; Dishwasher (built-in); Self-cleaning oven; Refrigerator; Electric stove
- Bedrooms: Master bedroom (main level); Additional bedrooms (main level)
- Flooring: Vinyl flooring
- Bathrooms: Two full bathrooms; Tub/shower combo
- Heating & cooling: Forced air heating; Central cooling
- Interior features: Tray ceilings; Bay window
- Laundry & utility: Main-level laundry room; Washer hookup; Electric dryer hookup; Pull-down attic
Neighborhood map
What this means for you Summary
Snapshot
- This is a 3-bed/1.0-bath single-family listed at $199k.
Deal economics
- At list price, monthly cash flow is $132 ($2k/yr) — positive.
- The deal already cash-flows at list — no discount required.
- To meet the 1% rule (rent ≥ 1% of price), the offer needs to be $164k (17.4% below list).
- Recommended offer: $164k (17.4% below list) — sets the bar for 1% rule.
- Cap rate 7.1% vs local median 4.6% in Vance — top-decile yield for the area; either an underpriced asset or a hidden risk that comps aren't pricing in. Stress-test before assuming the spread holds.
Location & tenants
- Location reads 65/100 on livability (#117 in AL) — a middle-class / working-renter tenant base. Strengths: cost of living A+, housing A+, employment B+; Watch: health & safety D, amenities F, commute F.
- Tuscaloosa County (suburban): math 21% / reading 45% proficiency, ranked #47 of 129 in AL (top 36%) — families likely to look elsewhere, expect single-tenant / working-renter base with shorter leases.
- Zoned schools: Vance Elementary School (math 22% / reading 37%, grade F, #367 of 627 statewide, top 60%, 499 students, 69% FRL); Brookwood High School (math 22% / reading 27%, grade F, #118 of 305 statewide, top 45%, 1,078 students, 58% FRL) — zoned schools average 63% FRL vs 45% district-wide (18 pts higher); higher-poverty schools than district average — tighter screening recommended.
- Market conditions: 79 active listings in the ZIP; solid renter incomes; 622 units permitted in Tuscaloosa County in 2024 (69 in 5+ unit buildings).
Forward outlook
- In year one you build about $21k of equity ($1k loan paydown + $20k appreciation (10.0% local appreciation)).
- Tuscaloosa County population projected at +26% by 2050 — long-run rental-demand tailwind backs the buy-and-hold thesis.
- At projected returns (10.0% appreciation + 3.0% rent growth), your $56k cash investment doubles in ~3 years — after that, you're playing with house money.
- By year 2, paydown + projected appreciation supports a ~$34k cash-out refi (75% LTV) — recoverable capital for the next deal without selling this one.
Negotiation context
- Only 7 days on market — expect competitive offers; lowballing is unlikely to land.
- 2 sale attempts since 3y ago with the ask held roughly flat each time — persistent listings suggest the price (not the market) is what's stuck; bring a comps-based counter.
- Current owner paid $113k; list at $199k implies a 76% gain — meaningful room to come down on a strong offer.
Risks & watch-outs
- Climate carrying-cost: major wind risk, 55% chance of damaging wind over 30y; moderate wildfire risk; extreme-heat days projected 7→20/yr by 2055 (HVAC capex compounding) — expect insurance premiums to compound above CPI over the hold.
Questions for the listing agent
- Is there a deadline driving the sale (1031 exchange, divorce, estate, relocation)? That informs how much negotiation room exists.
- Schools are D-rated, which usually means shorter tenancies and higher turnover. Who's the typical renter profile here, and what's been the actual vacancy rate?
- What's the average days-on-market for RENTAL listings here right now (not sales)? A rising rental-DOM trend means longer vacancies and softer asking-rent achievability than the comps imply.
- What's the recent tenant-quality profile in this submarket — average credit score on applications, eviction rate, late-payment / NSF rate, and stable-employment percentage? A property-management company in the area should have these aggregated.
- How much new for-sale + rental construction is in the pipeline within 1–3 miles? Heavy new supply typically softens prices + rents 12–24 months out; constrained supply supports both.
Investment metrics
- 1% rule
- 0.83% ✗
- Cap rate
- 7.09%
- Cash-on-cash
- 2.85%
- DSCR
- 1.13
- GRM
- 10.1
CMA / ARV
- ARV (on-the-fly)
- $194,732
- Comps found
- 3
Show comp detail 3 sales within ~0.75 mi
| Address | Dist | Beds/Ba | Sqft | Sold | Price | $/sf | Match |
|---|---|---|---|---|---|---|---|
| 18412 Arabian Dr | 0.04mi | 3/2.0 | 1,137 (+4%) | 1mo | $226,500 | $199 | 87 |
| 18393 Arabian Dr | 0.10mi | 3/2.0 | 1,060 (-3%) | 6mo | $189,000 | $178 | 81 |
| 18480 Thoroughbred Dr | 0.04mi | 3/2.0 | 1,117 (+2%) | 19mo | $197,500 | $177 | 75 |
Match score weights: distance 35% · size 25% · config 20% · recency 20%. Top-matched comps best support the ARV.
Projected returns pro-forma
10.0% appreciation · 3.0% rent growth · sell at horizon
- IRR
- 26.3%
- Equity multiple
- 3.09×
- Total profit
- $116,703
- Equity at exit
- $179,275
- IRR
- 23.1%
- Equity multiple
- 7.05×
- Total profit
- $336,838
- Equity at exit
- $386,613
Cash invested: $55,720 (down + closing). Projections, not guarantees.
Landlord ↔ Tenant lean methodology
- Overall (STATE)
- 90 Strongly Landlord-Friendly
- State Alabama
- 90 Strongly Landlord-Friendly · R+15
- County
- — inherits STATE
- City
- — inherits STATE
ZIP-level market 35490
- Home prices YoY
- 5.8%
- Active inventory
- 79
- Price-to-rent
- 10.1×
Monthly cashflow live
- Estimated rent
- $1,643 medium interval (Pro) →
- Mortgage (P&I)
- −$1,044
- Tax from tax record
- −$39 /mo · $469/yr
- Insurance
- −$83
- HOA
- −$0
- Vacancy / Maint / Mgmt
- −$345
- Net cashflow
- $132
Break-even live
UW: 25.0% down · 7.5% · 30yr · 1.5% tax · 5.0% vac · 8.0% maint · 8.0% mgmt
Financing live
Cash to close
- Down payment
- $49,750
- Closing costs
- $5,970
- Reserves months
- —
- Total cash needed
- —
Loan-product check · same deal, 3 products live
Conventional
25% down · 7.5% · 30yr
- Down + closing
- —
- Monthly P&I
- —
- Monthly cashflow
- —
- DSCR
- —
- Eligible?
- —
Personal DTI + credit; lowest rate.
DSCR
20% down · 8.5% · 30yr
- Down + closing
- —
- Monthly P&I
- —
- Monthly cashflow
- —
- DSCR
- —
- Eligible?
- —
No personal income docs; deal must DSCR.
Hard money
10% down · 12.0% · 12mo
- Down + closing
- —
- Monthly P&I
- —
- Monthly cashflow
- —
- DSCR
- —
- Eligible?
- —
Short-term bridge; refi at stabilization.
Listing history 7 events
-
2026-06-18days on market $199,000 Active 7 DOM
-
2026-06-17days on market $199,000 Active 6 DOM
-
2026-06-16days on market $199,000 Active 5 DOM
-
2026-06-15days on market $199,000 Active 4 DOM
-
2026-06-14days on market $199,000 Active 2 DOM
-
2026-06-13remarks 128-char remark
-
2026-06-13$199,000 Active 1 DOM
ⓘ Source: listings_history table (triggers on properties + properties_extension) + one-shot
backfill from property_details.listing_events for pre-trigger history.
Tax reassessment forecast AL · Resets to sale price
- Current annual tax
- $469 · $39/mo
- Projected year-2 tax
- $816 · $68/mo
- Expected delta
- +$346/yr (+$29/mo · 73.8%)
ⓘ Screening estimate from a state-policy table — verify with the county assessor before closing.
Climate risk First Street
- Flood 1/10 Low FEMA zone X (unshaded) · 0% chance over 30 yrs
- Wildfire 5/10 Major
- Heat 7/10 Severe 7 d/yr ≥107°F today · 20 d/yr by 30 yrs out
- Wind 6/10 Major 55% chance of damaging wind over 30 yrs
- Air quality 2/10 Low 1 unhealthy d/yr today · 3 by 30 yrs out
Nearby sold comps map
Loading sold comps map…
Walkable amenities ~0.75 mi
Loading nearby amenities…
Taxation est. · year 1
- Rental income
- $19,715
- − Mortgage interest
- −$11,147
- − Property taxes
- −$469
- − Insurance
- −$995
- − Repairs & maintenance
- −$1,577
- − Management
- −$1,577
- − Depreciation
- −$5,789
- Taxable loss
- −$1,840
- Est. tax savings @ 24.0%
- +$442
- After-tax cash flow
- $2,029/yr
For passive investors: Depreciation is non-cash, so a rental often shows a tax loss while cash-flowing — sheltering income. Rental losses are passive: they offset passive income freely, and up to $25,000/yr can offset ordinary (W-2) income if you actively participate and your MAGI is under $100k (phasing out to $0 by $150k); unused losses carry forward. On sale, claimed depreciation is recaptured at up to 25%, and gains may owe capital-gains tax (a 1031 exchange can defer both). Figures are a year-1 estimate at your 24.0% rate — not tax advice; consult a CPA.
Schools (NCES district)
- District
- Tuscaloosa County
- NCES district ID
- 0103390
- Math proficiency
- 21% ▼ -24.00%
- Reading proficiency
- 45% ▲ 2.00%
- Median HH income
- $53,000
- Composite
- 28.88/100
- National rank
- #6641
- State rank
- #47 of 129 in AL
Livability — Vance
- Score
- 65/100
- State rank
- #117
- US rank
- #12508
Category grades
Schools grade is shown separately in the Schools card above.
Census & demographics
- Census place
- Vance, AL
- County
- Tuscaloosa County · 206,491 people
- City population
- 4,457
- Metro
- Tuscaloosa, AL
- Population (ZIP)
- 4,457
- Household income
- $87,813
- Rent vs Own
- Severe rent burden
- 5.0
Population outlook (Tuscaloosa County) Hauer SSP2
- Today (2025)
- 228,293 people
- By 2030
- 240,551 · +5.4%
- By 2040
- 263,856 · +15.6%
- By 2050
- 286,491 · +25.5%
- By 2075
- 335,783 · +47.1%
- By 2100
- 370,520 · +62.3%
Race, ethnicity, and origin ACS 2023
- Neighborhood character
- Predominantly White (85%)
- Race & ethnicity
- White 85% Hispanic / Latino 10% Black 4% Two or more races 1%
- Hispanic origin (detail)
- Mexican 9%
- Common ancestry
- French 1%
- Foreign-born
- 1% · Canada
- Languages at home
- 91% English-only · Russian/Polish/Slavic 7% Spanish 2%
Political lean MEDSL · Tuscaloosa
- 2024 margin
- Strong R (+20.4) · D 39.4% · R 59.8%
- 2008→2024 swing
- -4.4pp toward R · 2008: -16.0pp · 2024: -20.4pp
- All cycles
- 2024: R+20.4 2020: R+14.8 2016: R+19.5 2012: R+17.4 2008: R+16.0
Not yet ingested
- Civics
- —
Market trends
- HPI YoY
- ▲ 12.30%
- Current HPI
- 222.8671
- Rent YoY
- —
- Metro
- Tuscaloosa, AL
- State GDP YoY
- ▲ 2.94%
- F500 in state
- 4
Industry mix (Fortune 500 HQ in AL)
| Industry | F500 HQs | Revenue |
|---|---|---|
| Financial Services | 1 | $8B |
|
||
| Healthcare | 1 | $5B |
|
||
Price history
+68.1% since first listed4 events — show timeline
- 2026-06-11 Listed $199,000 Greater Alabama MLS
- 2023-11-21 Listed $159,900 WAMLS
- 2012-06-05 Sold (Public Records) $112,800 Public Records
- 2008-12-17 Sold (Public Records) $118,350 Public Records
Property tax history
+5.8%/yrLatest (2025): $469 · +7.6% YoY. Source: county tax records.
Cash-flow waterfall
monthlySold comps — $/sqft
last 12 mo · ≤1 miLoading sold comps…