 🏷️ Likely Rental
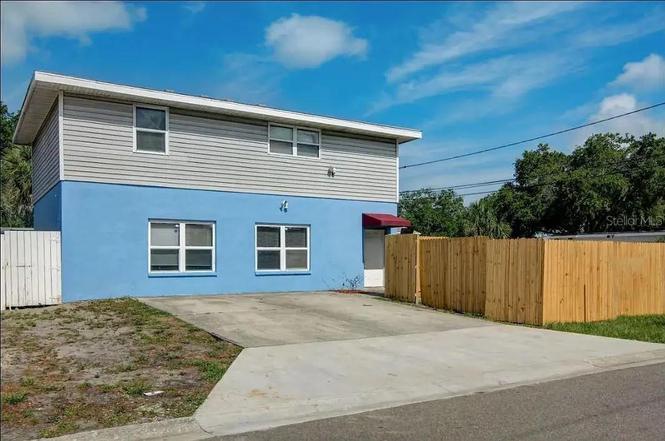
1002 Vine Ave · Clearwater, FL
Flood risk 1/10 · Minimal
- FEMA flood zone
- X (unshaded)
- Chance of flooding over 30 yrs
- 0.0%
- Est. flood insurance / yr
- $473 – $860
Fire risk 1/10 · Minimal
- Est. fire insurance / yr
- $947 – $1,759
Heat risk 10/10 · Severe
- Hot days now (above 107°F)
- 7 days/yr
- Hot days in 30 yrs
- 26 days/yr
Wind risk 10/10 · Severe
- Chance of severe wind over 30 yrs
- 99.0%
Air-quality risk 3/10 · Minor
- Unhealthy air days now
- 2 days/yr
- Unhealthy air days in 30 yrs
- 3 days/yr
Risk factors via First Street. Map © Google.
Why this score? — see what drove the D+ grade
The composite is a weighted blend of 9 inputs, each scored 0–100. Each bar is that input's sub-score; the figure is the points it added to the 100-point composite (weight × sub-score).
- ARV discount +15.0/15.0
- Cash flow +12.4/30.0
- Schools +4.3/10.0
- Livability +4.1/5.0
- DSCR +3.7/10.0
- 1% rule +3.5/10.0
- Condition / age +2.5/5.0
- Rent growth +2.0/5.0
- Appreciation +0.0/10.0
$340,000
🖨 Deal sheet 📄 Offer letter ✓ Due diligence
Listing remarks MLS
An excellent investment opportunity just north of downtown Clearwater. This home, built in 1989 is a very spacious 1,680 square feet. Downstairs you will find a large living area, bathroom, and inside laundry room, and an attached bedroom with a very large closet. Upstairs is the kitchen, another living room, and two bedrooms and bath. The configuration opportunities here are endless! This home is also just one block from the Pinellas Trail, providing easy access to both downtown Clearwater as well as points further north in Dunedin. Be sure to take advantage of this outstanding opportunity today, as it won't be along wrong! Tenant occupied, please do not disturb.
Key facts
- Quartz countertops
- Newer appliances
- No hoa restrictions
Tags
Property features AI
Finance
- Other: Furnished; Universal property identifier available
- HOA & community: No association approval required; Pets allowed
Exterior
- Utilities: Public water; Public sewer; Electricity connected; Natural gas connected; Sewer connected; Water connected
- Home design: Single family residence; Residential property; Two levels; Faces south
- Construction: Cement siding; Vinyl siding; Shingle roof; Slab foundation; Built on lot of about 0.1 acre
- Exterior features: Private mailbox; Rain gutters; Asphalt road access; Street lights (community)
Interior
- Kitchen: Dishwasher; Microwave; Range; Refrigerator; Freezer; Exhaust fan; Gas water heater
- Bedrooms: 3 bedrooms
- Flooring: Tile
- Bathrooms: 2 full bathrooms
- Heating & cooling: Natural gas heating; Central air conditioning
- Interior features: Open floorplan; Thermostat; Walk-in closet(s)
- Laundry & utility: Washer; Dryer; Electric dryer hookup; Laundry closet
Neighborhood map
What this means for you Summary
Snapshot
- This is a 3-bed/2.0-bath single-family listed at $340k.
Deal economics
- At list price, monthly cash flow is $-59 ($-707/yr) — negative.
- To cash-flow at today's rent, offer at most $330k (3.1% below list).
- To meet the 1% rule (rent ≥ 1% of price), the offer needs to be $289k (15.0% below list).
- Recommended offer: $289k (15.0% below list) — sets the bar for 1% rule.
- Cap rate 6.1% vs local median 2.9% in Clearwater — top-decile yield for the area; either an underpriced asset or a hidden risk that comps aren't pricing in. Stress-test before assuming the spread holds.
Location & tenants
- Location reads 82/100 on livability (#60 in FL, #988 nationally) — a professional / high-income tenant draw. Strengths: commute A+, housing A+, health & safety A+; Watch: schools C-, employment C-.
- Pinellas (suburban): math 51% / reading 51% proficiency, ranked #31 of 73 in FL (top 42%) — acceptable for families but not a draw, mixed tenant base, ~2y average lease.
- Market conditions: Rents soft (-2.2%/yr); 261 active listings in the ZIP; 40 comparable units currently listed for rent nearby; rentals at typical pace (median 18d on market — plan ~3-4 weeks tenant-placement turnaround); 2,676 units permitted in Pinellas County in 2024 (1,422 in 5+ unit buildings).
- At $2,891/mo this rent would consume 55% of the median local household income ($63k/yr) (locally 1511% of renters already pay >50% of income on rent) — very limited rent-growth headroom before tenants either downsize or default.
Forward outlook
- Local home prices are declining (-3.0%/yr); year-one equity from $2k of loan paydown is wiped out by about $10k of value loss. Plan a longer hold.
- Pinellas County population projected at +14% by 2050 — modest demand growth; plan on rents tracking national, not racing it.
Negotiation context
- It's been on market 174 days — a 12% lower offer ($299k) is reasonable based on typical stale-listing flexibility.
- 9 sale attempts since 22y ago with the ask held roughly flat each time — persistent listings suggest the price (not the market) is what's stuck; bring a comps-based counter.
- Current owner paid $280k; 21% above their basis — modest negotiation headroom, anchor on the comps not their cost.
Risks & watch-outs
- Climate carrying-cost: severe wind risk, 99% chance of damaging wind over 30y; extreme-heat days projected 7→26/yr by 2055 (HVAC capex compounding) — expect insurance premiums to compound above CPI over the hold.
Questions for the listing agent
- What do current leases actually rent for vs. the listed asking? Can we see a recent rent roll and the last 12 months of T-12 income?
- It's been on market 174 days. Have you received any prior offers? Is the seller open to a 15% concession, seller financing, or rate buy-down credit?
- Why hasn't it sold? Are there any deal-killer items the seller is aware of (foundation, flood, title, zoning, code violations)?
- Is there a deadline driving the sale (1031 exchange, divorce, estate, relocation)? That informs how much negotiation room exists.
- The area grade is low — what's the realistic commute time and amenity access for the typical tenant pool here? Any planned neighborhood developments (good or bad) we should know about?
- What's the average days-on-market for RENTAL listings here right now (not sales)? A rising rental-DOM trend means longer vacancies and softer asking-rent achievability than the comps imply.
- What's the recent tenant-quality profile in this submarket — average credit score on applications, eviction rate, late-payment / NSF rate, and stable-employment percentage? A property-management company in the area should have these aggregated.
- How much new for-sale + rental construction is in the pipeline within 1–3 miles? Heavy new supply typically softens prices + rents 12–24 months out; constrained supply supports both.
Investment metrics
- 1% rule
- 0.85% ✗
- Cap rate
- 6.09%
- Cash-on-cash
- -0.74%
- DSCR
- 0.97
- GRM
- 9.8
CMA / ARV
- ARV (on-the-fly)
- $500,640
- Comps found
- 12
Show comp detail 12 sales within ~0.75 mi
| Address | Dist | Beds/Ba | Sqft | Sold | Price | $/sf | Match |
|---|---|---|---|---|---|---|---|
| 707 N Jefferson Ave | 0.54mi | 4/2.0 (+1) | 1,701 (+1%) | 2mo | $326,000 | $192 | 66 |
| 907 Jones St | 0.48mi | 3/2.0 | 1,616 (-4%) | 14mo | $418,500 | $259 | 60 |
| 1742 Sunset Dr | 0.65mi | 3/1.0 | 1,610 (-4%) | 3mo | $800,000 | $497 | 56 |
| 308 N Missouri Ave | 0.59mi | 3/2.0 | 1,830 (+9%) | 2mo | $565,000 | $309 | 56 |
| 1164 Engman St | 0.48mi | 3/2.0 | 1,580 (-6%) | 14mo | $335,000 | $212 | 56 |
| 905 Plaza St | 0.35mi | 4/3.0 (+1) | 1,484 (-12%) | 2mo | $443,000 | $299 | 54 |
| 320 N Madison Ave | 0.52mi | 3/2.0 | 1,509 (-10%) | 6mo | $450,000 | $298 | 53 |
| 1270 Nicholson St | 0.63mi | 3/2.0 | 1,744 (+4%) | 15mo | $322,000 | $185 | 52 |
| 1601 Stevensons Dr | 0.73mi | 4/2.0 (+1) | 1,517 (-10%) | 1mo | $365,000 | $241 | 44 |
| 317 N Washington Ave | 0.50mi | 3/2.0 | 1,444 (-14%) | 12mo | $500,000 | $346 | 43 |
| 1755 Fulton Ave | 0.62mi | 4/2.0 (+1) | 1,904 (+13%) | 3mo | $215,400 | $113 | 42 |
| 312 Lebeau St | 0.72mi | 3/2.0 | 1,538 (-8%) | 24mo | $540,000 | $351 | 32 |
Match score weights: distance 35% · size 25% · config 20% · recency 20%. Top-matched comps best support the ARV.
Projected returns pro-forma
-3.0% appreciation · 0.0% rent growth · sell at horizon
- IRR
- -20.9%
- Equity multiple
- 0.29×
- Total profit
- $-67,278
- Equity at exit
- $50,695
- IRR
- -23.2%
- Equity multiple
- -0.01×
- Total profit
- $-95,995
- Equity at exit
- $29,397
Cash invested: $95,200 (down + closing). Projections, not guarantees.
Landlord ↔ Tenant lean methodology
- Overall (STATE)
- 87 Strongly Landlord-Friendly
- State Florida
- 87 Strongly Landlord-Friendly · R+3
- County
- — inherits STATE
- City
- — inherits STATE
ZIP-level market 33755
- Rents YoY
- -2.2%
- Active inventory
- 261
- Price-to-rent
- 9.8×
Monthly cashflow live
- Estimated rent
- $2,891 high interval (Pro) →
- Mortgage (P&I)
- −$1,783
- Tax from tax record
- −$418 /mo · $5,015/yr
- Insurance
- −$142
- HOA
- −$0
- Vacancy / Maint / Mgmt
- −$607
- Net cashflow
- $-59
Break-even live
UW: 25.0% down · 7.5% · 30yr · 1.5% tax · 5.0% vac · 8.0% maint · 8.0% mgmt
Financing live
Cash to close
- Down payment
- $85,000
- Closing costs
- $10,200
- Reserves months
- —
- Total cash needed
- —
Loan-product check · same deal, 3 products live
Conventional
25% down · 7.5% · 30yr
- Down + closing
- —
- Monthly P&I
- —
- Monthly cashflow
- —
- DSCR
- —
- Eligible?
- —
Personal DTI + credit; lowest rate.
DSCR
20% down · 8.5% · 30yr
- Down + closing
- —
- Monthly P&I
- —
- Monthly cashflow
- —
- DSCR
- —
- Eligible?
- —
No personal income docs; deal must DSCR.
Hard money
10% down · 12.0% · 12mo
- Down + closing
- —
- Monthly P&I
- —
- Monthly cashflow
- —
- DSCR
- —
- Eligible?
- —
Short-term bridge; refi at stabilization.
Rent comps 40 comps
| Address | Beds | Baths | Sqft | Rent | $/sqft | DOM | Units | Dist |
|---|---|---|---|---|---|---|---|---|
| 506 Engman St Clearwater, FL | 2.0 | 2.0 | 1060 | $2,500 | $2.36 | 24d | 1 | 0.24mi |
| 900 N Osceola Ave #603 Clearwater, FL | 3.0 | 2.0 | 1902 | $5,500 | $2.89 | 4d | 1 | 0.32mi |
| 1144 La Salle St Clearwater, FL | 3.0 | 2.0 | 1317 | $2,200 | $1.67 | 24d | 1 | 0.39mi |
| 1149 La Salle St Clearwater, FL | 3.0 | 3.0 | 1666 | $2,495 | $1.50 | 24d | 1 | 0.39mi |
| 906 Hart St Clearwater, FL | 3.0 | 2.0 | 1360 | $2,336 | $1.72 | 14d | 1 | 0.39mi |
| 311 Pennsylvania Ave Clearwater, FL | 3.0 | 2.0 | 1220 | $2,300 | $1.89 | 24d | 1 | 0.44mi |
| 1614 N Osceola Ave Clearwater, FL | 4.0 | 2.0 | 1556 | $2,600 | $1.67 | 4d | 1 | 0.46mi |
| 1614 N Washington Ave Clearwater, FL | 3.0 | 2.0 | 1372 | $2,550 | $1.86 | 24d | 1 | 0.47mi |
| 905 Jones St Clearwater, FL | 3.0 | 2.0 | 1072 | $2,450 | $2.29 | 24d | 1 | 0.49mi |
| 500 N Osceola Ave #502 Clearwater, FL | 2.0 | 2.0 | 1060 | $2,450 | $2.31 | 7d | 1 | 0.50mi |
| 500 N Osceola Ave Clearwater, FL | 2.0 | 2.0 | 1075 | $2,275 | $2.12 | 18d | 2 | 0.52mi |
| 1004 Osage St Clearwater, FL | 3.0 | 2.0 | 1282 | $2,450 | $1.91 | 15d | 1 | 0.62mi |
| 1021 Iroquois St Clearwater, FL | 2.0 | 2.0 | 1195 | $2,625 | $2.20 | 2d | 1 | 0.64mi |
| 1793 N Fort Harrison Ave Clearwater, FL | 4.0 | 3.5 | 2050 | $3,350 | $1.63 | 19d | 1 | 0.70mi |
| 1512 Stevensons Dr Clearwater, FL | 4.0 | 1.0 | 1127 | $3,250 | $2.88 | 4d | 1 | 0.70mi |
| 418 Lebeau St Clearwater, FL | 3.0 | 2.0 | 1400 | $2,800 | $2.00 | 24d | 1 | 0.71mi |
| 628 Cleveland St #1002 Clearwater, FL | 2.0 | 2.0 | 1476 | $3,750 | $2.54 | 7d | 1 | 0.71mi |
| 628 Cleveland St Clearwater, FL | 1.0–2.0 | 2.0 | 1328 | $3,750 | $2.82 | 7d | 2 | 0.71mi |
| 628 Cleveland St Clearwater, FL | 2.0–3.0 | 2.0 | 1666 | $3,750 | $2.25 | 24d | 2 | 0.71mi |
| 824 Padua Ln Clearwater, FL | 2.0 | 2.5 | 1231 | $2,175 | $1.77 | 24d | 1 | 0.72mi |
| 828 Padua Ln Clearwater, FL | 2.0 | 2.5 | 1231 | $2,495 | $2.03 | 24d | 1 | 0.73mi |
| 949 Cleveland St Clearwater, FL | 1.0–2.0 | 1.0–2.0 | 820 | $2,595 | $3.16 | 2d | 50 | 0.74mi |
| 1100 Cleveland St Clearwater, FL | 1.0–2.0 | 1.0–2.5 | 1168 | $2,795 | $2.39 | 3d | 15 | 0.74mi |
| 5 N Osceola Ave #508 Clearwater, FL | 2.0 | 2.0 | 1187 | $4,500 | $3.79 | 24d | 1 | 0.75mi |
| 1011 Pinebrook Dr Clearwater, FL | 3.0 | 3.0 | 2000 | $4,000 | $2.00 | 4d | 1 | 0.81mi |
| 1257 Drew St #1 Clearwater, FL | 2.0 | 1.0 | 1055 | $1,750 | $1.66 | 24d | 1 | 0.84mi |
| 331 Cleveland St Clearwater, FL | 2.0–3.0 | 2.0–2.5 | 1962 | $7,500 | $3.82 | 24d | 3 | 0.85mi |
| 113 Kenwood Ave Clearwater, FL | 4.0 | 2.5 | 2217 | $3,000 | $1.35 | 4d | 1 | 0.87mi |
| 1822 Pineland Dr Clearwater, FL | 4.0 | 2.0 | 1652 | $2,900 | $1.76 | 4d | 1 | 0.94mi |
| 1279 Park St Unit n/a Clearwater, FL | 3.0 | 2.5 | 1300 | $2,450 | $1.88 | 24d | 1 | 1.02mi |
| 100 Pierce St Clearwater, FL | 1.0–2.0 | 2.0 | 1479 | $3,100 | $2.10 | 4d | 2 | 1.02mi |
| 1264 Pierce St Clearwater, FL | 3.0 | 2.5 | 1436 | $2,500 | $1.74 | 22d | 1 | 1.02mi |
| 1020 Sunset Point Rd Clearwater, FL | 3.0 | 3.0–3.5 | 2674 | $16,500 | $6.17 | 7d | 2 | 1.03mi |
| 1276 Pierce St Unit 1276 Clearwater, FL | 3.0 | 2.5 | 1450 | $2,550 | $1.76 | 4d | 1 | 1.04mi |
| 1219 Aloha Ln Clearwater, FL | 2.0 | 2.0 | 1154 | $2,300 | $1.99 | 24d | 1 | 1.18mi |
| 642 Wells Ct #302 Clearwater, FL | 3.0 | 2.0 | 1588 | $2,795 | $1.76 | 11d | 1 | 1.21mi |
| 1103 Charles St Clearwater, FL | 3.0 | 2.0 | 1348 | $3,295 | $2.44 | 15d | 1 | 1.22mi |
| 39 Turner St Clearwater, FL | 2.0 | 1.0 | 1399 | $1,600 | $1.14 | 4d | 1 | 1.26mi |
| 16 N San Remo Ave Clearwater, FL | 3.0 | 1.0 | 1249 | $1,795 | $1.44 | 24d | 1 | 1.26mi |
| 105 Island Way Clearwater, FL | 2.0 | 2.0 | 1090 | $3,400 | $3.12 | 24d | 3 | 1.27mi |
Listing history 38 events
-
2026-06-18days on market $340,000 Active 174 DOM
-
2026-06-17days on market $340,000 Active 173 DOM
-
2026-06-16days on market $340,000 Active 172 DOM
-
2026-06-15days on market $340,000 Active 171 DOM
-
2026-06-13days on market $340,000 Active 169 DOM
-
2026-06-09days on market $340,000 Active 165 DOM
-
2026-06-08days on market $340,000 Active 164 DOM
-
2026-06-07days on market $340,000 Active 163 DOM
-
2026-06-04days on market $340,000 Active 160 DOM
-
2026-06-03days on market $340,000 Active 159 DOM
-
2026-06-01days on market $340,000 Active 157 DOM
-
2026-05-31days on market $340,000 Active 156 DOM
-
2026-01-08price $340,000
-
2025-12-26$345,000 Active
-
2023-07-21historical
-
2023-07-05price $380,000
-
2023-05-18$398,000 Active
-
2022-06-22soldstatus $280,000
-
2022-05-02soldstatus $280,000 Closed 674-char remark
Show marketing remark (674 chars)
An excellent investment opportunity just north of downtown Clearwater. This home, built in 1989 is a very spacious 1,680 square feet. Downstairs you will find a large living area, bathroom, and inside laundry room, and an attached bedroom with a very large closet. Upstairs is the kitchen, another living room, and two bedrooms and bath. The configuration opportunities here are endless! This home is also just one block from the Pinellas Trail, providing easy access to both downtown Clearwater as well as points further north in Dunedin. Be sure to take advantage of this outstanding opportunity today, as it won't be along wrong! Tenant occupied, please do not disturb.
-
2022-02-26status Pending 674-char remark
Show marketing remark (674 chars)
An excellent investment opportunity just north of downtown Clearwater. This home, built in 1989 is a very spacious 1,680 square feet. Downstairs you will find a large living area, bathroom, and inside laundry room, and an attached bedroom with a very large closet. Upstairs is the kitchen, another living room, and two bedrooms and bath. The configuration opportunities here are endless! This home is also just one block from the Pinellas Trail, providing easy access to both downtown Clearwater as well as points further north in Dunedin. Be sure to take advantage of this outstanding opportunity today, as it won't be along wrong! Tenant occupied, please do not disturb.
-
2021-11-04price $290,000 674-char remark
Show marketing remark (674 chars)
An excellent investment opportunity just north of downtown Clearwater. This home, built in 1989 is a very spacious 1,680 square feet. Downstairs you will find a large living area, bathroom, and inside laundry room, and an attached bedroom with a very large closet. Upstairs is the kitchen, another living room, and two bedrooms and bath. The configuration opportunities here are endless! This home is also just one block from the Pinellas Trail, providing easy access to both downtown Clearwater as well as points further north in Dunedin. Be sure to take advantage of this outstanding opportunity today, as it won't be along wrong! Tenant occupied, please do not disturb.
-
2021-09-10$300,000 Active 674-char remark
Show marketing remark (674 chars)
An excellent investment opportunity just north of downtown Clearwater. This home, built in 1989 is a very spacious 1,680 square feet. Downstairs you will find a large living area, bathroom, and inside laundry room, and an attached bedroom with a very large closet. Upstairs is the kitchen, another living room, and two bedrooms and bath. The configuration opportunities here are endless! This home is also just one block from the Pinellas Trail, providing easy access to both downtown Clearwater as well as points further north in Dunedin. Be sure to take advantage of this outstanding opportunity today, as it won't be along wrong! Tenant occupied, please do not disturb.
-
2015-06-14historical
-
2015-05-08status Active
-
2015-05-07historical
-
2015-01-29price $85,000
-
2015-01-29status Active
-
2014-10-10price $95,100
-
2014-06-14$45,000
-
2006-09-12soldstatus $120,000
-
2006-08-30soldstatus $120,000
-
2006-07-05$159,900
-
2006-04-27historical
-
2006-03-16$169,900
-
2004-10-06historical
-
2004-05-10$110,000
-
2001-09-13soldstatus $54,100
-
1997-02-01soldstatus $38,000
ⓘ Source: listings_history table (triggers on properties + properties_extension) + one-shot
backfill from property_details.listing_events for pre-trigger history.
Tax reassessment forecast FL · Resets to sale price
- Current annual tax
- $5,015 · $418/mo
- Projected year-2 tax
- $5,015 · $418/mo
- Expected delta
- $0/yr ($0/mo · 0.0%)
ⓘ Screening estimate from a state-policy table — verify with the county assessor before closing.
Climate risk First Street
- Flood 1/10 Low FEMA zone X (unshaded) · 0% chance over 30 yrs
- Wildfire 1/10 Low
- Heat 10/10 Extreme 7 d/yr ≥107°F today · 26 d/yr by 30 yrs out
- Wind 10/10 Extreme 99% chance of damaging wind over 30 yrs
- Air quality 3/10 Moderate 2 unhealthy d/yr today · 3 by 30 yrs out
Nearby sold comps map
Loading sold comps map…
Walkable amenities ~0.75 mi
Loading nearby amenities…
Taxation est. · year 1
- Rental income
- $34,689
- − Mortgage interest
- −$19,045
- − Property taxes
- −$5,015
- − Insurance
- −$1,700
- − Repairs & maintenance
- −$2,775
- − Management
- −$2,775
- − Depreciation
- −$9,891
- Taxable loss
- −$6,513
- Est. tax savings @ 24.0%
- +$1,563
- After-tax cash flow
- $856/yr
For passive investors: Depreciation is non-cash, so a rental often shows a tax loss while cash-flowing — sheltering income. Rental losses are passive: they offset passive income freely, and up to $25,000/yr can offset ordinary (W-2) income if you actively participate and your MAGI is under $100k (phasing out to $0 by $150k); unused losses carry forward. On sale, claimed depreciation is recaptured at up to 25%, and gains may owe capital-gains tax (a 1031 exchange can defer both). Figures are a year-1 estimate at your 24.0% rate — not tax advice; consult a CPA.
Schools (NCES district)
- District
- Pinellas
- NCES district ID
- 1201560
- Math proficiency
- 51% ▼ -5.00%
- Reading proficiency
- 51% ▼ -3.00%
- Median HH income
- $46,270
- Composite
- 43.27/100
- National rank
- #3046
- State rank
- #31 of 73 in FL
Livability — Clearwater
- Score
- 82/100
- State rank
- #60
- US rank
- #988
Category grades
Schools grade is shown separately in the Schools card above.
Census & demographics
- Census place
- Clearwater, FL
- County
- Pinellas County · 939,478 people
- City population
- 170,933
- Metro
- Tampa-St. Petersburg-Clearwater, FL
- Population (ZIP)
- 27,476
- Household income
- $62,886
- Rent vs Own
- Severe rent burden
- 1511.0
Population outlook (Pinellas County) Hauer SSP2
- Today (2025)
- 1,027,532 people
- By 2030
- 1,063,586 · +3.5%
- By 2040
- 1,125,020 · +9.5%
- By 2050
- 1,168,637 · +13.7%
- By 2075
- 1,265,188 · +23.1%
- By 2100
- 1,260,357 · +22.7%
Race, ethnicity, and origin ACS 2023
- Neighborhood character
- Diverse neighborhood (Simpson 0.63)
- Race & ethnicity
- White 54% Black 22% Hispanic / Latino 17% Two or more races 10% Asian 3%
- Hispanic origin (detail)
- Mexican 6% Puerto Rican 5% Cuban 1%
- Common ancestry
- Romanian 2% Italian 2% Arab 1%
- Foreign-born
- 15% · Canada
- Languages at home
- 78% English-only · Spanish 13% Other Indo-European 3% Russian/Polish/Slavic 2%
Political lean MEDSL · Pinellas
- 2024 margin
- Lean R (+5.2) · D 46.9% · R 52.1%
- 2008→2024 swing
- -13.5pp toward R · 2008: 8.3pp · 2024: -5.2pp
- All cycles
- 2024: R+5.2 2020: D+0.2 2016: R+1.1 2012: D+5.6 2008: D+8.3
Not yet ingested
- Civics
- —
Market trends
- HPI YoY
- ▼ -472.62%
- Current HPI
- 351.4973
- Rent YoY
- ▼ -2.20%
- Metro
- Tampa-St. Petersburg-Clearwater, FL
- State GDP YoY
- ▲ 3.28%
- F500 in state
- 36
Industry mix (Fortune 500 HQ in FL)
| Industry | F500 HQs | Revenue |
|---|---|---|
| Industrial Technology | 2 | $29B |
|
||
| Insurance | 2 | $17B |
|
||
| Retail | 1 | $60B |
|
||
| Technology Distribution | 1 | $58B |
|
||
| Homebuilding | 1 | $35B |
|
||
| Technology Manufacturing | 1 | $35B |
|
||
Price history
+794.7% since first listed26 events — show timeline
- 2026-01-08 Price Changed $340,000 Stellar MLS as Distributed by MLS Grid
- 2025-12-26 Listed $345,000 Stellar MLS as Distributed by MLS Grid
- 2023-07-21 Listing Removed — Stellar MLS as Distributed by MLS Grid
- 2023-07-05 Price Changed $380,000 Stellar MLS as Distributed by MLS Grid
- 2023-05-18 Listed $398,000 Stellar MLS as Distributed by MLS Grid
- 2022-06-22 Sold (Public Records) $280,000 Public Records
- 2022-05-02 Sold (MLS) $280,000 Stellar MLS as Distributed by MLS Grid
- 2022-02-26 Pending — Stellar MLS as Distributed by MLS Grid
- 2021-11-04 Price Changed $290,000 Stellar MLS as Distributed by MLS Grid
- 2021-09-10 Listed $300,000 Stellar MLS as Distributed by MLS Grid
- 2015-06-14 Listing Removed — Stellar MLS as Distributed by MLS Grid
- 2015-05-08 Relisted — Stellar MLS as Distributed by MLS Grid
- 2015-05-07 Listing Removed — Stellar MLS as Distributed by MLS Grid
- 2015-01-29 Relisted — Stellar MLS as Distributed by MLS Grid
- 2015-01-29 Price Changed $85,000 Stellar MLS as Distributed by MLS Grid
- 2014-10-10 Price Changed $95,100 Stellar MLS as Distributed by MLS Grid
- 2014-06-14 Listed $45,000 Stellar MLS as Distributed by MLS Grid
- 2006-09-12 Sold (Public Records) $120,000 Public Records
- 2006-08-30 Sold (MLS) $120,000 Stellar MLS as Distributed by MLS Grid
- 2006-07-05 Listed $159,900 Stellar MLS as Distributed by MLS Grid
- 2006-04-27 Listing Removed — Stellar MLS as Distributed by MLS Grid
- 2006-03-16 Listed $169,900 Stellar MLS as Distributed by MLS Grid
- 2004-10-06 Listing Removed — Stellar MLS as Distributed by MLS Grid
- 2004-05-10 Listed $110,000 Stellar MLS as Distributed by MLS Grid
- 2001-09-13 Sold (Public Records) $54,100 Public Records
- 1997-02-01 Sold (Public Records) $38,000 Public Records
Property tax history
+9.9%/yrLatest (2025): $5,015 · +1.9% YoY. Source: county tax records.
Cash-flow waterfall
monthlySold comps — $/sqft
last 12 mo · ≤1 miLoading sold comps…