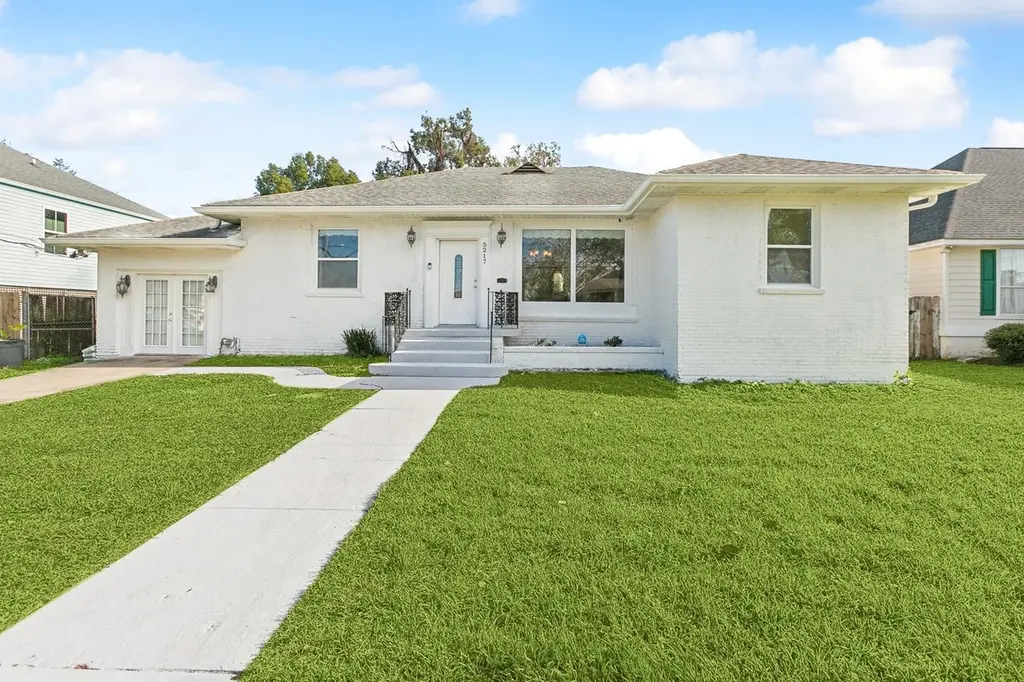
5217 Chamberlain Dr · New Orleans, LA
Flood risk 8/10 · Major
- FEMA flood zone
- AE
- Chance of flooding over 30 yrs
- 0.75%
- Est. flood insurance / yr
- $1,737 – $8,500
Fire risk 1/10 · Minimal
- Est. fire insurance / yr
- $1,269 – $2,357
Heat risk 10/10 · Severe
- Hot days now (above 108°F)
- 7 days/yr
- Hot days in 30 yrs
- 20 days/yr
Wind risk 10/10 · Severe
- Chance of severe wind over 30 yrs
- 99.0%
Air-quality risk 4/10 · Minor
- Unhealthy air days now
- 4 days/yr
- Unhealthy air days in 30 yrs
- 4 days/yr
Risk factors via First Street. Map © Google.
Why this score? — see what drove the C+ grade
The composite is a weighted blend of 9 inputs, each scored 0–100. Each bar is that input's sub-score; the figure is the points it added to the 100-point composite (weight × sub-score).
- Cash flow +28.3/30.0
- DSCR +10.0/10.0
- 1% rule +8.3/10.0
- ARV discount +7.5/15.0
- Livability +4.0/5.0
- Condition / age +2.5/5.0
- Rent growth +2.3/5.0
- Schools +1.6/10.0
- Appreciation +0.0/10.0
$229,900
🖨 Deal sheet 📄 Offer letter ✓ Due diligence
Listing remarks MLS
Welcome home to this spacious 4-bedroom, 2-bath residence nestled in the heart of New Orleans! Offering the perfect blend of comfort, functionality, and Southern charm, this home features a well-designed floor plan with generous living spaces, spacious bedrooms, and plenty of room for entertaining family and friends. The bright and inviting interior provides a warm atmosphere, while the kitchen offers ample cabinet and counter space for everyday living. The primary suite serves as a private retreat, and the additional bedrooms provide flexibility for guests, a home office, or growing families.Conveniently located near local dining, shopping, schools, and all the culture and entertainment New Orleans has to offer.
Key facts
- 8,712 sq ft lot
- 3 parking spots
- Built 1950
Property features AI
Exterior
- Parking: 3 parking spaces
- Utilities: Public water; Public sewer
- Home design: Detached single-family residence; Residential property
- Construction: Brick construction; Slab foundation; Built area approximately 2,642 square feet
- Exterior features: Lot in Mirabeau Gardens subdivision; Lot dimensions approximately 70' x 125'
Interior
- Bathrooms: 2 full bathrooms
- Heating & cooling: Central heating; Central air conditioning
- Interior features: Walk-in closets
Neighborhood map
What this means for you Summary
Snapshot
- This is a 4-bed/2.5-bath single-family listed at $230k.
Deal economics
- At list price, monthly cash flow is $311 ($4k/yr) — positive.
- The deal already cash-flows at list — no discount required.
- Meets the 1% rule at list price ($3k rent vs $230k).
- Cap rate 10.1% vs local median 4.4% in New Orleans — top-decile yield for the area; either an underpriced asset or a hidden risk that comps aren't pricing in. Stress-test before assuming the spread holds.
Location & tenants
- Location reads 81/100 on livability (#3 in LA, #1,383 nationally) — a professional / high-income tenant draw. Strengths: amenities A+, commute A+, health & safety A+; Watch: crime C-, employment D.
- Orleans Parish (urban): math 11% / reading 27% proficiency, ranked #69 of 98 in LA (top 70%) — low school quality limits family demand, transient renter base, plan for 1-2y turnover; 68% free/reduced lunch — lower-income household profile, screen leases tightly.
- Market conditions: Rents soft (-0.6%/yr); 332 active listings in the ZIP; 9 comparable units currently listed for rent nearby; rentals at typical pace (median 16d on market — plan ~3-4 weeks tenant-placement turnaround); 710 units permitted in Orleans Parish in 2024 (244 in 5+ unit buildings).
- At $3,060/mo this rent would consume 74% of the median local household income ($49k/yr) (locally 2150% of renters already pay >50% of income on rent) — very limited rent-growth headroom before tenants either downsize or default.
Forward outlook
- Local home prices are declining (-3.0%/yr); year-one equity from $2k of loan paydown is wiped out by about $7k of value loss. Plan a longer hold.
- Orleans County population projected at +61% by 2050 — long-run rental-demand tailwind backs the buy-and-hold thesis.
Negotiation context
- Only 6 days on market — expect competitive offers; lowballing is unlikely to land.
- 13 sale attempts since 27y ago with the ask held roughly flat each time — persistent listings suggest the price (not the market) is what's stuck; bring a comps-based counter.
Risks & watch-outs
- Watch-outs: flood insurance adds $427/mo; built in 1950 — expect roof / HVAC / electrical / plumbing capex.
- Climate carrying-cost: in FEMA flood zone AE (mandatory federal flood insurance); severe wind risk, 99% chance of damaging wind over 30y; extreme-heat days projected 7→20/yr by 2055 (HVAC capex compounding) — expect insurance premiums to compound above CPI over the hold.
Questions for the listing agent
- Built in 1950 — when were the roof, HVAC, electrical panel, plumbing, and water heater last replaced?
- What's the actual annual flood-insurance premium (NFIP or private), and is the property in a SFHA with mandatory coverage?
- Is there a deadline driving the sale (1031 exchange, divorce, estate, relocation)? That informs how much negotiation room exists.
- What's the average days-on-market for RENTAL listings here right now (not sales)? A rising rental-DOM trend means longer vacancies and softer asking-rent achievability than the comps imply.
- What's the recent tenant-quality profile in this submarket — average credit score on applications, eviction rate, late-payment / NSF rate, and stable-employment percentage? A property-management company in the area should have these aggregated.
- How much new for-sale + rental construction is in the pipeline within 1–3 miles? Heavy new supply typically softens prices + rents 12–24 months out; constrained supply supports both.
Investment metrics
- 1% rule
- 1.33% ✓
- Cap rate
- 10.14%
- Cash-on-cash
- 13.76%
- DSCR
- 1.61
- GRM
- 6.3
CMA / ARV
- ARV (on-the-fly)
- $559,496
- Comps found
- 12
Show comp detail 12 sales within ~0.75 mi
| Address | Dist | Beds/Ba | Sqft | Sold | Price | $/sf | Match |
|---|---|---|---|---|---|---|---|
| 1608 King Dr | 0.29mi | 4/3.0 | 2,651 (-2%) | 2mo | $615,000 | $232 | 79 |
| 1608 Charlton Dr | 0.15mi | 3/2.5 (-1) | 2,865 (+6%) | 1mo | $590,000 | $206 | 78 |
| 1618 Charlton Dr | 0.16mi | 4/3.0 | 2,416 (-11%) | 4mo | $612,000 | $253 | 69 |
| 1482 Granada Dr | 0.29mi | 4/3.0 | 2,445 (-10%) | 0mo | $595,000 | $243 | 68 |
| 5501 Chatham Dr | 0.23mi | 3/2.5 (-1) | 2,407 (-11%) | 3mo | $320,000 | $133 | 63 |
| 4734 Saint Bernard Ave | 0.68mi | 4/3.5 | 2,831 (+4%) | 0mo | $250,000 | $88 | 57 |
| 1244 Gardena Dr | 0.47mi | 5/3.0 (+1) | 2,470 (-9%) | 0mo | $320,000 | $130 | 56 |
| 1537 Prentiss Ave | 0.43mi | 4/3.0 | 2,311 (-15%) | 1mo | $582,000 | $252 | 52 |
| 4531 Annette St | 0.63mi | 4/3.0 | 2,495 (-8%) | 5mo | $300,000 | $120 | 51 |
| 1457 Madrid St | 0.69mi | 4/3.5 | 2,900 (+7%) | 6mo | $690,000 | $238 | 48 |
| 1239 Seville Dr | 0.48mi | 3/2.5 (-1) | 2,416 (-11%) | 8mo | $180,000 | $75 | 48 |
| 4726 Owens Blvd | 0.67mi | 4/2.5 | 3,100 (+14%) | 1mo | $400,000 | $129 | 44 |
Match score weights: distance 35% · size 25% · config 20% · recency 20%. Top-matched comps best support the ARV.
Projected returns pro-forma
-3.0% appreciation · 0.0% rent growth · sell at horizon
- IRR
- -11.6%
- Equity multiple
- 0.60×
- Total profit
- $-26,023
- Equity at exit
- $34,279
- IRR
- -9.2%
- Equity multiple
- 0.53×
- Total profit
- $-30,296
- Equity at exit
- $19,878
Cash invested: $64,372 (down + closing). Projections, not guarantees.
Landlord ↔ Tenant lean methodology
- Overall (STATE)
- 90 Strongly Landlord-Friendly
- State Louisiana
- 90 Strongly Landlord-Friendly · R+12
- County
- — inherits STATE
- City
- — inherits STATE
ZIP-level market 70122
- Rents YoY
- -0.6%
- Active inventory
- 332
- Price-to-rent
- 6.3×
Monthly cashflow live
- Estimated rent
- $3,060 high interval (Pro) →
- Mortgage (P&I)
- −$1,206
- Tax from tax record
- −$378 /mo · $4,533/yr
- Insurance
- −$96
- Flood insurance flood zone
- −$427 /mo · $5,118/yr
- HOA
- −$0
- Vacancy / Maint / Mgmt
- −$643
- Net cashflow
- $311
Break-even live
UW: 25.0% down · 7.5% · 30yr · 1.5% tax · 5.0% vac · 8.0% maint · 8.0% mgmt
Financing live
Cash to close
- Down payment
- $57,475
- Closing costs
- $6,897
- Reserves months
- —
- Total cash needed
- —
Loan-product check · same deal, 3 products live
Conventional
25% down · 7.5% · 30yr
- Down + closing
- —
- Monthly P&I
- —
- Monthly cashflow
- —
- DSCR
- —
- Eligible?
- —
Personal DTI + credit; lowest rate.
DSCR
20% down · 8.5% · 30yr
- Down + closing
- —
- Monthly P&I
- —
- Monthly cashflow
- —
- DSCR
- —
- Eligible?
- —
No personal income docs; deal must DSCR.
Hard money
10% down · 12.0% · 12mo
- Down + closing
- —
- Monthly P&I
- —
- Monthly cashflow
- —
- DSCR
- —
- Eligible?
- —
Short-term bridge; refi at stabilization.
Rent comps 9 comps
| Address | Beds | Baths | Sqft | Rent | $/sqft | DOM | Units | Dist |
|---|---|---|---|---|---|---|---|---|
| 5024 Paris Ave New Orleans, LA | 4.0 | 3.0 | 2116 | $3,000 | $1.42 | 16d | 1 | 0.14mi |
| 5900 Chatham Dr New Orleans, LA | 3.0 | 2.0 | 1864 | $2,500 | $1.34 | 3d | 1 | 0.54mi |
| 5532 Saint Bernard Ave New Orleans, LA | 4.0 | 4.0 | 2907 | $5,000 | $1.72 | 43d | 1 | 0.61mi |
| 4727 Saint Bernard Ave New Orleans, LA | 3.0 | 2.0 | 2000 | $2,000 | $1.00 | 16d | 1 | 0.63mi |
| 6010 Pasteur Blvd New Orleans, LA | 4.0 | 3.0 | 2010 | $2,600 | $1.29 | 17d | 1 | 0.87mi |
| 1310 Allen Toussaint Blvd New Orleans, LA | 5.0 | 3.0 | 2858 | $3,150 | $1.10 | 16d | 1 | 0.88mi |
| 9 Park Island Dr New Orleans, LA | 3.0 | 3.0 | 3353 | $8,500 | $2.54 | 16d | 1 | 0.94mi |
| 5172 Venus St Unit 5172 New Orleans, LA | 3.0 | 2.5 | 1864 | $2,450 | $1.31 | 23d | 1 | 1.25mi |
| 3570 Gentilly Blvd New Orleans, LA | 3.0 | 2.0 | 2390 | $2,900 | $1.21 | 43d | 1 | 1.30mi |
Listing history 4 events
-
2026-06-08statusdays on market $229,900 Pending 6 DOM
-
2026-06-07days on market $229,900 Active 5 DOM
-
2026-06-05remarks 699-char remark
-
2026-06-05$229,900 Active 2 DOM
ⓘ Source: listings_history table (triggers on properties + properties_extension) + one-shot
backfill from property_details.listing_events for pre-trigger history.
Tax reassessment forecast LA · Resets to sale price
- Current annual tax
- $4,533 · $378/mo
- Projected year-2 tax
- $4,533 · $378/mo
- Expected delta
- $0/yr ($0/mo · 0.0%)
ⓘ Screening estimate from a state-policy table — verify with the county assessor before closing.
Climate risk First Street
- Flood 8/10 Severe FEMA zone AE · 75% chance over 30 yrs
- Wildfire 1/10 Low
- Heat 10/10 Extreme 7 d/yr ≥108°F today · 20 d/yr by 30 yrs out
- Wind 10/10 Extreme 99% chance of damaging wind over 30 yrs
- Air quality 4/10 Moderate 4 unhealthy d/yr today · 4 by 30 yrs out
Nearby sold comps map
Loading sold comps map…
Walkable amenities ~0.75 mi
Loading nearby amenities…
Taxation est. · year 1
- Rental income
- $36,715
- − Mortgage interest
- −$12,878
- − Property taxes
- −$4,533
- − Insurance
- −$6,268
- − Repairs & maintenance
- −$2,937
- − Management
- −$2,937
- − Depreciation
- −$6,688
- Taxable income
- $474
- Est. tax owed @ 24.0%
- −$114
- After-tax cash flow
- $3,623/yr
For passive investors: Depreciation is non-cash, so a rental often shows a tax loss while cash-flowing — sheltering income. Rental losses are passive: they offset passive income freely, and up to $25,000/yr can offset ordinary (W-2) income if you actively participate and your MAGI is under $100k (phasing out to $0 by $150k); unused losses carry forward. On sale, claimed depreciation is recaptured at up to 25%, and gains may owe capital-gains tax (a 1031 exchange can defer both). Figures are a year-1 estimate at your 24.0% rate — not tax advice; consult a CPA.
Schools (NCES district)
- District
- Orleans Parish
- NCES district ID
- 2201170
- Math proficiency
- 11% ▼ -52.00%
- Reading proficiency
- 27% ▼ -46.00%
- Median HH income
- $37,011
- Composite
- 15.78/100
- National rank
- #9271
- State rank
- #69 of 98 in LA
Livability — New Orleans
- Score
- 81/100
- State rank
- #3
- US rank
- #1383
Category grades
Schools grade is shown separately in the Schools card above.
Census & demographics
- Census place
- New Orleans, LA
- County
- Orleans Parish · 338,817 people
- City population
- 338,817
- Metro
- New Orleans-Metairie, LA
- Population (ZIP)
- 35,253
- Household income
- $49,455
- Rent vs Own
- Severe rent burden
- 2150.0
Population outlook (Orleans County) Hauer SSP2
- Today (2025)
- 513,025 people
- By 2030
- 575,781 · +12.2%
- By 2040
- 700,174 · +36.5%
- By 2050
- 826,541 · +61.1%
- By 2075
- 1,123,374 · +119.0%
- By 2100
- 1,355,609 · +164.2%
Race, ethnicity, and origin ACS 2023
- Neighborhood character
- Predominantly Black (69%)
- Race & ethnicity
- Black 69% White 18% Two or more races 7% Hispanic / Latino 6% Asian 1%
- Hispanic origin (detail)
- Mexican 1%
- Common ancestry
- Lithuanian 4% Italian 2% Slovak 1%
- Foreign-born
- 4% · Canada, China
- Languages at home
- 92% English-only · Spanish 5% Chinese 1% French/Haitian/Cajun 1%
Political lean MEDSL · Orleans
- 2024 margin
- Solid D (+67.0) · D 82.2% · R 15.2% · Other 2.7%
- 2008→2024 swing
- +6.7pp toward D · 2008: 60.3pp · 2024: 67.0pp
- All cycles
- 2024: D+67.0 2020: D+68.2 2016: D+66.2 2012: D+62.5 2008: D+60.3
Not yet ingested
- Civics
- —
Market trends
- HPI YoY
- ▼ -222.37%
- Current HPI
- 231.9921
- Rent YoY
- ▼ -0.61%
- Metro
- New Orleans-Metairie, LA
- State GDP YoY
- ▲ 3.29%
- F500 in state
- 10
Industry mix (Fortune 500 HQ in LA)
| Industry | F500 HQs | Revenue |
|---|---|---|
| Telecommunications | 2 | $23B |
|
||
| Utilities | 1 | $12B |
|
||
| Wholesale / Distribution | 1 | $5B |
|
||
| Advertising | 1 | $2B |
|
||
Price history
+819.6% since first listed30 events — show timeline
- 2026-06-03 Relisted — AcadianaMLS
- 2026-06-03 Relisted — GBRMLS
- 2026-06-02 Listed $229,900 GBRMLS
- 2026-06-02 Listed $229,900 AcadianaMLS
- 2026-01-30 Price Changed $239,000 AcadianaMLS
- 2026-01-29 Price Changed $239,000 GSREIN
- 2025-11-29 Price Changed $249,000 AcadianaMLS
- 2025-11-10 Price Changed $249,000 GSREIN
- 2025-08-14 Listed $289,900 AcadianaMLS
- 2025-06-26 Price Changed $294,999 AcadianaMLS
- 2025-06-26 Price Changed $294,999 GSREIN
- 2025-04-28 Price Changed $314,999 AcadianaMLS
- 2025-04-28 Price Changed $314,999 GSREIN
- 2025-03-18 Price Changed $325,000 AcadianaMLS
- 2025-03-18 Price Changed $325,000 GSREIN
- 2025-01-16 Listed $350,000 AcadianaMLS
- 2023-09-07 Price Changed $375,000 GSREIN
- 2023-07-24 Listed $375,000 AcadianaMLS
- 2008-05-27 Sold (Public Records) $212,000 Public Records
- 2008-05-23 Sold (MLS) — GSREIN
- 2007-09-12 Listed $260,000 AcadianaMLS
- 2007-09-12 Listed $260,000 GSREIN
- 2000-04-07 Sold (Public Records) $189,000 Public Records
- 2000-04-07 Sold (MLS) — GSREIN
- 2000-02-29 Listed — AcadianaMLS
- 2000-02-29 Listed — GSREIN
- 1999-12-30 Sold (MLS) — GSREIN
- 1999-11-24 Listed — AcadianaMLS
- 1999-11-24 Listed — GSREIN
- 1951-01-01 Sold (Public Records) $25,000 Public Records
Property tax history
+2.0%/yrLatest (2026): $4,533 · +1.1% YoY. Source: county tax records.
Cash-flow waterfall
monthlySold comps — $/sqft
last 12 mo · ≤1 miLoading sold comps…