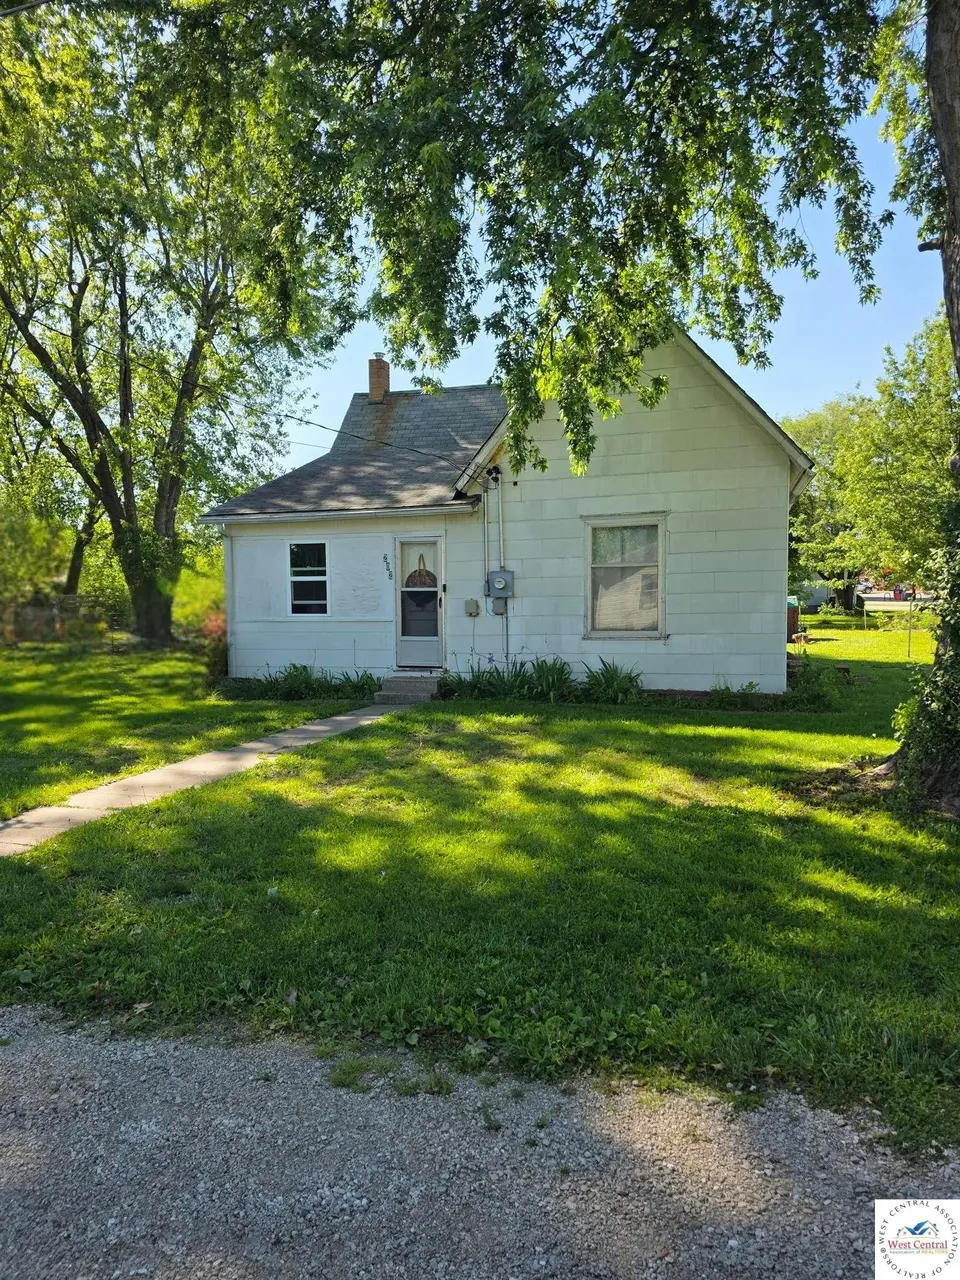
202 W Grother St · Cole Camp, MO
Flood risk 1/10 · Minimal
- FEMA flood zone
- X (unshaded)
- Chance of flooding over 30 yrs
- 0.0%
- Est. flood insurance / yr
- $473 – $860
Fire risk 5/10 · Moderate
- Est. fire insurance / yr
- $1,054 – $1,958
Heat risk 4/10 · Minor
- Hot days now (above 107°F)
- 7 days/yr
- Hot days in 30 yrs
- 18 days/yr
Wind risk 2/10 · Minimal
- Chance of severe wind over 30 yrs
- —
Air-quality risk 1/10 · Minimal
- Unhealthy air days now
- 0 days/yr
- Unhealthy air days in 30 yrs
- 0 days/yr
Risk factors via First Street. Map © Google.
Why this score? — see what drove the C- grade
The composite is a weighted blend of 9 inputs, each scored 0–100. Each bar is that input's sub-score; the figure is the points it added to the 100-point composite (weight × sub-score).
- Cash flow +15.0/30.0
- Appreciation +10.0/10.0
- ARV discount +7.5/15.0
- DSCR +4.6/10.0
- Schools +4.1/10.0
- Livability +3.5/5.0
- 1% rule +2.9/10.0
- Rent growth +2.5/5.0
- Condition / age +2.5/5.0
$105,000
🖨 Deal sheet 📄 Offer letter ✓ Due diligence
Listing remarks
More photos coming soon!! Discover this charming 2-bedroom, 1-bathroom home located in the heart of Cole Camp. Conveniently situated near a variety of local amenities, this property offers both comfort and accessibility. The home features a thoughtfully designed, cozy layout and a fenced-in backyard, perfect for relaxation or entertaining. New HVAC installed in 2024. Whether you're a first-time homebuyer, investor, or looking to downsize, this property presents an excellent opportunity. Offered at an attractive price, this home is one you won’t want to miss—schedule your showing today!
Key facts
- New hvac
- Local amenities
- Fenced-in backyard
Tags
Property features AI
Exterior
- Parking: No garage
- Utilities: Electric service; Public water (electric water heater)
- Home design: Single-family residence; Residential property
- Exterior features: 0.28-acre lot
Interior
- Bathrooms: 1 full bathroom
- Heating & cooling: Central air conditioning (electric); Electric heating
- Interior features: Electric water heater; Central electric air conditioning; Electric heating
Neighborhood map
What this means for you Summary
Snapshot
- This is a 2-bed/1.0-bath other listed at $105k.
Deal economics
- At list price, monthly cash flow is $33 ($391/yr) — positive.
- The deal already cash-flows at list — no discount required.
- To meet the 1% rule (rent ≥ 1% of price), the offer needs to be $83k (21.4% below list).
- Recommended offer: $83k (21.4% below list) — sets the bar for 1% rule.
Location & tenants
- Location reads 70/100 on livability (#123 in MO) — a middle-class / working-renter tenant base. Strengths: crime A+, cost of living A+, housing A+; Watch: employment D+, amenities F, commute F.
- Cole Camp R-I (rural): math 49% / reading 49% proficiency, ranked #61 of 324 in MO (top 19%) — families likely to look elsewhere, expect single-tenant / working-renter base with shorter leases.
- Market conditions: 18 active listings in the ZIP; 9 units permitted in Benton County in 2024 (0 in 5+ unit buildings).
Forward outlook
- In year one you build about $11k of equity ($726 loan paydown + $10k appreciation (10.0% local appreciation)).
- Benton County population projected at -21% by 2050 — secular population decline; favor cash flow + early exit over multi-decade hold.
- At projected returns (10.0% appreciation + 3.0% rent growth), your $29k cash investment doubles in ~3 years — after that, you're playing with house money.
- By year 4, paydown + projected appreciation supports a ~$40k cash-out refi (75% LTV) — recoverable capital for the next deal without selling this one.
Negotiation context
- It's been on market 44 days — a 3% lower offer ($102k) is reasonable based on typical stale-listing flexibility.
Risks & watch-outs
- Watch-outs: built in 1930 — expect roof / HVAC / electrical / plumbing capex.
- Climate carrying-cost: moderate wildfire risk — expect insurance premiums to compound above CPI over the hold.
Questions for the listing agent
- It's been on market 44 days. Have you received any prior offers? Is the seller open to a 21% concession, seller financing, or rate buy-down credit?
- Built in 1930 — when were the roof, HVAC, electrical panel, plumbing, and water heater last replaced?
- Is there a deadline driving the sale (1031 exchange, divorce, estate, relocation)? That informs how much negotiation room exists.
- Schools are B-rated — typically a magnet for longer-tenancy family renters. What's the average tenant stay here, and is there a school-zone premium baked into asking?
- What's the average days-on-market for RENTAL listings here right now (not sales)? A rising rental-DOM trend means longer vacancies and softer asking-rent achievability than the comps imply.
- What's the recent tenant-quality profile in this submarket — average credit score on applications, eviction rate, late-payment / NSF rate, and stable-employment percentage? A property-management company in the area should have these aggregated.
- How much new for-sale + rental construction is in the pipeline within 1–3 miles? Heavy new supply typically softens prices + rents 12–24 months out; constrained supply supports both.
Investment metrics
- 1% rule
- 0.79% ✗
- Cap rate
- 6.66%
- Cash-on-cash
- 1.33%
- DSCR
- 1.06
- GRM
- 10.6
CMA / ARV
No comps found within radius.
Projected returns pro-forma
10.0% appreciation · 3.0% rent growth · sell at horizon
- IRR
- 25.2%
- Equity multiple
- 3.01×
- Total profit
- $59,206
- Equity at exit
- $94,592
- IRR
- 22.2%
- Equity multiple
- 6.87×
- Total profit
- $172,617
- Equity at exit
- $203,992
Cash invested: $29,400 (down + closing). Projections, not guarantees.
Landlord ↔ Tenant lean methodology
- Overall (STATE)
- 81 Strongly Landlord-Friendly
- State Missouri
- 81 Strongly Landlord-Friendly · R+10
- County
- — inherits STATE
- City
- — inherits STATE
ZIP-level market 65325
- Home prices YoY
- 14.5%
- Active inventory
- 18
- Price-to-rent
- 10.6×
Monthly cashflow live
- Estimated rent
- $825 medium interval (Pro) →
- Mortgage (P&I)
- −$551
- Tax from tax record
- −$25 /mo · $299/yr
- Insurance
- −$44
- HOA
- −$0
- Vacancy / Maint / Mgmt
- −$173
- Net cashflow
- $33
Break-even live
UW: 25.0% down · 7.5% · 30yr · 1.5% tax · 5.0% vac · 8.0% maint · 8.0% mgmt
Financing live
Cash to close
- Down payment
- $26,250
- Closing costs
- $3,150
- Reserves months
- —
- Total cash needed
- —
Loan-product check · same deal, 3 products live
Conventional
25% down · 7.5% · 30yr
- Down + closing
- —
- Monthly P&I
- —
- Monthly cashflow
- —
- DSCR
- —
- Eligible?
- —
Personal DTI + credit; lowest rate.
DSCR
20% down · 8.5% · 30yr
- Down + closing
- —
- Monthly P&I
- —
- Monthly cashflow
- —
- DSCR
- —
- Eligible?
- —
No personal income docs; deal must DSCR.
Hard money
10% down · 12.0% · 12mo
- Down + closing
- —
- Monthly P&I
- —
- Monthly cashflow
- —
- DSCR
- —
- Eligible?
- —
Short-term bridge; refi at stabilization.
Listing history 18 events
-
2026-06-19days on market $105,000 Active 44 DOM
-
2026-06-18days on market $105,000 Active 43 DOM
-
2026-06-17days on market $105,000 Active 42 DOM
-
2026-06-16days on market $105,000 Active 41 DOM
-
2026-06-15days on market $105,000 Active 40 DOM
-
2026-06-14days on market $105,000 Active 38 DOM
-
2026-06-12days on market $105,000 Active 37 DOM
-
2026-06-09days on market $105,000 Active 34 DOM
-
2026-06-08days on market $105,000 Active 33 DOM
-
2026-06-07days on market $105,000 Active 32 DOM
-
2026-06-05days on market $105,000 Active 29 DOM
-
2026-06-03days on market $105,000 Active 28 DOM
-
2026-06-02days on market $105,000 Active 27 DOM
-
2026-06-01days on market $105,000 Active 26 DOM
-
2026-05-31days on market $105,000 Active 25 DOM
-
2026-05-30days on market $105,000 Active 24 DOM
-
2026-05-06$105,000 Active 604-char remark
-
1990-05-01soldstatus
ⓘ Source: listings_history table (triggers on properties + properties_extension) + one-shot
backfill from property_details.listing_events for pre-trigger history.
Tax reassessment forecast MO · Resets to sale price
- Current annual tax
- $299 · $25/mo
- Projected year-2 tax
- $1,018 · $85/mo
- Expected delta
- +$720/yr (+$60/mo · 240.8%)
ⓘ Screening estimate from a state-policy table — verify with the county assessor before closing.
Climate risk First Street
- Flood 1/10 Low FEMA zone X (unshaded) · 0% chance over 30 yrs
- Wildfire 5/10 Major
- Heat 4/10 Moderate 7 d/yr ≥107°F today · 18 d/yr by 30 yrs out
- Wind 2/10 Low
- Air quality 1/10 Low 0 unhealthy d/yr today · 0 by 30 yrs out
Nearby sold comps map
Loading sold comps map…
Walkable amenities ~0.75 mi
Loading nearby amenities…
Taxation est. · year 1
- Rental income
- $9,901
- − Mortgage interest
- −$5,882
- − Property taxes
- −$299
- − Insurance
- −$525
- − Repairs & maintenance
- −$792
- − Management
- −$792
- − Depreciation
- −$3,055
- Taxable loss
- −$1,443
- Est. tax savings @ 24.0%
- +$346
- After-tax cash flow
- $737/yr
For passive investors: Depreciation is non-cash, so a rental often shows a tax loss while cash-flowing — sheltering income. Rental losses are passive: they offset passive income freely, and up to $25,000/yr can offset ordinary (W-2) income if you actively participate and your MAGI is under $100k (phasing out to $0 by $150k); unused losses carry forward. On sale, claimed depreciation is recaptured at up to 25%, and gains may owe capital-gains tax (a 1031 exchange can defer both). Figures are a year-1 estimate at your 24.0% rate — not tax advice; consult a CPA.
Schools (NCES district)
- District
- Cole Camp R-I
- NCES district ID
- 2909900
- Math proficiency
- 49% ▼ -10.00%
- Reading proficiency
- 49% ▼ -5.00%
- Median HH income
- $37,598
- Composite
- 40.78/100
- National rank
- #3641
- State rank
- #61 of 324 in MO
Livability — Cole Camp
- Score
- 70/100
- State rank
- #123
- US rank
- #7335
Category grades
Schools grade is shown separately in the Schools card above.
Census & demographics
- Census place
- Cole Camp, MO
- Population (ZIP)
- 3,134
Population outlook (Benton County) Hauer SSP2
- Today (2025)
- 17,355 people
- By 2030
- 16,513 · -4.9%
- By 2040
- 14,898 · -14.2%
- By 2050
- 13,662 · -21.3%
- By 2075
- 11,308 · -34.8%
- By 2100
- 8,755 · -49.6%
Race, ethnicity, and origin ACS 2023
- Neighborhood character
- Predominantly White (97%)
- Race & ethnicity
- White 97% Hispanic / Latino 1%
- Common ancestry
- Slovak 4% Serbian 1% Iranian 1%
- Foreign-born
- 0%
- Languages at home
- 98% English-only · German/W. Germanic 1% Spanish 1%
Political lean MEDSL · Benton
- 2024 margin
- Solid R (+59.1) · D 20.1% · R 79.2%
- 2008→2024 swing
- -36.8pp toward R · 2008: -22.3pp · 2024: -59.1pp
- All cycles
- 2024: R+59.1 2020: R+56.6 2016: R+54.1 2012: R+34.3 2008: R+22.3
Not yet ingested
- Civics
- —
Market trends
- HPI YoY
- ▲ 30.98%
- Current HPI
- 244.3929
- Rent YoY
- —
- Metro
- —
- State GDP YoY
- ▲ 1.84%
- F500 in state
- 20
Industry mix (Fortune 500 HQ in MO)
| Industry | F500 HQs | Revenue |
|---|---|---|
| Healthcare | 1 | $163B |
|
||
| Insurance | 1 | $21B |
|
||
| Industrial Technology | 1 | $17B |
|
||
| Retail | 1 | $16B |
|
||
| Industrial Distribution | 1 | $10B |
|
||
| Utilities | 1 | $9B |
|
||
Price history
2 events — show timeline
- 2026-05-06 Listed $105,000 WCAR
- 1990-05-01 Sold (Public Records) — Public Records
Property tax history
+4.4%/yrLatest (2025): $299 · +9.1% YoY. Source: county tax records.
Cash-flow waterfall
monthlySold comps — $/sqft
last 12 mo · ≤1 miLoading sold comps…