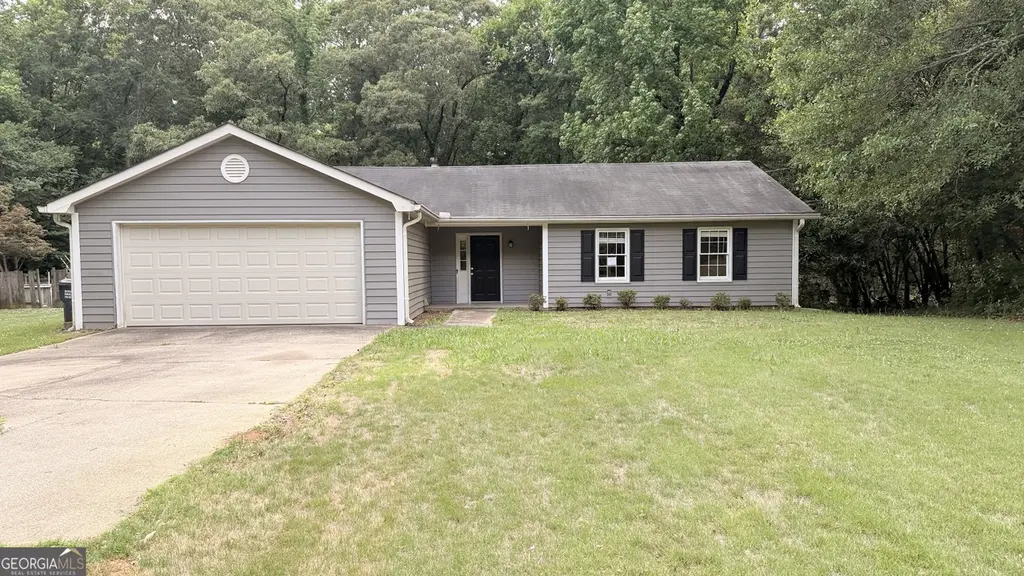
55 Oak Crest Ct · Conyers, GA
Flood risk 1/10 · Minimal
- FEMA flood zone
- X (unshaded)
- Chance of flooding over 30 yrs
- 0.0%
- Est. flood insurance / yr
- $507 – $1,088
Fire risk 3/10 · Minor
- Est. fire insurance / yr
- $963 – $1,789
Heat risk 6/10 · Moderate
- Hot days now (above 106°F)
- 7 days/yr
- Hot days in 30 yrs
- 17 days/yr
Wind risk 6/10 · Moderate
- Chance of severe wind over 30 yrs
- 27.0%
Air-quality risk 4/10 · Minor
- Unhealthy air days now
- 5 days/yr
- Unhealthy air days in 30 yrs
- 6 days/yr
Risk factors via First Street. Map © Google.
Why this score? — see what drove the D grade
The composite is a weighted blend of 9 inputs, each scored 0–100. Each bar is that input's sub-score; the figure is the points it added to the 100-point composite (weight × sub-score).
- Cash flow +14.0/30.0
- ARV discount +8.9/15.0
- DSCR +4.3/10.0
- 1% rule +3.4/10.0
- Livability +3.4/5.0
- Rent growth +3.0/5.0
- Condition / age +2.5/5.0
- Schools +1.9/10.0
- Appreciation +0.0/10.0
$245,900
🖨 Deal sheet 📄 Offer letter ✓ Due diligence
Listing remarks MLS
Lovely move-in ready 3 bedroom 2 bath ranch home in Covington. This is a great home on over 1 acre with a level fenced yard and cute shed in the back. This home has a large great room with cozy brick fireplace, vaulted ceiling and fresh neutral paint and great natural lighting. There is a separate dining room and a timeless kitchen with white cabinets, granite countertops and stainless steel appliances. There is a nice deck in the back for entertaining. This community does not have an HOA so no rental restrictions.
Key facts
- Generous lot
- Cozy brick fireplace
- Updated flooring
Tags
Property features AI
Finance
- Other: Lot is level and approximately 1.19 acres
- Financial info: Listing offered As-Is; sale types include Cash, Conventional, VA Loan; Owner/REO sale
- HOA & community: Has association (no regular association fee listed)
Exterior
- Parking: Attached garage with space for 2 vehicles
- Security: Smoke detector(s)
- Utilities: Public water; Septic tank; Electricity available
- Home design: Single-family residence; Resale property; Levels: One; Located in Oak Brook subdivision
- Construction: Built in 1989; Composition roof; Slab foundation; Other construction materials
- Exterior features: Deck; Chain link fenced backyard; Shed(s)
Interior
- Kitchen: Dishwasher; Refrigerator; Breakfast room
- Bedrooms: 3 bedrooms (all on the main level)
- Flooring: Carpet; Vinyl
- Bathrooms: 2 full bathrooms (both on the main level)
- Heating & cooling: Central heating; Central air; Ceiling fan(s)
- Interior features: Accessible entrance; Accessible kitchen; One-level layout; Fireplace
- Laundry & utility: Laundry room
Neighborhood map
What this means for you Summary
Snapshot
- This is a 3-bed/2.0-bath single-family listed at $246k.
Deal economics
- At list price, monthly cash flow is $32 ($388/yr) — positive.
- The deal already cash-flows at list — no discount required.
- To meet the 1% rule (rent ≥ 1% of price), the offer needs to be $207k (15.8% below list).
- Recommended offer: $207k (15.8% below list) — sets the bar for 1% rule.
- Cap rate 6.5% vs local median 4.4% in Conyers — top-decile yield for the area; either an underpriced asset or a hidden risk that comps aren't pricing in. Stress-test before assuming the spread holds.
Location & tenants
- Location reads 67/100 on livability (#167 in GA) — a middle-class / working-renter tenant base. Strengths: cost of living A+, housing A+; Watch: crime D, amenities D, commute F.
- Newton County (suburban): math 17% / reading 26% proficiency, ranked #137 of 174 in GA (top 79%) — low school quality limits family demand, transient renter base, plan for 1-2y turnover.
- Zoned schools: Oak Hill Elementary School (math 22% / reading 32%, grade F, #689 of 1,228 statewide, top 58%, 648 students, 85% FRL); Veterans Memorial Middle School (math 12% / reading 27%, grade F, #356 of 470 statewide, top 78%, 637 students, 85% FRL); Alcovy High School (math 3% / reading 12%, grade F, #378 of 424 statewide, top 91%, 1,991 students, 55% FRL) — zoned schools average 75% FRL vs 59% district-wide (16 pts higher); higher-poverty schools than district average — tighter screening recommended.
- Market conditions: Rents rising (+1.8%/yr); 419 active listings in the ZIP; 7 comparable units currently listed for rent nearby; rentals at typical pace (median 20d on market — plan ~3-4 weeks tenant-placement turnaround); solid renter incomes; 1,480 units permitted in Newton County in 2024 (702 in 5+ unit buildings).
- This rent runs 31% of the median local income ($80k/yr) — at the standard rent-burdened threshold; future hikes will face affordability resistance.
Forward outlook
- Local home prices are declining (-3.0%/yr); year-one equity from $2k of loan paydown is wiped out by about $7k of value loss. Plan a longer hold.
- Newton County population projected at +23% by 2050 — long-run rental-demand tailwind backs the buy-and-hold thesis.
Negotiation context
- It's been on market 17 days — a 2% lower offer ($242k) is reasonable based on typical stale-listing flexibility.
- 4 sale attempts since 9y ago with the ask held roughly flat each time — persistent listings suggest the price (not the market) is what's stuck; bring a comps-based counter.
Risks & watch-outs
- Climate carrying-cost: major wind risk, 27% chance of damaging wind over 30y; extreme-heat days projected 7→17/yr by 2055 (HVAC capex compounding) — expect insurance premiums to compound above CPI over the hold.
Questions for the listing agent
- Is there a deadline driving the sale (1031 exchange, divorce, estate, relocation)? That informs how much negotiation room exists.
- Schools are D-rated, which usually means shorter tenancies and higher turnover. Who's the typical renter profile here, and what's been the actual vacancy rate?
- Crime grade is D in this area — have there been break-ins, vandalism, or insurance claims at this property in the last 3 years? What carrier currently insures it and at what premium?
- The area grade is low — what's the realistic commute time and amenity access for the typical tenant pool here? Any planned neighborhood developments (good or bad) we should know about?
- What's the average days-on-market for RENTAL listings here right now (not sales)? A rising rental-DOM trend means longer vacancies and softer asking-rent achievability than the comps imply.
- What's the recent tenant-quality profile in this submarket — average credit score on applications, eviction rate, late-payment / NSF rate, and stable-employment percentage? A property-management company in the area should have these aggregated.
- How much new for-sale + rental construction is in the pipeline within 1–3 miles? Heavy new supply typically softens prices + rents 12–24 months out; constrained supply supports both.
Investment metrics
- 1% rule
- 0.84% ✗
- Cap rate
- 6.45%
- Cash-on-cash
- 0.56%
- DSCR
- 1.03
- GRM
- 9.9
CMA / ARV
- ARV (on-the-fly)
- $253,708
- Comps found
- 11
Show comp detail 11 sales within ~0.75 mi
| Address | Dist | Beds/Ba | Sqft | Sold | Price | $/sf | Match |
|---|---|---|---|---|---|---|---|
| 25 Oak Crest Ct | 0.07mi | 3/2.0 | 1,429 (+2%) | 13mo | $249,000 | $174 | 82 |
| 30 Oakbrook Ct | 0.13mi | 3/2.0 | 1,354 (-3%) | 14mo | $260,000 | $192 | 78 |
| 15 Tara Way | 0.46mi | 3/2.0 | 1,376 (-1%) | 1mo | $279,900 | $203 | 75 |
| 70 Ashton Pl | 0.27mi | 3/2.0 | 1,403 (+1%) | 14mo | $258,000 | $184 | 75 |
| 60 Oakbrook Ct | 0.14mi | 3/2.0 | 1,494 (+7%) | 18mo | $265,000 | $177 | 66 |
| 14845 Brown Bridge Rd | 0.69mi | 3/2.0 | 1,378 (-1%) | 6mo | $330,000 | $239 | 61 |
| 20 Tara Way | 0.43mi | 3/2.0 | 1,458 (+5%) | 15mo | $242,000 | $166 | 60 |
| 280 Ashton Dr | 0.41mi | 3/2.0 | 1,460 (+5%) | 24mo | $265,000 | $182 | 53 |
| 14931 Brown Bridge Rd | 0.66mi | 4/3.0 (+1) | 1,404 (+1%) | 20mo | $335,000 | $239 | 42 |
| 90 Lark Rd | 0.69mi | 3/2.0 | 1,540 (+10%) | 22mo | $245,000 | $159 | 32 |
| 10 Meeler Dr | 0.74mi | 3/2.0 | 1,580 (+13%) | 24mo | $250,000 | $158 | 23 |
Match score weights: distance 35% · size 25% · config 20% · recency 20%. Top-matched comps best support the ARV.
Projected returns pro-forma
-3.0% appreciation · 1.84% rent growth · sell at horizon
- IRR
- -16.7%
- Equity multiple
- 0.42×
- Total profit
- $-40,206
- Equity at exit
- $36,664
- IRR
- -10.6%
- Equity multiple
- 0.39×
- Total profit
- $-42,053
- Equity at exit
- $21,261
Cash invested: $68,852 (down + closing). Projections, not guarantees.
Landlord ↔ Tenant lean methodology
- Overall (STATE)
- 90 Strongly Landlord-Friendly
- State Georgia
- 90 Strongly Landlord-Friendly · R+3
- County
- — inherits STATE
- City
- — inherits STATE
ZIP-level market 30016
- Home prices YoY
- -8.6%
- Rents YoY
- 1.8%
- Active inventory
- 419
- Price-to-rent
- 9.9×
Monthly cashflow live
- Estimated rent
- $2,072 high interval (Pro) →
- Mortgage (P&I)
- −$1,290
- Tax from tax record
- −$212 /mo · $2,548/yr
- Insurance
- −$102
- HOA
- −$0
- Vacancy / Maint / Mgmt
- −$435
- Net cashflow
- $32
Break-even live
UW: 25.0% down · 7.5% · 30yr · 1.5% tax · 5.0% vac · 8.0% maint · 8.0% mgmt
Financing live
Cash to close
- Down payment
- $61,475
- Closing costs
- $7,377
- Reserves months
- —
- Total cash needed
- —
Loan-product check · same deal, 3 products live
Conventional
25% down · 7.5% · 30yr
- Down + closing
- —
- Monthly P&I
- —
- Monthly cashflow
- —
- DSCR
- —
- Eligible?
- —
Personal DTI + credit; lowest rate.
DSCR
20% down · 8.5% · 30yr
- Down + closing
- —
- Monthly P&I
- —
- Monthly cashflow
- —
- DSCR
- —
- Eligible?
- —
No personal income docs; deal must DSCR.
Hard money
10% down · 12.0% · 12mo
- Down + closing
- —
- Monthly P&I
- —
- Monthly cashflow
- —
- DSCR
- —
- Eligible?
- —
Short-term bridge; refi at stabilization.
Rent comps 7 comps
| Address | Beds | Baths | Sqft | Rent | $/sqft | DOM | Units | Dist |
|---|---|---|---|---|---|---|---|---|
| 20 Tara Way Covington, GA | 4.0 | 2.0 | 1650 | $2,150 | $1.30 | 43d | 1 | 0.43mi |
| 11 Tara Ct Covington, GA | 3.0 | 2.0 | 1470 | $950 | $0.65 | 19d | 1 | 0.48mi |
| 80 Lark Rd Covington, GA | 3.0 | 2.0 | 1150 | $1,790 | $1.56 | 12d | 1 | 0.69mi |
| 30 Berkshire Dr Covington, GA | 3.0 | 2.0 | 1853 | $2,150 | $1.16 | 5d | 1 | 0.89mi |
| 50 Stone Creek Dr Covington, GA | 3.0 | 2.0 | 1384 | $1,795 | $1.30 | 43d | 1 | 0.95mi |
| 75 Barber Rd Covington, GA | 3.0 | 2.0 | 1128 | $1,600 | $1.42 | 5d | 1 | 1.16mi |
| 255 Butler Bridge Cir Covington, GA | 3.0 | 2.0 | 1427 | $1,699 | $1.19 | 24d | 1 | 1.31mi |
Listing history 15 events
-
2026-06-18days on market $245,900 Active 17 DOM
-
2026-06-17days on market $245,900 Active 16 DOM
-
2026-06-16days on market $245,900 Active 15 DOM
-
2026-06-15days on market $245,900 Active 14 DOM
-
2026-06-13days on market $245,900 Active 12 DOM
-
2026-06-13days on market $245,900 Active 11 DOM
-
2026-06-09days on market $245,900 Active 8 DOM
-
2026-06-08days on market $245,900 Active 7 DOM
-
2026-06-07days on market $245,900 Active 6 DOM
-
2026-06-04days on market $245,900 Active 3 DOM
-
2026-06-03days on market $245,900 Active 2 DOM
-
2026-06-02statusdays on market $245,900 Active 1 DOM
-
2026-06-01days on market $245,900 New 2 DOM
-
2026-05-31remarks 699-char remark
-
2026-05-31$245,900 New 1 DOM
ⓘ Source: listings_history table (triggers on properties + properties_extension) + one-shot
backfill from property_details.listing_events for pre-trigger history.
Tax reassessment forecast GA · Resets to sale price
- Current annual tax
- $2,548 · $212/mo
- Projected year-2 tax
- $2,548 · $212/mo
- Expected delta
- $0/yr ($0/mo · 0.0%)
ⓘ Screening estimate from a state-policy table — verify with the county assessor before closing.
Climate risk First Street
- Flood 1/10 Low FEMA zone X (unshaded) · 0% chance over 30 yrs
- Wildfire 3/10 Moderate
- Heat 6/10 Major 7 d/yr ≥106°F today · 17 d/yr by 30 yrs out
- Wind 6/10 Major 27% chance of damaging wind over 30 yrs
- Air quality 4/10 Moderate 5 unhealthy d/yr today · 6 by 30 yrs out
Nearby sold comps map
Loading sold comps map…
Walkable amenities ~0.75 mi
Loading nearby amenities…
Taxation est. · year 1
- Rental income
- $24,860
- − Mortgage interest
- −$13,774
- − Property taxes
- −$2,548
- − Insurance
- −$1,230
- − Repairs & maintenance
- −$1,989
- − Management
- −$1,989
- − Depreciation
- −$7,153
- Taxable loss
- −$3,823
- Est. tax savings @ 24.0%
- +$917
- After-tax cash flow
- $1,305/yr
For passive investors: Depreciation is non-cash, so a rental often shows a tax loss while cash-flowing — sheltering income. Rental losses are passive: they offset passive income freely, and up to $25,000/yr can offset ordinary (W-2) income if you actively participate and your MAGI is under $100k (phasing out to $0 by $150k); unused losses carry forward. On sale, claimed depreciation is recaptured at up to 25%, and gains may owe capital-gains tax (a 1031 exchange can defer both). Figures are a year-1 estimate at your 24.0% rate — not tax advice; consult a CPA.
Schools (NCES district)
- District
- Newton County
- NCES district ID
- 1303930
- Math proficiency
- 17% ▼ -13.00%
- Reading proficiency
- 26% ▼ -8.00%
- Median HH income
- $50,768
- Composite
- 19.2/100
- National rank
- #8816
- State rank
- #137 of 174 in GA
Livability — Conyers
- Score
- 67/100
- State rank
- #167
- US rank
- #10533
Category grades
Schools grade is shown separately in the Schools card above.
Census & demographics
- County
- Newton County · 104,393 people
- City population
- 96,534
- Metro
- Atlanta-Sandy Springs-Alpharetta, GA
- Population (ZIP)
- 62,968
- Household income
- $79,527
- Rent vs Own
- Severe rent burden
- 1172.0
Population outlook (Newton County) Hauer SSP2
- Today (2025)
- 118,372 people
- By 2030
- 124,234 · +5.0%
- By 2040
- 135,550 · +14.5%
- By 2050
- 145,309 · +22.8%
- By 2075
- 166,843 · +40.9%
- By 2100
- 175,800 · +48.5%
Race, ethnicity, and origin ACS 2023
- Neighborhood character
- Diverse neighborhood (Simpson 0.57)
- Race & ethnicity
- Black 59% White 29% Two or more races 8% Hispanic / Latino 6% Asian 1%
- Hispanic origin (detail)
- Mexican 4%
- Common ancestry
- Lithuanian 1% Slovak 1%
- Foreign-born
- 6% · Canada, China
- Languages at home
- 94% English-only · Spanish 4% Other Asian/Pacific 1% French/Haitian/Cajun 1%
Political lean MEDSL · Newton
- 2024 margin
- D (+15.1) · D 57.3% · R 42.2%
- 2008→2024 swing
- +14.0pp toward D · 2008: 1.2pp · 2024: 15.1pp
- All cycles
- 2024: D+15.1 2020: D+10.9 2016: D+2.4 2012: D+2.0 2008: D+1.2
Not yet ingested
- Civics
- —
Market trends
- HPI YoY
- ▼ -29.68%
- Current HPI
- 317.5605
- Rent YoY
- ▲ 1.84%
- Metro
- Atlanta-Sandy Springs-Alpharetta, GA
- State GDP YoY
- ▲ 2.66%
- F500 in state
- 28
Industry mix (Fortune 500 HQ in GA)
| Industry | F500 HQs | Revenue |
|---|---|---|
| Paper / Packaging | 2 | $29B |
|
||
| Retail | 1 | $160B |
|
||
| Transportation / Logistics | 1 | $91B |
|
||
| Airlines | 1 | $62B |
|
||
| Consumer Goods | 1 | $47B |
|
||
| Utilities | 1 | $25B |
|
||
Price history
+145.9% since first listed19 events — show timeline
- 2026-05-30 Listed $245,900 GAMLS
- 2022-08-23 Sold (Public Records) $268,900 Public Records
- 2022-08-18 Sold (MLS) $268,900 FMLS
- 2022-08-18 Sold (MLS) $268,900 GAMLS
- 2022-07-19 Pending — GAMLS
- 2022-07-19 Pending — FMLS
- 2022-07-16 Price Changed $2,030 RENT.
- 2022-07-14 Price Changed $279,000 GAMLS
- 2022-07-14 Price Changed $279,000 FMLS
- 2022-06-30 Price Changed $286,000 GAMLS
- 2022-06-30 Price Changed $286,000 FMLS
- 2022-06-11 Listed $292,000 FMLS
- 2022-06-11 Listed $292,000 GAMLS
- 2017-07-18 Sold (Public Records) $117,900 Public Records
- 2017-07-13 Sold (MLS) $117,900 GAMLS
- 2017-06-15 Pending — GAMLS
- 2017-04-25 Listed $119,900 GAMLS
- 2007-06-05 Sold (Public Records) $122,900 Public Records
- 2001-10-01 Sold (Public Records) $100,000 Public Records
Property tax history
+4.2%/yrLatest (2025): $2,548 · +7.9% YoY. Source: county tax records.
Cash-flow waterfall
monthlySold comps — $/sqft
last 12 mo · ≤1 miLoading sold comps…