1874 Lake Henry Ave · Mulberry Grove, IL
Flood risk 1/10 · Minimal
- FEMA flood zone
- X
- Chance of flooding over 30 yrs
- 0.0%
- Est. flood insurance / yr
- $473 – $860
Fire risk 3/10 · Minor
- Est. fire insurance / yr
- $804 – $1,492
Heat risk 4/10 · Minor
- Hot days now (above 106°F)
- 7 days/yr
- Hot days in 30 yrs
- 20 days/yr
Wind risk 2/10 · Minimal
- Chance of severe wind over 30 yrs
- 2.0%
Air-quality risk 2/10 · Minimal
- Unhealthy air days now
- 0 days/yr
- Unhealthy air days in 30 yrs
- 1 days/yr
Risk factors via First Street. Map © Google.
Why this score? — see what drove the B grade
The composite is a weighted blend of 9 inputs, each scored 0–100. Each bar is that input's sub-score; the figure is the points it added to the 100-point composite (weight × sub-score).
- Cash flow +28.7/30.0
- DSCR +10.0/10.0
- 1% rule +7.5/10.0
- ARV discount +7.5/15.0
- Appreciation +6.6/10.0
- Livability +2.9/5.0
- Rent growth +2.5/5.0
- Condition / age +2.5/5.0
- Schools +1.9/10.0
$80,000
🖨 Deal sheet 📄 Offer letter ✓ Due diligence
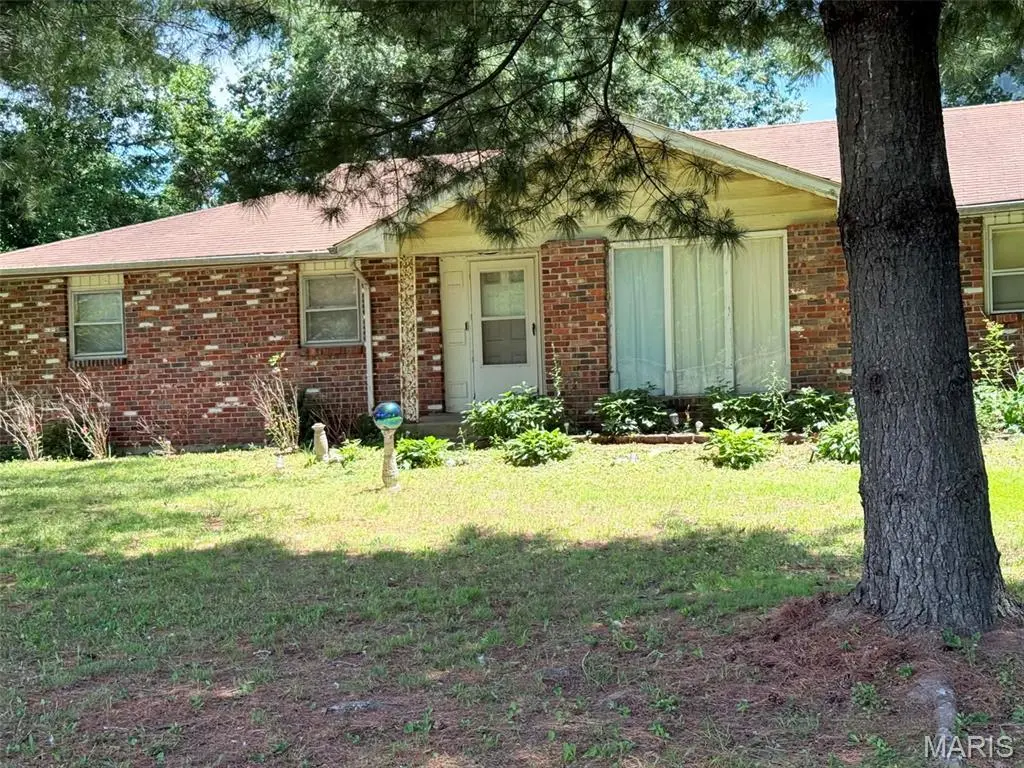
Listing remarks
Opportunity awaits on this secluded 5.5-acre property featuring a pond, mature trees, and a peaceful country setting. This 3-bedroom, 1-bath home offers a full basement and attractive brick-front exterior, providing a solid starting point for your vision. The home has been vacant for many years and will require a complete renovation, making it ideal for investors, flippers, or buyers looking to create their dream home from the ground up. Surrounded by nature and offering plenty of privacy, this property has the potential to become a truly special retreat. Whether you're looking to restore the existing home or reimagine the space entirely, this is your chance to make it your own and enjoy th
Key facts
- 5.5 acre lot
- Garage
- Built 1980
Property features AI
Finance
- Other: Living area reported as 780 (source: appraiser)
Exterior
- Parking: Has garage
- Utilities: Private well water; Private sewer; Single-phase electric service; Electricity available
- Home design: Single-family residential; Brick and vinyl siding exterior; One story
- Construction: Brick and vinyl siding construction
- Exterior features: Gentle sloping lot; Many trees; Pond on the property; Approximately 5.5 acres
Interior
- Bedrooms: Three bedrooms on the main level
- Bathrooms: One full bathroom on the main level
- Heating & cooling: Forced air heating; Central air conditioning
- Interior features: One-level living; Basement with concrete finish; Six total rooms
Neighborhood map
What this means for you Summary
Snapshot
- This is a 3-bed/1.0-bath single-family listed at $80k.
Deal economics
- At list price, monthly cash flow is $266 ($3k/yr) — positive.
- The deal already cash-flows at list — no discount required.
- Meets the 1% rule at list price ($1k rent vs $80k).
Location & tenants
- Location reads 58/100 on livability (#1,127 in IL) — a working-class tenant base; expect higher turnover. Strengths: cost of living A+, housing A+; Watch: crime F, amenities F, commute F.
- Mulberry Grove CUSD 1 (rural): math 16% / reading 21% proficiency, ranked #732 of 919 in IL (top 80%) — low school quality limits family demand, transient renter base, plan for 1-2y turnover.
- Zoned schools: Mulberry Grove Elem School (math 17% / reading 27%, grade F, #940 of 2,056 statewide, top 49%, 165 students, 0% FRL); Mulberry Grove Sr High School (math 10% / reading 10%, grade F, #528 of 693 statewide, top 82%, 111 students, 0% FRL) — zoned schools average 0% FRL vs 42% district-wide (42 pts lower); this property's tenant base skews higher-income than the district average.
- Market conditions: 7 active listings in the ZIP; 35 units permitted in Bond County in 2024 (0 in 5+ unit buildings).
Forward outlook
- In year one you build about $3k of equity ($553 loan paydown + $3k appreciation (3.1% local appreciation)).
- Bond County population projected at -23% by 2050 — secular population decline; favor cash flow + early exit over multi-decade hold.
- At projected returns (3.1% appreciation + 3.0% rent growth), your $22k cash investment doubles in ~4 years — after that, you're playing with house money.
Negotiation context
- Only 14 days on market — expect competitive offers; lowballing is unlikely to land.
- Current owner paid $42k; list at $80k implies a 90% gain — meaningful room to come down on a strong offer.
Questions for the listing agent
- Is there a deadline driving the sale (1031 exchange, divorce, estate, relocation)? That informs how much negotiation room exists.
- Schools are F-rated, which usually means shorter tenancies and higher turnover. Who's the typical renter profile here, and what's been the actual vacancy rate?
- Crime grade is F in this area — have there been break-ins, vandalism, or insurance claims at this property in the last 3 years? What carrier currently insures it and at what premium?
- What's the average days-on-market for RENTAL listings here right now (not sales)? A rising rental-DOM trend means longer vacancies and softer asking-rent achievability than the comps imply.
- What's the recent tenant-quality profile in this submarket — average credit score on applications, eviction rate, late-payment / NSF rate, and stable-employment percentage? A property-management company in the area should have these aggregated.
- How much new for-sale + rental construction is in the pipeline within 1–3 miles? Heavy new supply typically softens prices + rents 12–24 months out; constrained supply supports both.
Investment metrics
- 1% rule
- 1.25% ✓
- Cap rate
- 10.28%
- Cash-on-cash
- 14.24%
- DSCR
- 1.63
- GRM
- 6.7
CMA / ARV
No comps found within radius.
Projected returns pro-forma
3.14% appreciation · 3.0% rent growth · sell at horizon
- IRR
- 21.2%
- Equity multiple
- 2.21×
- Total profit
- $27,159
- Equity at exit
- $36,600
- IRR
- 22.1%
- Equity multiple
- 4.22×
- Total profit
- $72,233
- Equity at exit
- $56,898
Cash invested: $22,400 (down + closing). Projections, not guarantees.
Landlord ↔ Tenant lean methodology
- Overall (STATE)
- 43 Moderately Tenant-Leaning
- State Illinois
- 43 Moderately Tenant-Leaning · D+7
- County
- — inherits STATE
- City
- — inherits STATE
ZIP-level market 62262
- Home prices YoY
- 2.4%
- Active inventory
- 7
- Price-to-rent
- 6.7×
Monthly cashflow live
- Estimated rent
- $1,001 medium interval (Pro) →
- Mortgage (P&I)
- −$420
- Tax from tax record
- −$72 /mo · $861/yr
- Insurance
- −$33
- HOA
- −$0
- Vacancy / Maint / Mgmt
- −$210
- Net cashflow
- $266
Break-even live
UW: 25.0% down · 7.5% · 30yr · 1.5% tax · 5.0% vac · 8.0% maint · 8.0% mgmt
Financing live
Cash to close
- Down payment
- $20,000
- Closing costs
- $2,400
- Reserves months
- —
- Total cash needed
- —
Loan-product check · same deal, 3 products live
Conventional
25% down · 7.5% · 30yr
- Down + closing
- —
- Monthly P&I
- —
- Monthly cashflow
- —
- DSCR
- —
- Eligible?
- —
Personal DTI + credit; lowest rate.
DSCR
20% down · 8.5% · 30yr
- Down + closing
- —
- Monthly P&I
- —
- Monthly cashflow
- —
- DSCR
- —
- Eligible?
- —
No personal income docs; deal must DSCR.
Hard money
10% down · 12.0% · 12mo
- Down + closing
- —
- Monthly P&I
- —
- Monthly cashflow
- —
- DSCR
- —
- Eligible?
- —
Short-term bridge; refi at stabilization.
Listing history 10 events
-
2026-06-18days on market $80,000 Coming Soon 14 DOM
-
2026-06-17days on market $80,000 Coming Soon 13 DOM
-
2026-06-16days on market $80,000 Coming Soon 12 DOM
-
2026-06-15days on market $80,000 Coming Soon 11 DOM
-
2026-06-13days on market $80,000 Coming Soon 9 DOM
-
2026-06-12days on market $80,000 Coming Soon 8 DOM
-
2026-06-09days on market $80,000 Coming Soon 5 DOM
-
2026-06-08days on market $80,000 Coming Soon 4 DOM
-
2026-06-07remarks 699-char remark
-
2026-06-07$80,000 Coming Soon 3 DOM
ⓘ Source: listings_history table (triggers on properties + properties_extension) + one-shot
backfill from property_details.listing_events for pre-trigger history.
Tax reassessment forecast IL · Partial reset (capped growth)
- Current annual tax
- $861 · $72/mo
- Projected year-2 tax
- $1,338 · $112/mo
- Expected delta
- +$478/yr (+$40/mo · 55.5%)
ⓘ Screening estimate from a state-policy table — verify with the county assessor before closing.
Climate risk First Street
- Flood 1/10 Low FEMA zone X · 0% chance over 30 yrs
- Wildfire 3/10 Moderate
- Heat 4/10 Moderate 7 d/yr ≥106°F today · 20 d/yr by 30 yrs out
- Wind 2/10 Low 2% chance of damaging wind over 30 yrs
- Air quality 2/10 Low 0 unhealthy d/yr today · 1 by 30 yrs out
Nearby sold comps map
Loading sold comps map…
Walkable amenities ~0.75 mi
Loading nearby amenities…
Taxation est. · year 1
- Rental income
- $12,007
- − Mortgage interest
- −$4,481
- − Property taxes
- −$861
- − Insurance
- −$400
- − Repairs & maintenance
- −$961
- − Management
- −$961
- − Depreciation
- −$2,327
- Taxable income
- $2,017
- Est. tax owed @ 24.0%
- −$484
- After-tax cash flow
- $2,706/yr
For passive investors: Depreciation is non-cash, so a rental often shows a tax loss while cash-flowing — sheltering income. Rental losses are passive: they offset passive income freely, and up to $25,000/yr can offset ordinary (W-2) income if you actively participate and your MAGI is under $100k (phasing out to $0 by $150k); unused losses carry forward. On sale, claimed depreciation is recaptured at up to 25%, and gains may owe capital-gains tax (a 1031 exchange can defer both). Figures are a year-1 estimate at your 24.0% rate — not tax advice; consult a CPA.
Schools (NCES district)
- District
- Mulberry Grove CUSD 1
- NCES district ID
- 1727450
- Math proficiency
- 16% ▼ -7.00%
- Reading proficiency
- 21% ▼ -5.00%
- Median HH income
- $43,252
- Composite
- 19.32/100
- National rank
- #13954
- State rank
- #732 of 919 in IL
Livability — Mulberry Grove
- Score
- 58/100
- State rank
- #1127
- US rank
- #21267
Category grades
Schools grade is shown separately in the Schools card above.
Census & demographics
- Population (ZIP)
- 1,887
Population outlook (Bond County) Hauer SSP2
- Today (2025)
- 15,651 people
- By 2030
- 15,008 · -4.1%
- By 2040
- 13,490 · -13.8%
- By 2050
- 12,002 · -23.3%
- By 2075
- 9,019 · -42.4%
- By 2100
- 6,539 · -58.2%
Race, ethnicity, and origin ACS 2023
- Neighborhood character
- Predominantly White (87%)
- Race & ethnicity
- White 87% Two or more races 8% Black 4%
- Common ancestry
- Lithuanian 4% Iranian 3% Slovak 1%
- Foreign-born
- 0%
- Languages at home
- 98% English-only · Spanish 1% German/W. Germanic 1%
Political lean MEDSL · Bond
- 2024 margin
- Solid R (+44.8) · D 26.5% · R 71.3% · Other 2.2%
- 2008→2024 swing
- -43.5pp toward R · 2008: -1.3pp · 2024: -44.8pp
- All cycles
- 2024: R+44.8 2020: R+41.0 2016: R+37.8 2012: R+14.7 2008: R+1.3
Not yet ingested
- Civics
- —
Market trends
- HPI YoY
- ▲ 3.14%
- Current HPI
- 133.1925
- Rent YoY
- —
- Metro
- —
- State GDP YoY
- ▲ 1.59%
- F500 in state
- 60
Industry mix (Fortune 500 HQ in IL)
| Industry | F500 HQs | Revenue |
|---|---|---|
| Insurance | 4 | $201B |
|
||
| Consumer Goods | 4 | $87B |
|
||
| Industrial Machinery | 3 | $64B |
|
||
| Healthcare | 2 | $55B |
|
||
| Retail / Pharmacy | 1 | $148B |
|
||
| Agriculture / Food | 1 | $86B |
|
||
Price history
+90.5% since first listed2 events — show timeline
- 2026-06-04 Coming Soon $80,000 MARIS as Distributed by MLS Grid
- 2002-06-10 Sold (Public Records) $42,000 Public Records
Property tax history
-8.0%/yrLatest (2024): $861 · +5.8% YoY. Source: county tax records.
Cash-flow waterfall
monthlySold comps — $/sqft
last 12 mo · ≤1 miLoading sold comps…