6026 S Zen Trail Way · St. George, UT
Flood risk 1/10 · Minimal
- FEMA flood zone
- X (unshaded)
- Chance of flooding over 30 yrs
- 0.0%
- Est. flood insurance / yr
- $473 – $860
Fire risk 6/10 · Moderate
- Est. fire insurance / yr
- $453 – $841
Heat risk 7/10 · Major
- Hot days now (above 103°F)
- 5 days/yr
- Hot days in 30 yrs
- 14 days/yr
Wind risk 1/10 · Minimal
- Chance of severe wind over 30 yrs
- —
Air-quality risk 1/10 · Minimal
- Unhealthy air days now
- 0 days/yr
- Unhealthy air days in 30 yrs
- 0 days/yr
Risk factors via First Street. Map © Google.
Why this score? — see what drove the F grade
The composite is a weighted blend of 9 inputs, each scored 0–100. Each bar is that input's sub-score; the figure is the points it added to the 100-point composite (weight × sub-score).
- ARV discount +7.5/15.0
- Cash flow +7.1/30.0
- Schools +3.7/10.0
- 1% rule +2.9/10.0
- Rent growth +2.6/5.0
- Livability +2.5/5.0
- Condition / age +2.5/5.0
- DSCR +1.3/10.0
- Appreciation +0.0/10.0
$265,000
🖨 Deal sheet (PDF) 📄 Offer letter ✓ Due diligence
Listing remarks MLS
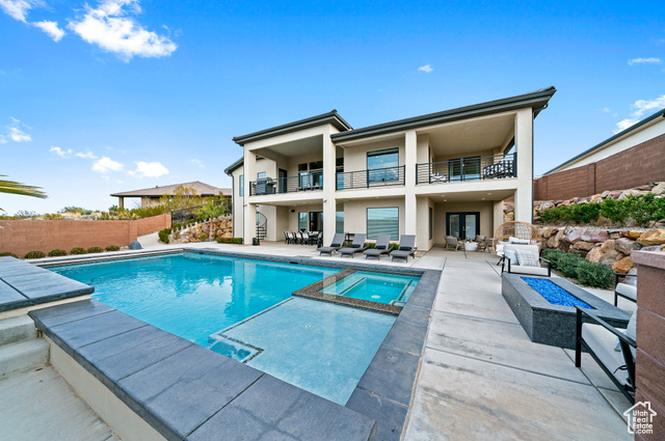
Your piece of paradise awaits you. This is the new and better way to own a vacation home. Offered at a 1/8th Ownership Share, this custom and professionally designed home will check off all of your boxes! Our Zen Trail home will take you to the peace and serenity you deserve. Fully furnished and turn-key, this home is also professionally managed for a seamless vacation experience. Spend 6.5 weeks per year at this luxury estate and start to live your best life! Take-in the views of Pine Mountain while dipping in your 20x40 pool or hot tub surrounded by a meticulously manicured backyard. This custom home also features a spacious open concept kitchen and family gathering area to entertain or gather around the fireplace. Monthly operating costs are estimated at $661. After biking or hiking on the outdoor trails that are paces away from your front door, you can relax in your stadium seating theater room! Too many interior custom upgrades to mention. Call for additional photos, info and video. Square footage figures are provided as a courtesy estimate only and were obtained from county record. Buyer is advised to obtain an independent measurement and verify all information in listing. The home is managed and maintained By EmberHome and offers a software solution for all of your bookings. A second home shouldn't be a second job!
Key facts
- Pine mountain views
- Hot tub
- Turn-key
Tags
Property features AI
Finance
- Other: Subdivision: DESERTS EDGE PH 3
- HOA & community: Homeowners association present; Annual association fee
Exterior
- Parking: Attached garage; Three garage spaces; Three covered parking spaces; Three open parking spaces; Six total parking spaces
- Utilities: Natural gas connected; Electricity connected; Sewer available and connected (public); Water connected (culinary)
- Home design: Rambler/Ranch architectural style; Single-family home; Single-level living / ground level access; Built in 2016; Fractional ownership
- Construction: Clapboard/Masonite, stone and stucco exterior materials; Tile roof; Built/standing condition
- Exterior features: Balcony; Basement entrance with walk-out access; Covered deck; Covered and open patio; Sliding glass doors; Double-pane windows; Exterior lighting; Walkout basement; Fenced yard (full); Sprinkler system (auto-full); Terraced yard with landscaping and mature trees; Xeriscaped areas; Waterfall; Views of mountains, valley and red rock
Interior
- Kitchen: Gas oven; Gas range; Free-standing range/oven
- Bedrooms: Three main-level bedrooms; Primary bedroom on the 1st floor
- Flooring: Carpet; Hardwood; Laminate; Tile; Travertine
- Bathrooms: Three full bathrooms; One three-quarter bathroom
- Heating & cooling: Forced air heating; Gas central heating; Hot water heating; Central air conditioning
- Interior features: Basement apartment / mother-in-law suite; Primary bath; Walk-in closet; Gas log fireplace; Great room; Vaulted ceilings; Granite countertops; Home theater
- Laundry & utility: Electric dryer hookup; Gas dryer hookup
Neighborhood map
What this means for you Summary
Snapshot
- This is a 3-bed/4.0-bath single-family listed at $265k.
Deal economics
- At list price, monthly cash flow is $-377 ($-5k/yr) — negative.
- To cash-flow at today's rent, offer at most $198k (25.1% below list).
- To meet the 1% rule (rent ≥ 1% of price), the offer needs to be $209k (21.1% below list).
- Recommended offer: $198k (25.1% below list) — sets the bar for cash-flow.
Location & tenants
- Location reads: area grade F — affects rentability + tenant quality, not the cash-flow math above.
- Washington District (urban): math 42% / reading 45% proficiency, ranked #37 of 80 in UT (top 46%) — families likely to look elsewhere, expect single-tenant / working-renter base with shorter leases.
- Zoned schools: Sunrise Ridge Intermediate (math 52% / reading 54%, grade C+, #17 of 138 statewide, top 12%, 810 students, 17% FRL); Desert Hills High (math 47% / reading 58%, grade C-, #22 of 171 statewide, top 13%, 1,210 students, 15% FRL) — zoned schools average 16% FRL vs 36% district-wide (20 pts lower); this property's tenant base skews higher-income than the district average.
- Market conditions: Rents flat; 980 active listings in the ZIP; solid renter incomes; 3,140 units permitted in Washington County in 2024 (650 in 5+ unit buildings).
Forward outlook
- Local home prices are declining (-3.0%/yr); year-one equity from $2k of loan paydown is wiped out by about $8k of value loss. Plan a longer hold.
- Washington County population projected at +44% by 2050 — long-run rental-demand tailwind backs the buy-and-hold thesis.
Negotiation context
- It's been on market 328 days — a 12% lower offer ($233k) is reasonable based on typical stale-listing flexibility.
- 6 sale attempts since 4y ago with the ask held roughly flat each time — persistent listings suggest the price (not the market) is what's stuck; bring a comps-based counter.
Risks & watch-outs
- Climate carrying-cost: major wildfire risk; extreme-heat days projected 5→14/yr by 2055 (HVAC capex compounding) — expect insurance premiums to compound above CPI over the hold.
Questions for the listing agent
- What do current leases actually rent for vs. the listed asking? Can we see a recent rent roll and the last 12 months of T-12 income?
- It's been on market 328 days. Have you received any prior offers? Is the seller open to a 25% concession, seller financing, or rate buy-down credit?
- Why hasn't it sold? Are there any deal-killer items the seller is aware of (foundation, flood, title, zoning, code violations)?
- Is there a deadline driving the sale (1031 exchange, divorce, estate, relocation)? That informs how much negotiation room exists.
- The area grade is low — what's the realistic commute time and amenity access for the typical tenant pool here? Any planned neighborhood developments (good or bad) we should know about?
- What's the average days-on-market for RENTAL listings here right now (not sales)? A rising rental-DOM trend means longer vacancies and softer asking-rent achievability than the comps imply.
- What's the recent tenant-quality profile in this submarket — average credit score on applications, eviction rate, late-payment / NSF rate, and stable-employment percentage? A property-management company in the area should have these aggregated.
- How much new for-sale + rental construction is in the pipeline within 1–3 miles? Heavy new supply typically softens prices + rents 12–24 months out; constrained supply supports both.
Investment metrics
- 1% rule
- 0.79% ✗
- Cap rate
- 4.59%
- Cash-on-cash
- -6.10%
- DSCR
- 0.73
- GRM
- 10.6
CMA / ARV
No comps found within radius.
Projected returns pro-forma
-3.0% appreciation · 0.2% rent growth · sell at horizon
- IRR
- -30.3%
- Equity multiple
- 0.02×
- Total profit
- $-72,534
- Equity at exit
- $39,512
- IRR
- -53.0%
- Equity multiple
- -0.56×
- Total profit
- $-115,693
- Equity at exit
- $22,912
Cash invested: $74,200 (down + closing). Projections, not guarantees.
Landlord ↔ Tenant lean methodology
- Overall (STATE)
- 86 Strongly Landlord-Friendly
- State Utah
- 86 Strongly Landlord-Friendly · R+15
- County
- — inherits STATE
- City
- — inherits STATE
ZIP-level market 84790
- Rents YoY
- 0.2%
- Active inventory
- 980
- Price-to-rent
- 10.6×
Monthly cashflow live
- Estimated rent
- $2,090 medium interval (Pro) →
- Mortgage (P&I)
- −$1,390
- Tax from tax record
- −$528 /mo · $6,341/yr
- Insurance
- −$110
- HOA
- −$0
- Vacancy / Maint / Mgmt
- −$439
- Net cashflow
- $-377
Break-even live
Sensitivity live
| Price | -10% $-227 | -5% $-302 | +0% $-377 | +5% $-452 | +10% $-527 |
|---|---|---|---|---|---|
| Rent | -10% $-542 | -5% $-460 | +0% $-377 | +5% $-294 | +10% $-212 |
| Rate | -1.0pp $-244 | -0.5pp $-310 | base $-377 | +0.5pp $-446 | +1.0pp $-516 |
UW: 25.0% down · 7.5% · 30yr · 1.5% tax · 5.0% vac · 8.0% maint · 8.0% mgmt
Financing live
Cash to close
- Down payment
- $66,250
- Closing costs
- $7,950
- Reserves months
- —
- Total cash needed
- —
Loan-product check · same deal, 3 products live
Conventional
25% down · 7.5% · 30yr
- Down + closing
- —
- Monthly P&I
- —
- Monthly cashflow
- —
- DSCR
- —
- Eligible?
- —
Personal DTI + credit; lowest rate.
DSCR
20% down · 8.5% · 30yr
- Down + closing
- —
- Monthly P&I
- —
- Monthly cashflow
- —
- DSCR
- —
- Eligible?
- —
No personal income docs; deal must DSCR.
Hard money
10% down · 12.0% · 12mo
- Down + closing
- —
- Monthly P&I
- —
- Monthly cashflow
- —
- DSCR
- —
- Eligible?
- —
Short-term bridge; refi at stabilization.
Listing history 39 events
-
2026-06-22days on market $265,000 Active 328 DOM
-
2026-06-19days on market $265,000 Active 326 DOM
-
2026-06-18days on market $265,000 Active 325 DOM
-
2026-06-17days on market $265,000 Active 324 DOM
-
2026-06-16days on market $265,000 Active 323 DOM
-
2026-06-15days on market $265,000 Active 322 DOM
-
2026-06-14days on market $265,000 Active 320 DOM
-
2026-06-13days on market $265,000 Active 319 DOM
-
2026-06-10days on market $265,000 Active 317 DOM
-
2026-06-09days on market $265,000 Active 316 DOM
-
2026-06-08days on market $265,000 Active 315 DOM
-
2026-06-07days on market $265,000 Active 314 DOM
-
2026-06-05days on market $265,000 Active 311 DOM
-
2026-06-02days on market $265,000 Active 309 DOM
-
2026-06-01days on market $265,000 Active 308 DOM
-
2026-05-31days on market $265,000 Active 307 DOM
-
2026-05-30days on market $265,000 Active 306 DOM
-
2025-07-28$265,000 Active
-
2025-07-21$265,000 Active 1343-char remark
Show marketing remark (1343 chars)
Your piece of paradise awaits you. This is the new and better way to own a vacation home. Offered at a 1/8th Ownership Share, this custom and professionally designed home will check off all of your boxes! Our Zen Trail home will take you to the peace and serenity you deserve. Fully furnished and turn-key, this home is also professionally managed for a seamless vacation experience. Spend 6.5 weeks per year at this luxury estate and start to live your best life! Take-in the views of Pine Mountain while dipping in your 20x40 pool or hot tub surrounded by a meticulously manicured backyard. This custom home also features a spacious open concept kitchen and family gathering area to entertain or gather around the fireplace. Monthly operating costs are estimated at $661. After biking or hiking on the outdoor trails that are paces away from your front door, you can relax in your stadium seating theater room! Too many interior custom upgrades to mention. Call for additional photos, info and video. Square footage figures are provided as a courtesy estimate only and were obtained from county record. Buyer is advised to obtain an independent measurement and verify all information in listing. The home is managed and maintained By EmberHome and offers a software solution for all of your bookings. A second home shouldn't be a second job!
-
2025-07-20historical
-
2025-01-30price $265,000
-
2025-01-30price $265,000
-
2024-11-18price $269,000
-
2024-11-18price $269,000
-
2024-09-04price $298,999
-
2024-09-04price $289,999
-
2024-07-19$310,000 Active
-
2024-06-05historical
-
2024-02-20price $299,000
-
2023-11-17$309,000 Active
-
2023-04-03status Under Contract
-
2023-03-22soldstatus Closed
-
2023-02-22$289,000 Active
-
2022-03-09historical
-
2022-03-08status Under Contract
-
2022-03-03soldstatus Closed
-
2022-03-03price $1,799,920
-
2022-02-03$224,990 Active
-
2021-12-10soldstatus
ⓘ Source: listings_history table (triggers on properties + properties_extension) + one-shot
backfill from property_details.listing_events for pre-trigger history.
Tax reassessment forecast UT · Resets to sale price
- Current annual tax
- $6,341 · $528/mo
- Projected year-2 tax
- $6,341 · $528/mo
- Expected delta
- $0/yr ($0/mo · 0.0%)
ⓘ Screening estimate from a state-policy table — verify with the county assessor before closing.
Climate risk First Street
- Flood 1/10 Low FEMA zone X (unshaded) · 0% chance over 30 yrs
- Wildfire 6/10 Major
- Heat 7/10 Severe 5 d/yr ≥103°F today · 14 d/yr by 30 yrs out
- Wind 1/10 Low
- Air quality 1/10 Low 0 unhealthy d/yr today · 0 by 30 yrs out
Nearby sold comps map
Loading sold comps map…
Walkable amenities ~0.75 mi
Loading nearby amenities…
Taxation est. · year 1
- Rental income
- $25,085
- − Mortgage interest
- −$14,844
- − Property taxes
- −$6,341
- − Insurance
- −$1,325
- − Repairs & maintenance
- −$2,007
- − Management
- −$2,007
- − Depreciation
- −$7,709
- Taxable loss
- −$9,148
- Est. tax savings @ 24.0%
- +$2,195
- After-tax cash flow
- $-2,329/yr
For passive investors: Depreciation is non-cash, so a rental often shows a tax loss while cash-flowing — sheltering income. Rental losses are passive: they offset passive income freely, and up to $25,000/yr can offset ordinary (W-2) income if you actively participate and your MAGI is under $100k (phasing out to $0 by $150k); unused losses carry forward. On sale, claimed depreciation is recaptured at up to 25%, and gains may owe capital-gains tax (a 1031 exchange can defer both). Figures are a year-1 estimate at your 24.0% rate — not tax advice; consult a CPA.
Schools (NCES district)
- District
- Washington District
- NCES district ID
- 4901140
- Math proficiency
- 42% ▼ -3.00%
- Reading proficiency
- 45% ▼ -3.00%
- Median HH income
- $50,861
- Composite
- 37.47/100
- National rank
- #4408
- State rank
- #37 of 80 in UT
Livability — St. George
No livability data for this city. (Only ~50 U.S. cities are tracked.)
Census & demographics
- Census place
- St. George, UT
- County
- Washington County · 179,216 people
- City population
- 101,579
- Metro
- St. George, UT
- Population (ZIP)
- 55,892
- Household income
- $91,054
- Rent vs Own
- Severe rent burden
- 1359.0
Population outlook (Washington County) Hauer SSP2
- Today (2025)
- 193,324 people
- By 2030
- 211,699 · +9.5%
- By 2040
- 246,449 · +27.5%
- By 2050
- 278,447 · +44.0%
- By 2075
- 342,734 · +77.3%
- By 2100
- 382,815 · +98.0%
Race, ethnicity, and origin ACS 2023
- Neighborhood character
- Predominantly White (83%)
- Race & ethnicity
- White 83% Hispanic / Latino 11% Two or more races 7% Native American 1%
- Hispanic origin (detail)
- Mexican 7%
- Common ancestry
- Slovak 5% Italian 2% Portuguese 2%
- Foreign-born
- 6% · Canada, Dominican Republic
- Languages at home
- 89% English-only · Spanish 8% Other Asian/Pacific 1%
Political lean MEDSL · Washington
- 2024 margin
- Solid R (+52.3) · D 23.0% · R 75.2% · Other 1.8%
- 2008→2024 swing
- +1.2pp toward D · 2008: -53.5pp · 2024: -52.3pp
- All cycles
- 2024: R+52.3 2020: R+51.7 2016: R+52.1 2012: R+67.0 2008: R+53.5
Not yet ingested
- Civics
- —
Market trends
- HPI YoY
- ▼ -210.13%
- Current HPI
- 218.2317
- Rent YoY
- ▲ 0.20%
- Metro
- St. George, UT
- State GDP YoY
- ▲ 3.54%
- F500 in state
- 2
Industry mix (Fortune 500 HQ in UT)
| Industry | F500 HQs | Revenue |
|---|---|---|
| Financial Services | 1 | $3B |
|
||
Price history
+17.8% since first listed22 events — show timeline
- 2025-07-28 Listed $265,000 WFRMLS
- 2025-07-21 Listed $265,000 WCBOR
- 2025-07-20 Listing Removed — WFRMLS
- 2025-01-30 Price Changed $265,000 WCBOR
- 2025-01-30 Price Changed $265,000 WFRMLS
- 2024-11-18 Price Changed $269,000 WFRMLS
- 2024-11-18 Price Changed $269,000 WCBOR
- 2024-09-04 Price Changed $298,999 WCBOR
- 2024-09-04 Price Changed $289,999 WFRMLS
- 2024-07-19 Listed $310,000 WFRMLS
- 2024-06-05 Listing Removed — WFRMLS
- 2024-02-20 Price Changed $299,000 WFRMLS
- 2023-11-17 Listed $309,000 WFRMLS
- 2023-04-03 Pending — WFRMLS
- 2023-03-22 Sold (MLS) — WFRMLS
- 2023-02-22 Listed $289,000 WFRMLS
- 2022-03-09 Listing Removed — WFRMLS
- 2022-03-08 Pending — WFRMLS
- 2022-03-03 Price Changed $1,799,920 WFRMLS
- 2022-03-03 Sold (MLS) — WFRMLS
- 2022-02-03 Listed $224,990 WFRMLS
- 2021-12-10 Sold (Public Records) — Public Records
Property tax history
+23.7%/yrLatest (2025): $6,341 · +0.1% YoY. Source: county tax records.
Cash-flow waterfall
monthlySold comps — $/sqft
last 12 mo · ≤1 miLoading sold comps…