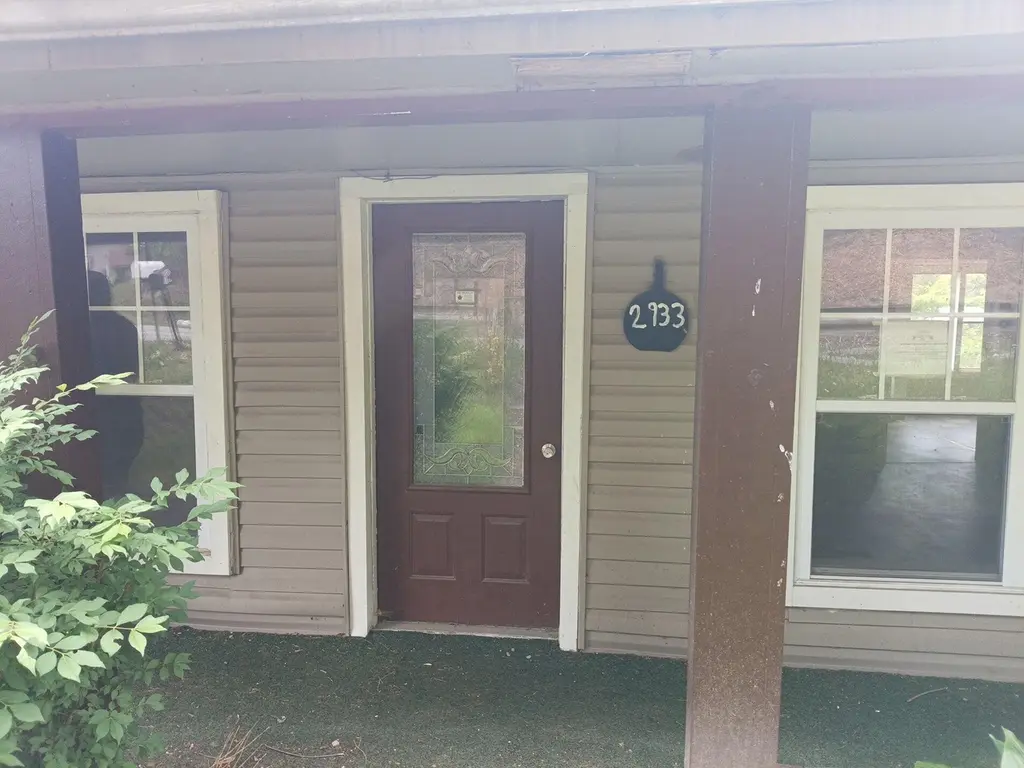
2933 KY Route-1092 · Paintsville, KY
Flood risk 10/10 · Severe
- FEMA flood zone
- X (unshaded)
- Chance of flooding over 30 yrs
- 0.99%
- Est. flood insurance / yr
- $507 – $1,088
Fire risk 8/10 · Major
- Est. fire insurance / yr
- $839 – $1,559
Heat risk 4/10 · Minor
- Hot days now (above 102°F)
- 7 days/yr
- Hot days in 30 yrs
- 19 days/yr
Wind risk 2/10 · Minimal
- Chance of severe wind over 30 yrs
- 2.0%
Air-quality risk 1/10 · Minimal
- Unhealthy air days now
- 0 days/yr
- Unhealthy air days in 30 yrs
- 0 days/yr
Risk factors via First Street. Map © Google.
Why this score? — see what drove the B grade
The composite is a weighted blend of 9 inputs, each scored 0–100. Each bar is that input's sub-score; the figure is the points it added to the 100-point composite (weight × sub-score).
- Cash flow +30.0/30.0
- 1% rule +10.0/10.0
- DSCR +10.0/10.0
- ARV discount +7.5/15.0
- Livability +3.7/5.0
- Rent growth +2.5/5.0
- Schools +2.5/10.0
- Condition / age +2.5/5.0
- Appreciation +2.0/10.0
$50,000
🖨 Deal sheet 📄 Offer letter ✓ Due diligence
Listing remarks
Great opportunity in rural Flat Gap, KY! Situated on approximately half an acre, this property is ready for someone with vision to bring it back to life. Whether you're an investor or a buyer looking to create your own space, this fixer-upper offers solid potential in a peaceful country setting.
Key facts
- Fixer-upper
- 0.5 acre lot
- Built 1960
Tags
Property features AI
Finance
- Other: Property listed by Dream Maker Realty, LLC
Exterior
- Utilities: Public water; Septic tank sewer
- Home design: Single-story house
- Construction: Vinyl siding; Metal roof; Block and pillar/post/pier foundation; Approximately 960 building square feet
- Exterior features: Few trees on the lot; Half-acre lot (approx. 0.5 acre)
Interior
- Bathrooms: 1 full bathroom
- Interior features: 5 total rooms; No fireplace
Neighborhood map
What this means for you Summary
Snapshot
- This is a 3-bed/1.0-bath single-family listed at $50k.
Deal economics
- At list price, monthly cash flow is $310 ($4k/yr) — positive.
- The deal already cash-flows at list — no discount required.
- Meets the 1% rule at list price ($914 rent vs $50k).
- Recommended offer: $48k (3.0% below list) — sets the bar for market timing.
- Cap rate 15.3% vs local median 3.2% in Paintsville — top-decile yield for the area; either an underpriced asset or a hidden risk that comps aren't pricing in. Stress-test before assuming the spread holds.
Location & tenants
- Location reads 73/100 on livability (#117 in KY) — a middle-class / working-renter tenant base. Strengths: crime A+, cost of living A+, health & safety A+; Watch: amenities F, commute F, employment F.
- Johnson County (rural): math 23% / reading 39% proficiency, ranked #103 of 165 in KY (top 62%) — families likely to look elsewhere, expect single-tenant / working-renter base with shorter leases.
- Zoned schools: Flat Gap Elementary School (math 32% / reading 42%, grade F, #255 of 676 statewide, top 42%, 205 students, 74% FRL); Johnson County Middle School (math 25% / reading 49%, grade F, #80 of 217 statewide, top 41%, 475 students, 61% FRL).
- Market conditions: 10 active listings in the ZIP.
Forward outlook
- Local home prices are declining (-3.0%/yr); year-one equity from $346 of loan paydown is wiped out by about $2k of value loss. Plan a longer hold.
- Johnson County population projected at -18% by 2050 — secular population decline; favor cash flow + early exit over multi-decade hold.
- At projected returns (-3.0% appreciation + 3.0% rent growth), your $14k cash investment doubles in ~5 years — after that, you're playing with house money.
Negotiation context
- It's been on market 43 days — a 3% lower offer ($48k) is reasonable based on typical stale-listing flexibility.
- Current owner paid $16k; list at $50k implies a 212% gain — meaningful room to come down on a strong offer.
Risks & watch-outs
- Watch-outs: flood insurance adds $66/mo.
- Climate carrying-cost: severe flood risk; severe wildfire risk — expect insurance premiums to compound above CPI over the hold.
Questions for the listing agent
- It's been on market 43 days. Have you received any prior offers? Is the seller open to a 3% concession, seller financing, or rate buy-down credit?
- Built in 1960 — when were the roof, HVAC, electrical panel, plumbing, and water heater last replaced?
- What's the actual annual flood-insurance premium (NFIP or private), and is the property in a SFHA with mandatory coverage?
- Is there a deadline driving the sale (1031 exchange, divorce, estate, relocation)? That informs how much negotiation room exists.
- Schools are B-rated — typically a magnet for longer-tenancy family renters. What's the average tenant stay here, and is there a school-zone premium baked into asking?
- What's the average days-on-market for RENTAL listings here right now (not sales)? A rising rental-DOM trend means longer vacancies and softer asking-rent achievability than the comps imply.
- What's the recent tenant-quality profile in this submarket — average credit score on applications, eviction rate, late-payment / NSF rate, and stable-employment percentage? A property-management company in the area should have these aggregated.
- How much new for-sale + rental construction is in the pipeline within 1–3 miles? Heavy new supply typically softens prices + rents 12–24 months out; constrained supply supports both.
Investment metrics
- 1% rule
- 1.83% ✓
- Cap rate
- 15.33%
- Cash-on-cash
- 32.27%
- DSCR
- 2.44
- GRM
- 4.6
CMA / ARV
No comps found within radius.
Projected returns pro-forma
-3.0% appreciation · 3.0% rent growth · sell at horizon
- IRR
- 20.5%
- Equity multiple
- 1.84×
- Total profit
- $11,695
- Equity at exit
- $7,455
- IRR
- 28.7%
- Equity multiple
- 3.56×
- Total profit
- $35,827
- Equity at exit
- $4,323
Cash invested: $14,000 (down + closing). Projections, not guarantees.
Landlord ↔ Tenant lean methodology
- Overall (STATE)
- 83 Strongly Landlord-Friendly
- State Kentucky
- 83 Strongly Landlord-Friendly · R+16
- County
- — inherits STATE
- City
- — inherits STATE
ZIP-level market 41219
- Home prices YoY
- -2.6%
- Active inventory
- 10
- Price-to-rent
- 4.6×
Monthly cashflow live
- Estimated rent
- $914 medium interval (Pro) →
- Mortgage (P&I)
- −$262
- Tax est. 1.5%
- −$62 /mo · $750/yr
- Insurance
- −$21
- Flood insurance flood zone
- −$66 /mo · $798/yr
- HOA
- −$0
- Vacancy / Maint / Mgmt
- −$192
- Net cashflow
- $310
Break-even live
UW: 25.0% down · 7.5% · 30yr · 1.5% tax · 5.0% vac · 8.0% maint · 8.0% mgmt
Financing live
Cash to close
- Down payment
- $12,500
- Closing costs
- $1,500
- Reserves months
- —
- Total cash needed
- —
Loan-product check · same deal, 3 products live
Conventional
25% down · 7.5% · 30yr
- Down + closing
- —
- Monthly P&I
- —
- Monthly cashflow
- —
- DSCR
- —
- Eligible?
- —
Personal DTI + credit; lowest rate.
DSCR
20% down · 8.5% · 30yr
- Down + closing
- —
- Monthly P&I
- —
- Monthly cashflow
- —
- DSCR
- —
- Eligible?
- —
No personal income docs; deal must DSCR.
Hard money
10% down · 12.0% · 12mo
- Down + closing
- —
- Monthly P&I
- —
- Monthly cashflow
- —
- DSCR
- —
- Eligible?
- —
Short-term bridge; refi at stabilization.
Listing history 18 events
-
2026-06-18days on market $50,000 Active 43 DOM
-
2026-06-17price $50,000 Active 42 DOM
-
2026-06-17days on market $55,000 Active 42 DOM
-
2026-06-16days on market $55,000 Active 41 DOM
-
2026-06-15days on market $55,000 Active 40 DOM
-
2026-06-13days on market $55,000 Active 38 DOM
-
2026-06-12days on market $55,000 Active 37 DOM
-
2026-06-09days on market $55,000 Active 34 DOM
-
2026-06-08days on market $55,000 Active 33 DOM
-
2026-06-07days on market $55,000 Active 32 DOM
-
2026-06-04days on market $55,000 Active 28 DOM
-
2026-06-02days on market $55,000 Active 27 DOM
-
2026-06-01days on market $55,000 Active 26 DOM
-
2026-05-31days on market $55,000 Active 25 DOM
-
2026-05-31days on market $55,000 Active 24 DOM
-
2026-05-18price $55,000
-
2026-04-28$60,000 Active
-
1994-03-01soldstatus $16,000
ⓘ Source: listings_history table (triggers on properties + properties_extension) + one-shot
backfill from property_details.listing_events for pre-trigger history.
Climate risk First Street
- Flood 10/10 Extreme FEMA zone X (unshaded) · 99% chance over 30 yrs
- Wildfire 8/10 Severe
- Heat 4/10 Moderate 7 d/yr ≥102°F today · 19 d/yr by 30 yrs out
- Wind 2/10 Low 2% chance of damaging wind over 30 yrs
- Air quality 1/10 Low 0 unhealthy d/yr today · 0 by 30 yrs out
Nearby sold comps map
Loading sold comps map…
Walkable amenities ~0.75 mi
Loading nearby amenities…
Taxation est. · year 1
- Rental income
- $10,967
- − Mortgage interest
- −$2,801
- − Property taxes
- −$750
- − Insurance
- −$1,048
- − Repairs & maintenance
- −$877
- − Management
- −$877
- − Depreciation
- −$1,455
- Taxable income
- $3,159
- Est. tax owed @ 24.0%
- −$758
- After-tax cash flow
- $2,962/yr
For passive investors: Depreciation is non-cash, so a rental often shows a tax loss while cash-flowing — sheltering income. Rental losses are passive: they offset passive income freely, and up to $25,000/yr can offset ordinary (W-2) income if you actively participate and your MAGI is under $100k (phasing out to $0 by $150k); unused losses carry forward. On sale, claimed depreciation is recaptured at up to 25%, and gains may owe capital-gains tax (a 1031 exchange can defer both). Figures are a year-1 estimate at your 24.0% rate — not tax advice; consult a CPA.
Schools (NCES district)
- District
- Johnson County
- NCES district ID
- 2103060
- Math proficiency
- 23% ▼ -26.00%
- Reading proficiency
- 39% ▼ -23.00%
- Median HH income
- $34,508
- Composite
- 25.49/100
- National rank
- #7441
- State rank
- #103 of 165 in KY
Livability — Paintsville
- Score
- 73/100
- State rank
- #117
- US rank
- #5546
Category grades
Schools grade is shown separately in the Schools card above.
Census & demographics
- City population
- 6,495
- Population (ZIP)
- 1,818
Population outlook (Johnson County) Hauer SSP2
- Today (2025)
- 22,330 people
- By 2030
- 21,570 · -3.4%
- By 2040
- 19,849 · -11.1%
- By 2050
- 18,204 · -18.5%
- By 2075
- 14,588 · -34.7%
- By 2100
- 11,127 · -50.2%
Race, ethnicity, and origin ACS 2023
- Neighborhood character
- Predominantly White (98%)
- Race & ethnicity
- White 98% Two or more races 2%
- Common ancestry
- Slovak 8% Serbian 1%
Political lean MEDSL · Johnson
- 2024 margin
- Solid R (+70.7) · D 14.0% · R 84.7% · Other 1.3%
- 2008→2024 swing
- -29.1pp toward R · 2008: -41.6pp · 2024: -70.7pp
- All cycles
- 2024: R+70.7 2020: R+67.1 2016: R+71.0 2012: R+59.5 2008: R+41.6
Not yet ingested
- Civics
- —
Market trends
- HPI YoY
- ▼ -6.01%
- Current HPI
- 227.4256
- Rent YoY
- —
- Metro
- —
- State GDP YoY
- ▲ 1.81%
- F500 in state
- 4
Industry mix (Fortune 500 HQ in KY)
| Industry | F500 HQs | Revenue |
|---|---|---|
| Healthcare | 1 | $118B |
|
||
| Food / Beverage | 1 | $7B |
|
||
Price history
+243.8% since first listed3 events — show timeline
- 2026-05-18 Price Changed $55,000 ImagineMLS
- 2026-04-28 Listed $60,000 ImagineMLS
- 1994-03-01 Sold (Public Records) $16,000 Public Records
Cash-flow waterfall
monthlySold comps — $/sqft
last 12 mo · ≤1 miLoading sold comps…