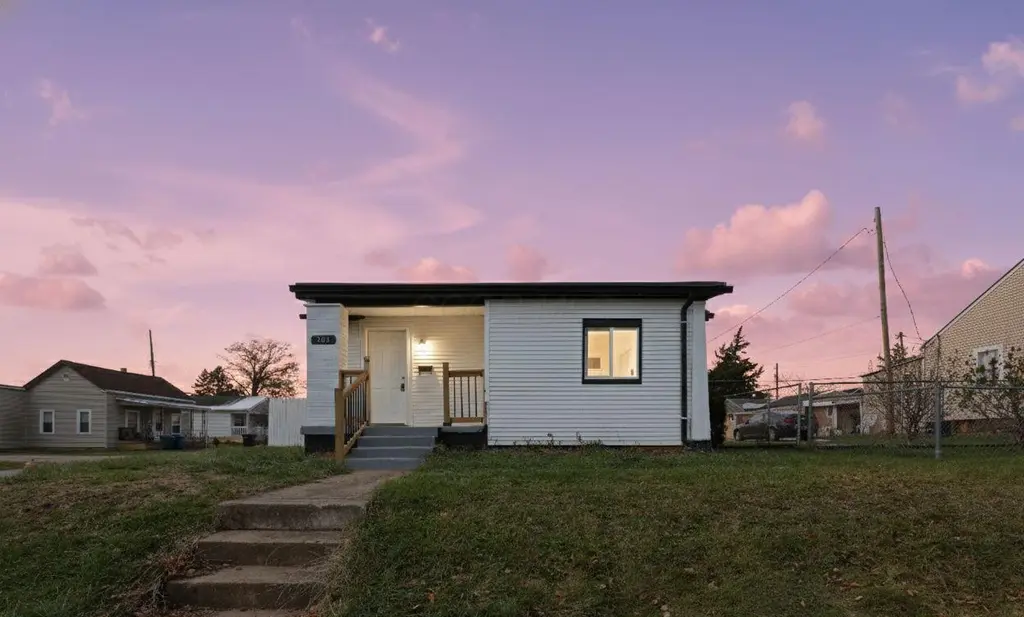
509 Helen St · Columbus, OH
Flood risk 1/10 · Minimal
- FEMA flood zone
- X (unshaded)
- Chance of flooding over 30 yrs
- 0.0%
- Est. flood insurance / yr
- $507 – $1,088
Fire risk 1/10 · Minimal
- Est. fire insurance / yr
- $713 – $1,323
Heat risk 4/10 · Minor
- Hot days now (above 100°F)
- 7 days/yr
- Hot days in 30 yrs
- 18 days/yr
Wind risk 2/10 · Minimal
- Chance of severe wind over 30 yrs
- 1.0%
Air-quality risk 3/10 · Minor
- Unhealthy air days now
- 2 days/yr
- Unhealthy air days in 30 yrs
- 3 days/yr
Risk factors via First Street. Map © Google.
Why this score? — see what drove the C- grade
The composite is a weighted blend of 9 inputs, each scored 0–100. Each bar is that input's sub-score; the figure is the points it added to the 100-point composite (weight × sub-score).
- Cash flow +16.5/30.0
- ARV discount +14.6/15.0
- DSCR +5.1/10.0
- Livability +4.0/5.0
- 1% rule +3.9/10.0
- Rent growth +3.7/5.0
- Condition / age +2.5/5.0
- Schools +1.7/10.0
- Appreciation +0.0/10.0
$139,800
🖨 Deal sheet 📄 Offer letter ✓ Due diligence
Listing remarks MLS
Excellent Investment Opportunity for the right buyer! Just recently vacated, the bones are good and ready for you to remodel. Comps in the area are $150k to $175k so this would make a great flip opportunity or a excellent rental with rent rates in the area at around $1200 a month. In need of TLC, this home would be perfect for supplemental income! 2 Bed, 1 Bath, original hardwood flooring, basement and decent sized yard with a fenced in backyard. Call your agent to come take a look today!
Key facts
- Great storage
- Close to restaurants
- Daily conveniences
Tags
Neighborhood map
What this means for you Summary
Snapshot
- This is a 2-bed/1.0-bath single-family listed at $140k.
Deal economics
- At list price, monthly cash flow is $83 ($996/yr) — positive.
- The deal already cash-flows at list — no discount required.
- To meet the 1% rule (rent ≥ 1% of price), the offer needs to be $124k (11.5% below list).
- Recommended offer: $124k (11.5% below list) — sets the bar for 1% rule.
- Cap rate 7.0% vs local median 3.8% in Columbus — top-decile yield for the area; either an underpriced asset or a hidden risk that comps aren't pricing in. Stress-test before assuming the spread holds.
Location & tenants
- Location reads 81/100 on livability (#97 in OH, #1,491 nationally) — a professional / high-income tenant draw. Strengths: commute A+, cost of living A+, housing A+; Watch: employment C-, crime F.
- Columbus City School District (urban): math 15% / reading 26% proficiency, ranked #626 of 656 in OH (top 95%) — low school quality limits family demand, transient renter base, plan for 1-2y turnover; 72% free/reduced lunch — lower-income household profile, screen leases tightly.
- Market conditions: Rents rising fast (+4.6%/yr); 144 active listings in the ZIP; 40 comparable units currently listed for rent nearby; rentals lingering (median 44d on market — plan ~5-8 weeks vacancy on turnover, expect pricing pressure); 50% of comp listings sitting > 30 days — soft ceiling on asking rent; 8,139 units permitted in Franklin County in 2024 (5,940 in 5+ unit buildings).
- This rent runs 32% of the median local income ($47k/yr) — at the standard rent-burdened threshold; future hikes will face affordability resistance.
Forward outlook
- Local home prices are declining (-3.0%/yr); year-one equity from $967 of loan paydown is wiped out by about $4k of value loss. Plan a longer hold.
- Franklin County population projected at +34% by 2050 — long-run rental-demand tailwind backs the buy-and-hold thesis.
Negotiation context
- Only 1 days on market — expect competitive offers; lowballing is unlikely to land.
- 4 sale attempts since 21y ago; this cycle's ask has dropped $25k (15%) from the opening price — seller is motivated, your offer sets the floor, not the list.
- Current owner paid $80k; list at $140k implies a 75% gain — meaningful room to come down on a strong offer.
Risks & watch-outs
- Watch-outs: built in 1927 — expect roof / HVAC / electrical / plumbing capex.
Questions for the listing agent
- Built in 1927 — when were the roof, HVAC, electrical panel, plumbing, and water heater last replaced?
- Is there a deadline driving the sale (1031 exchange, divorce, estate, relocation)? That informs how much negotiation room exists.
- Crime grade is F in this area — have there been break-ins, vandalism, or insurance claims at this property in the last 3 years? What carrier currently insures it and at what premium?
- What's the average days-on-market for RENTAL listings here right now (not sales)? A rising rental-DOM trend means longer vacancies and softer asking-rent achievability than the comps imply.
- What's the recent tenant-quality profile in this submarket — average credit score on applications, eviction rate, late-payment / NSF rate, and stable-employment percentage? A property-management company in the area should have these aggregated.
- How much new for-sale + rental construction is in the pipeline within 1–3 miles? Heavy new supply typically softens prices + rents 12–24 months out; constrained supply supports both.
Investment metrics
- 1% rule
- 0.89% ✗
- Cap rate
- 7.01%
- Cash-on-cash
- 2.55%
- DSCR
- 1.11
- GRM
- 9.4
CMA / ARV
- ARV (median comp)
- $165,939
- List price
- $139,800
- Delta
- -15.75%
- Verdict
- UNDERPRICED
- Comps
- 20 within 1.0 mi
Show comp detail 12 sales within ~0.75 mi
| Address | Dist | Beds/Ba | Sqft | Sold | Price | $/sf | Match |
|---|---|---|---|---|---|---|---|
| 436 Catherine St | 0.12mi | 2/1.0 | 960 (+6%) | 3mo | $65,000 | $68 | 82 |
| 1476 Thomas Ave | 0.30mi | 2/1.0 | 978 (+8%) | 3mo | $150,000 | $153 | 71 |
| 1819 Ransburg Ave | 0.61mi | 3/1.0 (+1) | 900 (-1%) | 1mo | $150,000 | $167 | 64 |
| 635 Clark Ave | 0.34mi | 2/1.0 | 997 (+10%) | 4mo | $172,500 | $173 | 64 |
| 1849 Ransburg Ave | 0.61mi | 2/1.0 | 900 (-1%) | 9mo | $187,000 | $208 | 63 |
| 510 Belvidere Ave | 0.54mi | 2/1.0 | 820 (-10%) | 2mo | $124,900 | $152 | 57 |
| 299 Whitethorne Ave | 0.73mi | 2/1.0 | 959 (+6%) | 2mo | $65,000 | $68 | 55 |
| 1958 W Mound St | 0.45mi | 3/1.0 (+1) | 844 (-7%) | 11mo | $160,000 | $190 | 53 |
| 151 Columbian Ave | 0.59mi | 3/1.0 (+1) | 1,012 (+12%) | 2mo | $146,500 | $145 | 47 |
| 1617 Ransburg Ave | 0.71mi | 3/1.0 (+1) | 825 (-9%) | 2mo | $200,000 | $242 | 45 |
| 509 Belvidere Ave | 0.57mi | 3/2.0 (+1) | 990 (+9%) | 6mo | $192,500 | $194 | 44 |
| 1860 Rosemont Ave | 0.71mi | 1/2.0 (-1) | 930 (+2%) | 11mo | $135,000 | $145 | 44 |
Match score weights: distance 35% · size 25% · config 20% · recency 20%. Top-matched comps best support the ARV.
Projected returns pro-forma
-3.0% appreciation · 4.61% rent growth · sell at horizon
- IRR
- -10.6%
- Equity multiple
- 0.61×
- Total profit
- $-15,354
- Equity at exit
- $20,845
- IRR
- 0.7%
- Equity multiple
- 1.05×
- Total profit
- $1,973
- Equity at exit
- $12,087
Cash invested: $39,144 (down + closing). Projections, not guarantees.
Landlord ↔ Tenant lean methodology
- Overall (STATE)
- 73 Landlord-Friendly
- State Ohio
- 73 Landlord-Friendly · R+6
- County
- — inherits STATE
- City
- — inherits STATE
ZIP-level market 43223
- Rents YoY
- 4.6%
- Active inventory
- 144
- Price-to-rent
- 9.4×
Monthly cashflow live
- Estimated rent
- $1,237 high interval (Pro) →
- Mortgage (P&I)
- −$733
- Tax from tax record
- −$103 /mo · $1,238/yr
- Insurance
- −$58
- HOA
- −$0
- Vacancy / Maint / Mgmt
- −$260
- Net cashflow
- $83
Break-even live
UW: 25.0% down · 7.5% · 30yr · 1.5% tax · 5.0% vac · 8.0% maint · 8.0% mgmt
Financing live
Cash to close
- Down payment
- $34,950
- Closing costs
- $4,194
- Reserves months
- —
- Total cash needed
- —
Loan-product check · same deal, 3 products live
Conventional
25% down · 7.5% · 30yr
- Down + closing
- —
- Monthly P&I
- —
- Monthly cashflow
- —
- DSCR
- —
- Eligible?
- —
Personal DTI + credit; lowest rate.
DSCR
20% down · 8.5% · 30yr
- Down + closing
- —
- Monthly P&I
- —
- Monthly cashflow
- —
- DSCR
- —
- Eligible?
- —
No personal income docs; deal must DSCR.
Hard money
10% down · 12.0% · 12mo
- Down + closing
- —
- Monthly P&I
- —
- Monthly cashflow
- —
- DSCR
- —
- Eligible?
- —
Short-term bridge; refi at stabilization.
Rent comps 40 comps
| Address | Beds | Baths | Sqft | Rent | $/sqft | DOM | Units | Dist |
|---|---|---|---|---|---|---|---|---|
| 490 Helen St Columbus, OH | 2.0 | 1.0 | 840 | $1,200 | $1.43 | 43d | 1 | 0.01mi |
| 436 Catherine St Columbus, OH | 2.0 | 1.5 | 960 | $1,300 | $1.35 | 7d | 1 | 0.08mi |
| 432 Catherine St Columbus, OH | 3.0 | 1.0 | 1073 | $1,325 | $1.23 | 14d | 1 | 0.09mi |
| 432 Catherine St Columbus, OH | 3.0 | 1.0 | 1073 | $1,325 | $1.23 | 12d | 1 | 0.09mi |
| 1485 Walsh Ave Columbus, OH | 2.0 | 1.0 | 720 | $1,450 | $2.01 | 23d | 1 | 0.26mi |
| 1773 W Mound St Unit 1803 Columbus, OH | 1.0 | 1.0 | 700 | $925 | $1.32 | 43d | 1 | 0.29mi |
| 1773 W Mound St Unit 1799 Columbus, OH | 1.0 | 1.0 | 700 | $900 | $1.29 | 43d | 1 | 0.29mi |
| 287 S Central Ave Unit 285 Columbus, OH | 1.0 | 1.0 | 704 | $870 | $1.24 | 17d | 1 | 0.45mi |
| 1928-1930 Vaughn St Unit 1928 Columbus, OH | 2.0 | 1.0 | 919 | $957 | $1.04 | 43d | 1 | 0.50mi |
| 190 Nashoba Ave Columbus, OH | 2.0 | 1.0 | 1030 | $1,450 | $1.41 | 19d | 1 | 0.56mi |
| 190 Nashoba Ave Columbus, OH | 2.0 | 1.0 | 1030 | $1,450 | $1.41 | 12d | 1 | 0.56mi |
| 1287 Sullivant Ave Unit 3 Columbus, OH | 2.0 | 1.0 | 650 | $1,250 | $1.92 | 23d | 1 | 0.57mi |
| 1287 Sullivant Ave Unit 1 Columbus, OH | 2.0 | 1.0 | 650 | $1,200 | $1.85 | 23d | 1 | 0.57mi |
| 108 Columbian Ave Unit B Columbus, OH | 2.0 | 1.0 | 820 | $900 | $1.10 | 7d | 1 | 0.60mi |
| 120 S Central Ave Columbus, OH | 1.0–3.0 | 1.0–2.0 | 944 | $912 | $0.97 | 14d | 12 | 0.66mi |
| 142 Dana Ave Unit 142 Columbus, OH | 2.0 | 1.0 | 700 | $825 | $1.18 | 43d | 1 | 0.70mi |
| 411 S Yale Ave Columbus, OH | 2.0 | 1.0 | 784 | $1,425 | $1.82 | 43d | 1 | 0.72mi |
| 87-89 Dana Ave Columbus, OH | 2.0 | 1.0 | 948 | $1,100 | $1.16 | 21d | 1 | 0.74mi |
| 2174 Sullivant Ave Columbus, OH | 1.0 | 1.0 | 800 | $775 | $0.97 | 43d | 1 | 0.75mi |
| 791-793 Butler Ave Unit 791 Columbus, OH | 3.0 | 1.0 | 1000 | $1,395 | $1.40 | 3d | 1 | 0.75mi |
| 2203 Clarendon Ln Unit 2203 Columbus, OH | 2.0 | 1.0 | 835 | $1,000 | $1.20 | 12d | 1 | 0.77mi |
| 1963 W Broad St Apt 8 Columbus, OH | 1.0 | 1.0 | 600 | $820 | $1.37 | 23d | 1 | 0.78mi |
| 2157 W Mound St Unit C Columbus, OH | 2.0 | 1.0 | 825 | $900 | $1.09 | 43d | 1 | 0.81mi |
| 2167 W Mound St Unit C Columbus, OH | 2.0 | 1.0 | 825 | $900 | $1.09 | 43d | 1 | 0.83mi |
| 85 Stevens Ave Columbus, OH | 2.0 | 1.0 | 816 | $995 | $1.22 | 43d | 1 | 0.84mi |
| 2173 W Mound St Unit A Columbus, OH | 2.0 | 1.0 | 825 | $900 | $1.09 | 43d | 1 | 0.85mi |
| 257 Clarendon Ave Unit 257,259,261,263 Columbus, OH | 2.0 | 1.0 | 1000 | $1,200 | $1.20 | 43d | 1 | 0.87mi |
| 73 Hayden Ave Columbus, OH | 2.0 | 1.0 | 894 | $1,350 | $1.51 | 7d | 1 | 0.91mi |
| 100 N Central Ave Columbus, OH | 2.0 | 1.0 | 932 | $1,043 | $1.12 | 43d | 1 | 0.92mi |
| 185 S Cypress Ave Columbus, OH | 2.0 | 1.0 | 1104 | $1,695 | $1.54 | 43d | 1 | 0.94mi |
| 664 S Wheatland Ave Unit 1 Columbus, OH | 1.0 | 1.0 | 700 | $895 | $1.28 | 12d | 1 | 0.96mi |
| 1137 W Broad St Columbus, OH | 1.0–2.0 | 1.0 | 770 | $1,860 | $2.42 | 43d | 1 | 0.98mi |
| 170 S Highland Ave Columbus, OH | 2.0 | 1.0 | 950 | $895 | $0.94 | 43d | 1 | 0.99mi |
| 163 N Central Ave Columbus, OH | 2.0 | 2.5 | 1100 | $1,650 | $1.50 | 43d | 1 | 0.99mi |
| 685 S Wheatland Ave Columbus, OH | 1.0 | 1.0 | 640 | $850 | $1.33 | 43d | 1 | 1.00mi |
| 735 Canonby Pl Apt B Columbus, OH | 3.0 | 1.5 | 950 | $1,095 | $1.15 | 19d | 1 | 1.06mi |
| 548 S Wayne Ave Columbus, OH | 3.0 | 1.0 | 1008 | $1,225 | $1.22 | 19d | 1 | 1.07mi |
| 731 Canonby Pl Unit B Columbus, OH | 3.0 | 1.5 | 950 | $1,095 | $1.15 | 43d | 1 | 1.09mi |
| 717 Canonby Pl Unit B Columbus, OH | 3.0 | 1.5 | 950 | $1,095 | $1.15 | 43d | 1 | 1.09mi |
| 1475 Stimmel Rd Columbus, OH | 1.0–4.0 | 1.0 | 868 | $1,205 | $1.39 | 16d | 1 | 1.10mi |
Listing history 31 events
-
2026-06-19days on market $139,800 Active 1 DOM
-
2026-06-09days on market $139,800 Active 170 DOM
-
2026-06-08days on market $139,800 Active 169 DOM
-
2026-06-07days on market $139,800 Active 168 DOM
-
2026-06-05days on market $139,800 Active 165 DOM
-
2026-06-03days on market $139,800 Active 164 DOM
-
2026-06-02days on market $139,800 Active 163 DOM
-
2026-06-01days on market $139,800 Active 162 DOM
-
2026-05-31statusdays on market $139,800 Active 161 DOM
-
2026-05-19historical
-
2026-04-28status Active
-
2026-03-24historical Contingent
-
2026-03-13price $139,800
-
2026-02-12price $140,800
-
2026-02-05price $142,800
-
2026-01-30price $143,800
-
2026-01-22price $144,800
-
2026-01-16price $149,800
-
2026-01-10price $152,900
-
2026-01-03price $154,900
-
2025-12-27price $160,900
-
2025-12-21price $162,900
-
2025-12-10$164,900 Active
-
2024-11-21soldstatus $80,000 Closed 493-char remark
Show marketing remark (493 chars)
Excellent Investment Opportunity for the right buyer! Just recently vacated, the bones are good and ready for you to remodel. Comps in the area are $150k to $175k so this would make a great flip opportunity or a excellent rental with rent rates in the area at around $1200 a month. In need of TLC, this home would be perfect for supplemental income! 2 Bed, 1 Bath, original hardwood flooring, basement and decent sized yard with a fenced in backyard. Call your agent to come take a look today!
-
2024-10-05historical Contingent Finance and Inspection 493-char remark
Show marketing remark (493 chars)
Excellent Investment Opportunity for the right buyer! Just recently vacated, the bones are good and ready for you to remodel. Comps in the area are $150k to $175k so this would make a great flip opportunity or a excellent rental with rent rates in the area at around $1200 a month. In need of TLC, this home would be perfect for supplemental income! 2 Bed, 1 Bath, original hardwood flooring, basement and decent sized yard with a fenced in backyard. Call your agent to come take a look today!
-
2024-09-27$89,888 Active 493-char remark
Show marketing remark (493 chars)
Excellent Investment Opportunity for the right buyer! Just recently vacated, the bones are good and ready for you to remodel. Comps in the area are $150k to $175k so this would make a great flip opportunity or a excellent rental with rent rates in the area at around $1200 a month. In need of TLC, this home would be perfect for supplemental income! 2 Bed, 1 Bath, original hardwood flooring, basement and decent sized yard with a fenced in backyard. Call your agent to come take a look today!
-
2024-09-26historical $89,888 493-char remark
Show marketing remark (493 chars)
Excellent Investment Opportunity for the right buyer! Just recently vacated, the bones are good and ready for you to remodel. Comps in the area are $150k to $175k so this would make a great flip opportunity or a excellent rental with rent rates in the area at around $1200 a month. In need of TLC, this home would be perfect for supplemental income! 2 Bed, 1 Bath, original hardwood flooring, basement and decent sized yard with a fenced in backyard. Call your agent to come take a look today!
-
2005-09-15soldstatus $27,500
-
2005-08-02historical
-
2005-01-14$25,600
-
1991-09-03soldstatus $37,500
ⓘ Source: listings_history table (triggers on properties + properties_extension) + one-shot
backfill from property_details.listing_events for pre-trigger history.
Tax reassessment forecast OH · Partial reset (capped growth)
- Current annual tax
- $1,238 · $103/mo
- Projected year-2 tax
- $1,710 · $142/mo
- Expected delta
- +$471/yr (+$39/mo · 38.1%)
ⓘ Screening estimate from a state-policy table — verify with the county assessor before closing.
Climate risk First Street
- Flood 1/10 Low FEMA zone X (unshaded) · 0% chance over 30 yrs
- Wildfire 1/10 Low
- Heat 4/10 Moderate 7 d/yr ≥100°F today · 18 d/yr by 30 yrs out
- Wind 2/10 Low 100% chance of damaging wind over 30 yrs
- Air quality 3/10 Moderate 2 unhealthy d/yr today · 3 by 30 yrs out
Nearby sold comps map
Loading sold comps map…
Walkable amenities ~0.75 mi
Loading nearby amenities…
Taxation est. · year 1
- Rental income
- $14,850
- − Mortgage interest
- −$7,831
- − Property taxes
- −$1,238
- − Insurance
- −$699
- − Repairs & maintenance
- −$1,188
- − Management
- −$1,188
- − Depreciation
- −$4,067
- Taxable loss
- −$1,362
- Est. tax savings @ 24.0%
- +$327
- After-tax cash flow
- $1,323/yr
For passive investors: Depreciation is non-cash, so a rental often shows a tax loss while cash-flowing — sheltering income. Rental losses are passive: they offset passive income freely, and up to $25,000/yr can offset ordinary (W-2) income if you actively participate and your MAGI is under $100k (phasing out to $0 by $150k); unused losses carry forward. On sale, claimed depreciation is recaptured at up to 25%, and gains may owe capital-gains tax (a 1031 exchange can defer both). Figures are a year-1 estimate at your 24.0% rate — not tax advice; consult a CPA.
Schools (NCES district)
- District
- Columbus City School District
- NCES district ID
- 3904380
- Math proficiency
- 15% ▼ -17.00%
- Reading proficiency
- 26% ▼ -12.00%
- Median HH income
- $38,483
- Composite
- 17.19/100
- National rank
- #9105
- State rank
- #626 of 656 in OH
Livability — Columbus
- Score
- 81/100
- State rank
- #97
- US rank
- #1491
Category grades
Schools grade is shown separately in the Schools card above.
Census & demographics
- Census place
- Columbus, OH
- County
- Franklin County · 1,351,780 people
- City population
- 612,189
- Metro
- Columbus, OH
- Population (ZIP)
- 28,187
- Household income
- $46,911
- Rent vs Own
- Severe rent burden
- 1689.0
Population outlook (Franklin County) Hauer SSP2
- Today (2025)
- 1,456,139 people
- By 2030
- 1,556,890 · +6.9%
- By 2040
- 1,757,349 · +20.7%
- By 2050
- 1,950,539 · +34.0%
- By 2075
- 2,376,171 · +63.2%
- By 2100
- 2,636,796 · +81.1%
Race, ethnicity, and origin ACS 2023
- Neighborhood character
- Diverse neighborhood (Simpson 0.55)
- Race & ethnicity
- White 63% Black 22% Two or more races 8% Hispanic / Latino 8%
- Hispanic origin (detail)
- Mexican 4% Puerto Rican 3%
- Common ancestry
- Romanian 4% Italian 1% Slovak 1%
- Foreign-born
- 5% · Canada
- Languages at home
- 91% English-only · Spanish 5%
Political lean MEDSL · Franklin
- 2024 margin
- Strong D (+28.4) · D 63.7% · R 35.3% · Other 1.0%
- 2008→2024 swing
- +7.7pp toward D · 2008: 20.7pp · 2024: 28.4pp
- All cycles
- 2024: D+28.4 2020: D+31.4 2016: D+25.9 2012: D+21.7 2008: D+20.7
Not yet ingested
- Civics
- —
Market trends
- HPI YoY
- ▼ -135.33%
- Current HPI
- 211.6742
- Rent YoY
- ▲ 4.61%
- Metro
- Columbus, OH
- State GDP YoY
- ▲ 1.98%
- F500 in state
- 48
Industry mix (Fortune 500 HQ in OH)
| Industry | F500 HQs | Revenue |
|---|---|---|
| Insurance | 3 | $145B |
|
||
| Industrial Machinery | 3 | $49B |
|
||
| Financial Services | 3 | $24B |
|
||
| Consumer Goods | 2 | $93B |
|
||
| Aerospace / Defense | 2 | $47B |
|
||
| Utilities | 2 | $33B |
|
||
Price history
+272.8% since first listed22 events — show timeline
- 2026-05-19 Listing Removed — CBRMLS
- 2026-04-28 Relisted — CBRMLS
- 2026-03-24 Contingent — CBRMLS
- 2026-03-13 Price Changed $139,800 CBRMLS
- 2026-02-12 Price Changed $140,800 CBRMLS
- 2026-02-05 Price Changed $142,800 CBRMLS
- 2026-01-30 Price Changed $143,800 CBRMLS
- 2026-01-22 Price Changed $144,800 CBRMLS
- 2026-01-16 Price Changed $149,800 CBRMLS
- 2026-01-10 Price Changed $152,900 CBRMLS
- 2026-01-03 Price Changed $154,900 CBRMLS
- 2025-12-27 Price Changed $160,900 CBRMLS
- 2025-12-21 Price Changed $162,900 CBRMLS
- 2025-12-10 Listed $164,900 CBRMLS
- 2024-11-21 Sold (MLS) $80,000 CBRMLS
- 2024-10-05 Contingent — CBRMLS
- 2024-09-27 Listed $89,888 CBRMLS
- 2024-09-26 Coming Soon $89,888 CBRMLS
- 2005-09-15 Sold (MLS) $27,500 CBRMLS
- 2005-08-02 Listing Removed — CBRMLS
- 2005-01-14 Listed $25,600 CBRMLS
- 1991-09-03 Sold (Public Records) $37,500 Public Records
Property tax history
-2.8%/yrLatest (2024): $1,238 · -25.1% YoY. Source: county tax records.
Cash-flow waterfall
monthlySold comps — $/sqft
last 12 mo · ≤1 miLoading sold comps…