 🏗️ New Construction
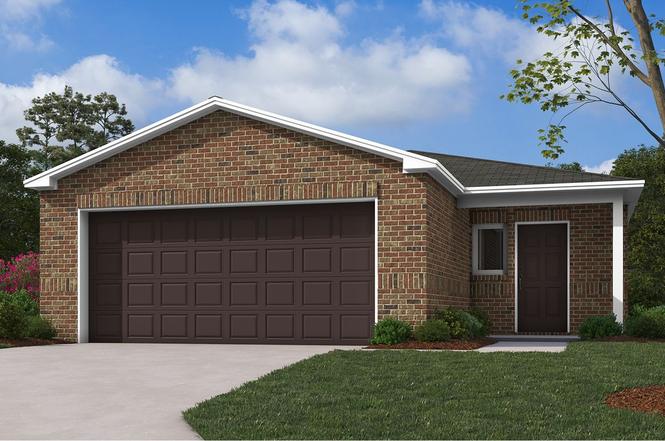
Rc Keswick Plan · Ward, AR
Flood risk No data
- FEMA flood zone
- —
- Chance of flooding over 30 yrs
- —
- Est. flood insurance / yr
- —
Fire risk No data
- Est. fire insurance / yr
- —
Heat risk No data
- Hot days now (above threshold)
- —
- Hot days in 30 yrs
- —
Wind risk No data
- Chance of severe wind over 30 yrs
- —
Air-quality risk No data
- Unhealthy air days now
- —
- Unhealthy air days in 30 yrs
- —
Risk factors via First Street. Map © Google.
Why this score? — see what drove the D+ grade
The composite is a weighted blend of 9 inputs, each scored 0–100. Each bar is that input's sub-score; the figure is the points it added to the 100-point composite (weight × sub-score).
- Cash flow +13.4/30.0
- Appreciation +7.7/10.0
- ARV discount +7.5/15.0
- DSCR +4.1/10.0
- Schools +4.0/10.0
- 1% rule +3.8/10.0
- Livability +3.5/5.0
- Rent growth +2.5/5.0
- Condition / age +2.5/5.0
$188,900
🖨 Deal sheet 📄 Offer letter ✓ Due diligence
Listing remarks
This single-story home is designed for modern lifestyles. A spacious and flexible open-concept layout combines the kitchen, living and dining areas to maximize interior space. One bedroom is tucked away to the side, with two additional bedrooms located at the back of the home, including the lavish owner's suite with a full bathroom and walk-in closet.
Key facts
- 2 garage spots
- Listed 307 days
Tags
Property features AI
Finance
- Other: Address listed as 11 Deerfield Dr, Ward AR 72176; Status: Active; Inventory type: Plan
- Financial info: List price $188,900
Exterior
- Parking: 2 garage spaces; 2 total parking spaces
- Home design: Single-family plan home; Located in Ward, AR
- Exterior features: Living area approximately 1,051
Interior
- Bedrooms: 3 bedrooms
- Bathrooms: 2 full bathrooms
- Interior features: Plan home (Rc Keswick)
Neighborhood map
What this means for you Summary
Snapshot
- This is a 3-bed/2.0-bath single-family listed at $189k.
Deal economics
- At list price, monthly cash flow is $4 ($52/yr) — positive.
- To cash-flow at today's rent, offer at most $164k (13.4% below list).
- To meet the 1% rule (rent ≥ 1% of price), the offer needs to be $143k (24.3% below list).
- Recommended offer: $143k (24.3% below list) — sets the bar for 1% rule.
- Cap rate 6.3% vs local median 4.9% in Ward — meaningfully above typical; check what's discounted (condition, days-on-market, listing class) to confirm the premium yield is real.
Location & tenants
- Location reads 69/100 on livability (#66 in AR) — a middle-class / working-renter tenant base. Strengths: cost of living A+, housing A+, crime B; Watch: amenities F, commute F.
- Cabot School District (suburban): math 48% / reading 43% proficiency, ranked #29 of 238 in AR (top 12%) — families likely to look elsewhere, expect single-tenant / working-renter base with shorter leases.
- Market conditions: 147 active listings in the ZIP; 14 comparable units currently listed for rent nearby; rentals at typical pace (median 23d on market — plan ~3-4 weeks tenant-placement turnaround); 185 units permitted in Lonoke County in 2024 (0 in 5+ unit buildings).
Forward outlook
- In year one you build about $10k of equity ($1k loan paydown + $9k appreciation (5.3% local appreciation)).
- Lonoke County population projected at +12% by 2050 — modest demand growth; plan on rents tracking national, not racing it.
- At projected returns (5.3% appreciation + 3.0% rent growth), your $46k cash investment doubles in ~5 years — after that, you're playing with house money.
- By year 4, paydown + projected appreciation supports a ~$33k cash-out refi (75% LTV) — recoverable capital for the next deal without selling this one.
Negotiation context
- It's been on market 308 days — a 12% lower offer ($166k) is reasonable based on typical stale-listing flexibility.
Questions for the listing agent
- It's been on market 308 days. Have you received any prior offers? Is the seller open to a 24% concession, seller financing, or rate buy-down credit?
- Why hasn't it sold? Are there any deal-killer items the seller is aware of (foundation, flood, title, zoning, code violations)?
- Is there a deadline driving the sale (1031 exchange, divorce, estate, relocation)? That informs how much negotiation room exists.
- The area grade is low — what's the realistic commute time and amenity access for the typical tenant pool here? Any planned neighborhood developments (good or bad) we should know about?
- What's the average days-on-market for RENTAL listings here right now (not sales)? A rising rental-DOM trend means longer vacancies and softer asking-rent achievability than the comps imply.
- What's the recent tenant-quality profile in this submarket — average credit score on applications, eviction rate, late-payment / NSF rate, and stable-employment percentage? A property-management company in the area should have these aggregated.
- How much new for-sale + rental construction is in the pipeline within 1–3 miles? Heavy new supply typically softens prices + rents 12–24 months out; constrained supply supports both.
Investment metrics
- 1% rule
- 0.88% ✗
- Cap rate
- 6.32%
- Cash-on-cash
- 0.11%
- DSCR
- 1.01
- GRM
- 9.5
CMA / ARV
- ARV (on-the-fly)
- $162,905
- Comps found
- 12
Show comp detail 12 sales within ~0.75 mi
| Address | Dist | Beds/Ba | Sqft | Sold | Price | $/sf | Match |
|---|---|---|---|---|---|---|---|
| 39 Remington Ln | 0.26mi | 3/2.0 | 1,051 (0%) | 5mo | $173,900 | $165 | 84 |
| 43 Ten Point Ln | 0.29mi | 3/2.0 | 1,051 (0%) | 6mo | $172,900 | $165 | 81 |
| 13 Ten Point Ln | 0.26mi | 3/2.0 | 1,143 (+9%) | 1mo | $181,000 | $158 | 73 |
| 22 Buckshot Dr | 0.30mi | 3/2.0 | 1,143 (+9%) | 2mo | $176,950 | $155 | 69 |
| 13 Ruger Cv | 0.35mi | 3/2.0 | 1,143 (+9%) | 4mo | $175,200 | $153 | 66 |
| 24 Green Apple Dr | 0.38mi | 3/2.0 | 1,139 (+8%) | 9mo | $180,000 | $158 | 61 |
| 23 Ariel Dr | 0.71mi | 3/2.0 | 1,083 (+3%) | 7mo | $152,800 | $141 | 56 |
| 1615 Moon | 0.73mi | 3/2.0 | 1,036 (-1%) | 11mo | $117,000 | $113 | 55 |
| 17 Chantileer Ln | 0.39mi | 3/2.0 | 1,196 (+14%) | 9mo | $185,000 | $155 | 51 |
| 25 Windwood Cv Cv | 0.64mi | 3/2.0 | 1,147 (+9%) | 5mo | $169,999 | $148 | 51 |
| 38 Weatherwood Ln | 0.60mi | 3/2.0 | 1,199 (+14%) | 10mo | $177,000 | $148 | 40 |
| 3 Sunrise Ln | 0.73mi | 3/2.0 | 1,198 (+14%) | 4mo | $189,900 | $159 | 39 |
Match score weights: distance 35% · size 25% · config 20% · recency 20%. Top-matched comps best support the ARV.
Projected returns pro-forma
5.35% appreciation · 3.0% rent growth · sell at horizon
- IRR
- 13.9%
- Equity multiple
- 1.90×
- Total profit
- $41,160
- Equity at exit
- $95,845
- IRR
- 14.5%
- Equity multiple
- 3.69×
- Total profit
- $122,777
- Equity at exit
- $168,409
Cash invested: $45,613 (down + closing). Projections, not guarantees.
Landlord ↔ Tenant lean methodology
- Overall (STATE)
- 92 Strongly Landlord-Friendly
- State Arkansas
- 92 Strongly Landlord-Friendly · R+14
- County
- — inherits STATE
- City
- — inherits STATE
ZIP-level market 72176
- Home prices YoY
- 2.6%
- Active inventory
- 147
- Price-to-rent
- 11.0×
Monthly cashflow live
- Estimated rent
- $1,431 high interval (Pro) →
- Mortgage (P&I)
- −$854
- Tax est. 1.5%
- −$204 /mo · $2,444/yr
- Insurance
- −$68
- HOA
- −$0
- Vacancy / Maint / Mgmt
- −$300
- Net cashflow
- $4
Break-even live
UW: 25.0% down · 7.5% · 30yr · 1.5% tax · 5.0% vac · 8.0% maint · 8.0% mgmt
Financing live
Cash to close
- Down payment
- $40,726
- Closing costs
- $4,887
- Reserves months
- —
- Total cash needed
- —
Loan-product check · same deal, 3 products live
Conventional
25% down · 7.5% · 30yr
- Down + closing
- —
- Monthly P&I
- —
- Monthly cashflow
- —
- DSCR
- —
- Eligible?
- —
Personal DTI + credit; lowest rate.
DSCR
20% down · 8.5% · 30yr
- Down + closing
- —
- Monthly P&I
- —
- Monthly cashflow
- —
- DSCR
- —
- Eligible?
- —
No personal income docs; deal must DSCR.
Hard money
10% down · 12.0% · 12mo
- Down + closing
- —
- Monthly P&I
- —
- Monthly cashflow
- —
- DSCR
- —
- Eligible?
- —
Short-term bridge; refi at stabilization.
Rent comps 14 comps
| Address | Beds | Baths | Sqft | Rent | $/sqft | DOM | Units | Dist |
|---|---|---|---|---|---|---|---|---|
| 23 Green Apple Ward, AR | 3.0 | 2.0 | 1212 | $1,450 | $1.20 | 23d | 1 | 0.36mi |
| 29 Green Apple Ward, AR | 3.0 | 2.0 | 1200 | $1,450 | $1.21 | 18d | 1 | 0.40mi |
| 21 Windsor Park Dr Ward, AR | 3.0 | 2.0 | 1442 | $1,500 | $1.04 | 23d | 1 | 0.50mi |
| 21 Weatherwood Ward, AR | 3.0 | 2.0 | 1156 | $1,300 | $1.12 | 23d | 1 | 0.69mi |
| 33 Langford St Ward, AR | 3.0 | 2.0 | 1175 | $1,300 | $1.11 | 23d | 1 | 0.75mi |
| 12 Gold Meadows Loop Ward, AR | 3.0 | 2.0 | 1484 | $1,300 | $0.88 | 23d | 1 | 0.76mi |
| 65 Birchwood Dr Ward, AR | 3.0 | 2.0 | 1302 | $1,650 | $1.27 | 21d | 1 | 0.86mi |
| 14 Stephens St Ward, AR | 3.0 | 2.0 | 1128 | $1,395 | $1.24 | 43d | 1 | 0.88mi |
| 21 Kasidyann Ct Ward, AR | 4.0 | 2.0 | 1415 | $1,795 | $1.27 | 23d | 1 | 0.98mi |
| 201 4th St Unit 223 Ward, AR | 2.0 | 1.0 | 815 | $700 | $0.86 | 14d | 1 | 1.15mi |
| 404 Scott St Ward, AR | 3.0 | 2.0 | 1195 | $1,195 | $1.00 | 18d | 1 | 1.19mi |
| 561 Brewer St Ward, AR | 3.0 | 2.0 | 1050 | $1,450 | $1.38 | 44d | 1 | 1.25mi |
| 307 Washington St Ward, AR | 2.0 | 1.0 | 870 | $775 | $0.89 | 23d | 1 | 1.27mi |
| 21 Lariat Dr Austin, AR | 4.0 | 2.0 | 1483 | $1,650 | $1.11 | 14d | 1 | 1.43mi |
Listing history 15 events
-
2026-06-18days on market $188,900 Active 308 DOM
-
2026-06-17days on market $188,900 Active 307 DOM
-
2026-06-16days on market $188,900 Active 306 DOM
-
2026-06-15days on market $188,900 Active 305 DOM
-
2026-06-14days on market $188,900 Active 303 DOM
-
2026-06-10days on market $188,900 Active 300 DOM
-
2026-06-09days on market $188,900 Active 299 DOM
-
2026-06-08days on market $188,900 Active 298 DOM
-
2026-06-07days on market $188,900 Active 297 DOM
-
2026-06-05days on market $188,900 Active 294 DOM
-
2026-06-03days on market $188,900 Active 293 DOM
-
2026-06-02days on market $188,900 Active 292 DOM
-
2026-06-01days on market $188,900 Active 291 DOM
-
2026-05-31days on market $188,900 Active 290 DOM
-
2026-05-31days on market $188,900 Active 289 DOM
ⓘ Source: listings_history table (triggers on properties + properties_extension) + one-shot
backfill from property_details.listing_events for pre-trigger history.
Nearby sold comps map
Loading sold comps map…
Walkable amenities ~0.75 mi
Loading nearby amenities…
Taxation est. · year 1
- Rental income
- $17,166
- − Mortgage interest
- −$9,125
- − Property taxes
- −$2,444
- − Insurance
- −$815
- − Repairs & maintenance
- −$1,373
- − Management
- −$1,373
- − Depreciation
- −$4,739
- Taxable loss
- −$2,703
- Est. tax savings @ 24.0%
- +$649
- After-tax cash flow
- $700/yr
For passive investors: Depreciation is non-cash, so a rental often shows a tax loss while cash-flowing — sheltering income. Rental losses are passive: they offset passive income freely, and up to $25,000/yr can offset ordinary (W-2) income if you actively participate and your MAGI is under $100k (phasing out to $0 by $150k); unused losses carry forward. On sale, claimed depreciation is recaptured at up to 25%, and gains may owe capital-gains tax (a 1031 exchange can defer both). Figures are a year-1 estimate at your 24.0% rate — not tax advice; consult a CPA.
Schools (NCES district)
- District
- Cabot School District
- NCES district ID
- 0503750
- Math proficiency
- 48% ▼ -14.00%
- Reading proficiency
- 43% ▼ -10.00%
- Median HH income
- $55,993
- Composite
- 39.66/100
- National rank
- #3912
- State rank
- #29 of 238 in AR
Livability — Ward
- Score
- 69/100
- State rank
- #66
- US rank
- #8464
Category grades
Schools grade is shown separately in the Schools card above.
Census & demographics
- Census place
- Ward, AR
- County
- Lonoke County · 46,130 people
- City population
- 8,678
- Metro
- Little Rock-North Little Rock-Conway, AR
- Population (ZIP)
- 8,678
- Household income
- $68,840
- Rent vs Own
- Severe rent burden
- 90.0
Population outlook (Lonoke County) Hauer SSP2
- Today (2025)
- 78,072 people
- By 2030
- 80,673 · +3.3%
- By 2040
- 84,977 · +8.8%
- By 2050
- 87,778 · +12.4%
- By 2075
- 91,398 · +17.1%
- By 2100
- 87,858 · +12.5%
Race, ethnicity, and origin ACS 2023
- Neighborhood character
- Predominantly White (85%)
- Race & ethnicity
- White 85% Two or more races 7% Hispanic / Latino 6% Black 2% Asian 1%
- Hispanic origin (detail)
- Mexican 2%
- Common ancestry
- Russian 2% Iranian 1% Slovak 1%
- Foreign-born
- 2% · Canada
- Languages at home
- 95% English-only · Spanish 3% Tagalog/Filipino 1% German/W. Germanic 1%
Political lean MEDSL · Lonoke
- 2024 margin
- Solid R (+53.7) · D 22.2% · R 75.8% · Other 2.0%
- 2008→2024 swing
- -6.2pp toward R · 2008: -47.5pp · 2024: -53.7pp
- All cycles
- 2024: R+53.7 2020: R+52.8 2016: R+53.3 2012: R+50.9 2008: R+47.5
Not yet ingested
- Civics
- —
Market trends
- HPI YoY
- ▲ 5.35%
- Current HPI
- 208.9387
- Rent YoY
- —
- Metro
- Little Rock-North Little Rock-Conway, AR
- State GDP YoY
- ▲ 3.80%
- F500 in state
- 10
Industry mix (Fortune 500 HQ in AR)
| Industry | F500 HQs | Revenue |
|---|---|---|
| Retail | 1 | $681B |
|
||
| Food / Agriculture | 1 | $53B |
|
||
| Retail / Energy | 1 | $22B |
|
||
| Transportation / Logistics | 1 | $12B |
|
||
| Energy | 1 | $4B |
|
||
Cash-flow waterfall
monthlySold comps — $/sqft
last 12 mo · ≤1 miLoading sold comps…