 Multi-family
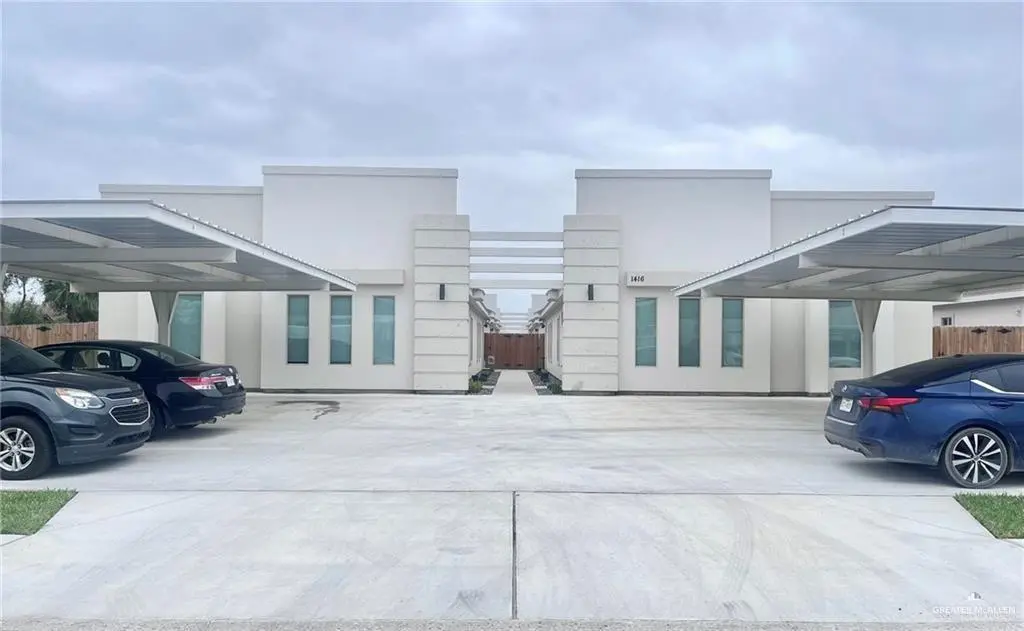
1416 Vani Dr · Weslaco, TX
Flood risk 4/10 · Minor
- FEMA flood zone
- —
- Chance of flooding over 30 yrs
- 0.22%
- Est. flood insurance / yr
- —
Fire risk 2/10 · Minimal
- Est. fire insurance / yr
- $1,222 – $2,270
Heat risk 9/10 · Severe
- Hot days now (above 111°F)
- 6 days/yr
- Hot days in 30 yrs
- 18 days/yr
Wind risk 8/10 · Major
- Chance of severe wind over 30 yrs
- 99.0%
Air-quality risk 1/10 · Minimal
- Unhealthy air days now
- 0 days/yr
- Unhealthy air days in 30 yrs
- 0 days/yr
Risk factors via First Street. Map © Google.
Why this score? — see what drove the D+ grade
The composite is a weighted blend of 9 inputs, each scored 0–100. Each bar is that input's sub-score; the figure is the points it added to the 100-point composite (weight × sub-score).
- Cash flow +16.2/30.0
- ARV discount +11.4/15.0
- DSCR +5.0/10.0
- 1% rule +4.5/10.0
- Condition / age +4.0/5.0
- Livability +3.6/5.0
- Rent growth +2.5/5.0
- Schools +2.2/10.0
- Appreciation +0.3/10.0
$449,000
🖨 Deal sheet 📄 Offer letter ✓ Due diligence
Multi-family units
County records classify this as Multi-Family (2-4 Unit). Listing-text estimate: 1 unit. estimate disagrees with records
Listing remarks MLS
FULLY LEASED Multi Family in Prime Location minutes away from Expressway 83!Exceptional investment opportunity in a desirable subdivision with top schools, shopping,and dining.These fourplexes offer modern design, strong tenant appeal,and immediate cash flow.Each unit features a bright open-concept layout with elegant wood-look tile flooring, a contemporary kitchen with custom cabinetry,quartz countertops,and a spacious island providing ample storage and workspace.Bedrooms are generously sized with large closets,and the primary suites include a luxurious frameless glass shower and walk-in closet.Additional highlights include private fenced backyards for every unit,stainless steel appliances,in-unit washer and dryer, and covered carports.This is an outstanding opportunity for investors seeking a low-maintenance,high-demand rental asset in a rapidly growing area.Don’t miss your chance to own a premium multi-family property with long-term value and impressive rental potential.
Key facts
- Custom cabinetry
- Spacious island
- Contemporary kitchen
Tags
Neighborhood map
What this means for you Summary
Snapshot
- This is a multifamily listed at $449k. Condition is rated good.
Deal economics
- At list price, monthly cash flow is $237 ($3k/yr) — positive.
- The deal already cash-flows at list — no discount required.
- To meet the 1% rule (rent ≥ 1% of price), the offer needs to be $428k (4.7% below list).
- Recommended offer: $395k (12.0% below list) — sets the bar for market timing.
- Cap rate 6.9% vs local median 4.1% in Weslaco — top-decile yield for the area; either an underpriced asset or a hidden risk that comps aren't pricing in. Stress-test before assuming the spread holds.
Location & tenants
- Location reads 72/100 on livability (#277 in TX) — a middle-class / working-renter tenant base. Strengths: cost of living A+, housing A+, health & safety A+; Watch: employment D+, crime F, amenities F.
- Weslaco ISD (suburban): math 23% / reading 31% proficiency, ranked #705 of 826 in TX (top 85%) — low school quality limits family demand, transient renter base, plan for 1-2y turnover.
- Market conditions: 231 active listings in the ZIP; 7,378 units permitted in Hidalgo County in 2024 (641 in 5+ unit buildings).
Forward outlook
- Local home prices are declining (-3.0%/yr); year-one equity from $3k of loan paydown is wiped out by about $13k of value loss. Plan a longer hold.
- Hidalgo County population projected at +28% by 2050 — long-run rental-demand tailwind backs the buy-and-hold thesis.
Negotiation context
- It's been on market 185 days — a 12% lower offer ($395k) is reasonable based on typical stale-listing flexibility.
- 2 sale attempts since 3y ago with the ask held roughly flat each time — persistent listings suggest the price (not the market) is what's stuck; bring a comps-based counter.
Risks & watch-outs
- Climate carrying-cost: severe wind risk, 99% chance of damaging wind over 30y; extreme-heat days projected 6→18/yr by 2055 (HVAC capex compounding) — expect insurance premiums to compound above CPI over the hold.
Questions for the listing agent
- It's been on market 185 days. Have you received any prior offers? Is the seller open to a 12% concession, seller financing, or rate buy-down credit?
- What does the HOA fee cover, when was the last increase, and are there any pending special assessments or reserve-fund shortfalls?
- Why hasn't it sold? Are there any deal-killer items the seller is aware of (foundation, flood, title, zoning, code violations)?
- Is there a deadline driving the sale (1031 exchange, divorce, estate, relocation)? That informs how much negotiation room exists.
- Crime grade is F in this area — have there been break-ins, vandalism, or insurance claims at this property in the last 3 years? What carrier currently insures it and at what premium?
- The area grade is low — what's the realistic commute time and amenity access for the typical tenant pool here? Any planned neighborhood developments (good or bad) we should know about?
- What's the average days-on-market for RENTAL listings here right now (not sales)? A rising rental-DOM trend means longer vacancies and softer asking-rent achievability than the comps imply.
- What's the recent tenant-quality profile in this submarket — average credit score on applications, eviction rate, late-payment / NSF rate, and stable-employment percentage? A property-management company in the area should have these aggregated.
- How much new apartment / multifamily construction is in the pipeline within 1–3 miles? Heavy new supply (>2% of stock underway) typically softens rents 12–24 months out; light construction supports rent growth.
Investment metrics
- 1% rule
- 0.95% ✗
- Cap rate
- 6.93%
- Cash-on-cash
- 2.26%
- DSCR
- 1.10
- GRM
- 8.7
CMA / ARV
- ARV (median comp)
- $491,085
- List price
- $449,000
- Delta
- -8.57%
- Verdict
- FAIR
- Comps
- 3 within 1.0 mi
Show comp detail 1 sale within ~0.75 mi
| Address | Dist | Beds/Ba | Sqft | Sold | Price | $/sf | Match |
|---|---|---|---|---|---|---|---|
| 1408 Vani Dr | 0.00mi | —/— | 3,988 (-2%) | 24mo | $505,000 | $127 | 78 |
Match score weights: distance 35% · size 25% · config 20% · recency 20%. Top-matched comps best support the ARV.
Projected returns pro-forma
-3.0% appreciation · 3.0% rent growth · sell at horizon
- IRR
- -12.7%
- Equity multiple
- 0.54×
- Total profit
- $-57,569
- Equity at exit
- $66,947
- IRR
- -3.6%
- Equity multiple
- 0.76×
- Total profit
- $-30,322
- Equity at exit
- $38,821
Cash invested: $125,720 (down + closing). Projections, not guarantees.
Landlord ↔ Tenant lean methodology
- Overall (STATE)
- 87 Strongly Landlord-Friendly
- State Texas
- 87 Strongly Landlord-Friendly · R+5
- County
- — inherits STATE
- City
- — inherits STATE
ZIP-level market 78599
- Home prices YoY
- -3.7%
- Active inventory
- 231
- Price-to-rent
- 35.0×
Monthly cashflow live
- Estimated rent
- $4,281 high interval (Pro) →
- Mortgage (P&I)
- −$2,355
- Tax est. 1.5%
- −$561 /mo · $6,735/yr
- Insurance
- −$187
- HOA
- −$42
- Vacancy / Maint / Mgmt
- −$899
- Net cashflow
- $237
Break-even live
4-unit breakdown (identical units grouped — click to expand)
| Units | Beds | Baths | Est. rent |
|---|---|---|---|
| 4× units | 2 | 2 | $4,280 |
| #1 | 2 | 2 | $1,070 |
| #2 | 2 | 2 | $1,070 |
| #3 | 2 | 2 | $1,070 |
| #4 | 2 | 2 | $1,070 |
| Total (4 units) | $4,281 | ||
UW: 25.0% down · 7.5% · 30yr · 1.5% tax · 5.0% vac · 8.0% maint · 8.0% mgmt
Financing live
Cash to close
- Down payment
- $112,250
- Closing costs
- $13,470
- Reserves months
- —
- Total cash needed
- —
Loan-product check · same deal, 3 products live
Conventional
25% down · 7.5% · 30yr
- Down + closing
- —
- Monthly P&I
- —
- Monthly cashflow
- —
- DSCR
- —
- Eligible?
- —
Personal DTI + credit; lowest rate.
DSCR
20% down · 8.5% · 30yr
- Down + closing
- —
- Monthly P&I
- —
- Monthly cashflow
- —
- DSCR
- —
- Eligible?
- —
No personal income docs; deal must DSCR.
Hard money
10% down · 12.0% · 12mo
- Down + closing
- —
- Monthly P&I
- —
- Monthly cashflow
- —
- DSCR
- —
- Eligible?
- —
Short-term bridge; refi at stabilization.
HOA detail
- Monthly dues
- $42 · $504/yr
Listing history 17 events
-
2026-06-18days on market $449,000 Active 185 DOM
-
2026-06-17days on market $449,000 Active 184 DOM
-
2026-06-16days on market $449,000 Active 183 DOM
-
2026-06-15days on market $449,000 Active 182 DOM
-
2026-06-15days on market $449,000 Active 181 DOM
-
2026-06-13days on market $449,000 Active 180 DOM
-
2026-06-12days on market $449,000 Active 179 DOM
-
2026-06-09days on market $449,000 Active 176 DOM
-
2026-06-08days on market $449,000 Active 175 DOM
-
2026-06-08days on market $449,000 Active 174 DOM
-
2026-06-07days on market $449,000 Active 173 DOM
-
2026-06-03days on market $449,000 Active 170 DOM
-
2026-06-02days on market $449,000 Active 169 DOM
-
2026-06-01days on market $449,000 Active 168 DOM
-
2026-05-31days on market $449,000 Active 167 DOM
-
2025-12-15$449,000 Active 994-char remark
Show marketing remark (994 chars)
FULLY LEASED Multi Family in Prime Location minutes away from Expressway 83!Exceptional investment opportunity in a desirable subdivision with top schools, shopping,and dining.These fourplexes offer modern design, strong tenant appeal,and immediate cash flow.Each unit features a bright open-concept layout with elegant wood-look tile flooring, a contemporary kitchen with custom cabinetry,quartz countertops,and a spacious island providing ample storage and workspace.Bedrooms are generously sized with large closets,and the primary suites include a luxurious frameless glass shower and walk-in closet.Additional highlights include private fenced backyards for every unit,stainless steel appliances,in-unit washer and dryer, and covered carports.This is an outstanding opportunity for investors seeking a low-maintenance,high-demand rental asset in a rapidly growing area.Don’t miss your chance to own a premium multi-family property with long-term value and impressive rental potential.
-
2023-12-01$485,000 Active
ⓘ Source: listings_history table (triggers on properties + properties_extension) + one-shot
backfill from property_details.listing_events for pre-trigger history.
Climate risk First Street
- Flood 4/10 Moderate 22% chance over 30 yrs
- Wildfire 2/10 Low
- Heat 9/10 Extreme 6 d/yr ≥111°F today · 18 d/yr by 30 yrs out
- Wind 8/10 Severe 99% chance of damaging wind over 30 yrs
- Air quality 1/10 Low 0 unhealthy d/yr today · 0 by 30 yrs out
Nearby sold comps map
Loading sold comps map…
Walkable amenities ~0.75 mi
Loading nearby amenities…
Taxation est. · year 1
- Rental income
- $51,372
- − Mortgage interest
- −$25,151
- − Property taxes
- −$6,735
- − Insurance
- −$2,245
- − Repairs & maintenance
- −$4,110
- − Management
- −$4,110
- − HOA
- −$504
- − Depreciation
- −$13,062
- Taxable loss
- −$4,544
- Est. tax savings @ 24.0%
- +$1,091
- After-tax cash flow
- $3,935/yr
For passive investors: Depreciation is non-cash, so a rental often shows a tax loss while cash-flowing — sheltering income. Rental losses are passive: they offset passive income freely, and up to $25,000/yr can offset ordinary (W-2) income if you actively participate and your MAGI is under $100k (phasing out to $0 by $150k); unused losses carry forward. On sale, claimed depreciation is recaptured at up to 25%, and gains may owe capital-gains tax (a 1031 exchange can defer both). Figures are a year-1 estimate at your 24.0% rate — not tax advice; consult a CPA.
Condition & rehab AI · 12 photos
This fully leased multi-family property in a prime location offers modern design and immediate cash flow. It is in good condition with minimal repairs needed, making it a solid investment opportunity.
Value-add opportunities
- Both Landscaping and curb appeal improvements — Enhances curb appeal and could attract more tenants.
- Both Addition of smart home features — Improves convenience and could attract tech-savvy tenants.
- Both Update kitchen appliances — Modernizes the kitchen and could attract more tenants.
- Both Paint interior walls — Fresh paint can make the home more appealing and easier to sell or rent.
Renovation cost estimate screening
Value-add ROI direction
- Both Landscaping and curb appeal improvements — Enhances curb appeal and could attract more tenants. ↑
- Both Addition of smart home features — Improves convenience and could attract tech-savvy tenants. ↑
- Both Update kitchen appliances — Modernizes the kitchen and could attract more tenants. ↑
- Both Paint interior walls — Fresh paint can make the home more appealing and easier to sell or rent. ↑
ⓘ Cost ranges are severity-bucket heuristics (US national rule-of-thumb). Get contractor quotes + a written scope before underwriting a rehab budget.
Schools (NCES district)
- District
- Weslaco ISD
- NCES district ID
- 4844960
- Math proficiency
- 23% ▼ -29.00%
- Reading proficiency
- 31% ▼ -9.00%
- Median HH income
- $32,867
- Composite
- 22.05/100
- National rank
- #8196
- State rank
- #705 of 826 in TX
Livability — Weslaco
- Score
- 72/100
- State rank
- #277
- US rank
- #6469
Category grades
Schools grade is shown separately in the Schools card above.
Census & demographics
- Census place
- Weslaco, TX
- Population (ZIP)
- 35,400
Population outlook (Hidalgo County) Hauer SSP2
- Today (2025)
- 955,232 people
- By 2030
- 1,009,774 · +5.7%
- By 2040
- 1,120,332 · +17.3%
- By 2050
- 1,225,036 · +28.2%
- By 2075
- 1,439,189 · +50.7%
- By 2100
- 1,533,429 · +60.5%
Race, ethnicity, and origin ACS 2023
- Neighborhood character
- Predominantly Hispanic (96%)
- Race & ethnicity
- Hispanic / Latino 96% Two or more races 42% White 2%
- Hispanic origin (detail)
- Mexican 90%
- Foreign-born
- 20% · Canada
- Languages at home
- 19% English-only · Spanish 80%
Political lean MEDSL · Hidalgo
- 2024 margin
- Toss-up / Even · D 48.1% · R 51.0%
- 2008→2024 swing
- -41.6pp toward R · 2008: 38.7pp · 2024: -2.9pp
- All cycles
- 2024: R+2.9 2020: D+17.1 2016: D+40.5 2012: D+41.8 2008: D+38.7
Not yet ingested
- Civics
- —
Market trends
- HPI YoY
- ▼ -9.47%
- Current HPI
- 243.5537
- Rent YoY
- —
- Metro
- —
- State GDP YoY
- ▲ 3.95%
- F500 in state
- 110
Industry mix (Fortune 500 HQ in TX)
| Industry | F500 HQs | Revenue |
|---|---|---|
| Energy | 16 | $1,198B |
|
||
| Technology | 5 | $198B |
|
||
| Engineering / Construction | 4 | $72B |
|
||
| Energy Services | 3 | $60B |
|
||
| Utilities | 3 | $41B |
|
||
| Healthcare | 2 | $330B |
|
||
Price history
-7.4% since first listed2 events — show timeline
- 2025-12-15 Listed $449,000 MCALLENMLS
- 2023-12-01 Listed $485,000 MCALLENMLS
Cash-flow waterfall
monthlySold comps — $/sqft
last 12 mo · ≤1 miLoading sold comps…