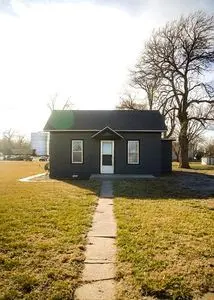
739 12th Ave · Fairmont, NE
Flood risk 1/10 · Minimal
- FEMA flood zone
- X (unshaded)
- Chance of flooding over 30 yrs
- 0.0%
- Est. flood insurance / yr
- $507 – $1,088
Fire risk 1/10 · Minimal
- Est. fire insurance / yr
- $1,161 – $2,155
Heat risk 3/10 · Minor
- Hot days now (above 103°F)
- 7 days/yr
- Hot days in 30 yrs
- 16 days/yr
Wind risk 2/10 · Minimal
- Chance of severe wind over 30 yrs
- —
Air-quality risk 2/10 · Minimal
- Unhealthy air days now
- 1 days/yr
- Unhealthy air days in 30 yrs
- 1 days/yr
Risk factors via First Street. Map © Google.
Why this score? — see what drove the B+ grade
The composite is a weighted blend of 9 inputs, each scored 0–100. Each bar is that input's sub-score; the figure is the points it added to the 100-point composite (weight × sub-score).
- Cash flow +30.0/30.0
- 1% rule +10.0/10.0
- DSCR +10.0/10.0
- Appreciation +9.2/10.0
- ARV discount +7.5/15.0
- Schools +4.7/10.0
- Livability +3.3/5.0
- Rent growth +2.5/5.0
- Condition / age +2.5/5.0
$55,000
🖨 Deal sheet 📄 Offer letter ✓ Due diligence
Listing remarks
Now available for sale a 3 bedroom (one nonconforming), one bath home with a great yard and peaceful neighborhood. Front room leads to dining area and kitchen. First bedroom is just off the living room, with both other bedrooms are off the dining room/kitchen. Off the kitchen is a mudroom / laundry area. Wood deck off back of house. All appliances are included. Furnace and water heater in cellar.
Key facts
- Mudroom laundry area
- Wood deck
- Built 1910
Tags
Neighborhood map
What this means for you Summary
Snapshot
- This is a 2-bed/1.0-bath single-family listed at $55k.
Deal economics
- At list price, monthly cash flow is $336 ($4k/yr) — positive.
- The deal already cash-flows at list — no discount required.
- Meets the 1% rule at list price ($861 rent vs $55k).
Location & tenants
- Location reads 66/100 on livability (#313 in NE) — a middle-class / working-renter tenant base. Strengths: cost of living A+, housing A+; Watch: health & safety C-, schools D+, amenities F.
- Fillmore Central Public Schools (rural): math 56% / reading 54% proficiency, ranked #41 of 111 in NE (top 37%) — acceptable for families but not a draw, mixed tenant base, ~2y average lease.
- Market conditions: 5 active listings in the ZIP; 10 units permitted in Fillmore County in 2024 (0 in 5+ unit buildings).
Forward outlook
- In year one you build about $5k of equity ($380 loan paydown + $5k appreciation (8.4% local appreciation)).
- Fillmore County population projected to shrink 6% by 2050 — rents likely to lag national; underwrite the cash flow, not the appreciation.
- At projected returns (8.4% appreciation + 3.0% rent growth), your $15k cash investment doubles in ~2 years — after that, you're playing with house money.
- By year 7, paydown + projected appreciation supports a ~$35k cash-out refi (75% LTV) — recoverable capital for the next deal without selling this one.
Negotiation context
- Only 1 days on market — expect competitive offers; lowballing is unlikely to land.
- Current owner paid $6k; list at $55k implies a 848% gain — meaningful room to come down on a strong offer.
Risks & watch-outs
- Watch-outs: built in 1910 — expect roof / HVAC / electrical / plumbing capex.
Questions for the listing agent
- Built in 1910 — when were the roof, HVAC, electrical panel, plumbing, and water heater last replaced?
- Is there a deadline driving the sale (1031 exchange, divorce, estate, relocation)? That informs how much negotiation room exists.
- Schools are D-rated, which usually means shorter tenancies and higher turnover. Who's the typical renter profile here, and what's been the actual vacancy rate?
- What's the average days-on-market for RENTAL listings here right now (not sales)? A rising rental-DOM trend means longer vacancies and softer asking-rent achievability than the comps imply.
- What's the recent tenant-quality profile in this submarket — average credit score on applications, eviction rate, late-payment / NSF rate, and stable-employment percentage? A property-management company in the area should have these aggregated.
- How much new for-sale + rental construction is in the pipeline within 1–3 miles? Heavy new supply typically softens prices + rents 12–24 months out; constrained supply supports both.
Investment metrics
- 1% rule
- 1.56% ✓
- Cap rate
- 13.63%
- Cash-on-cash
- 26.19%
- DSCR
- 2.17
- GRM
- 5.3
CMA / ARV
- ARV (on-the-fly)
- $135,723
- Comps found
- 1
Show comp detail 1 sale within ~0.75 mi
| Address | Dist | Beds/Ba | Sqft | Sold | Price | $/sf | Match |
|---|---|---|---|---|---|---|---|
| 506 8th Ave | 0.34mi | 2/1.0 | 944 (+12%) | 6mo | $152,000 | $161 | 60 |
Match score weights: distance 35% · size 25% · config 20% · recency 20%. Top-matched comps best support the ARV.
Projected returns pro-forma
8.41% appreciation · 3.0% rent growth · sell at horizon
- IRR
- 41.5%
- Equity multiple
- 3.95×
- Total profit
- $45,498
- Equity at exit
- $43,319
- IRR
- 36.8%
- Equity multiple
- 8.54×
- Total profit
- $116,177
- Equity at exit
- $87,493
Cash invested: $15,400 (down + closing). Projections, not guarantees.
Landlord ↔ Tenant lean methodology
- Overall (STATE)
- 83 Strongly Landlord-Friendly
- State Nebraska
- 83 Strongly Landlord-Friendly · R+13
- County
- — inherits STATE
- City
- — inherits STATE
ZIP-level market 68354
- Home prices YoY
- 4.3%
- Active inventory
- 5
- Price-to-rent
- 5.3×
Monthly cashflow live
- Estimated rent
- $861 medium interval (Pro) →
- Mortgage (P&I)
- −$288
- Tax from tax record
- −$32 /mo · $389/yr
- Insurance
- −$23
- HOA
- −$0
- Vacancy / Maint / Mgmt
- −$181
- Net cashflow
- $336
Break-even live
UW: 25.0% down · 7.5% · 30yr · 1.5% tax · 5.0% vac · 8.0% maint · 8.0% mgmt
Financing live
Cash to close
- Down payment
- $13,750
- Closing costs
- $1,650
- Reserves months
- —
- Total cash needed
- —
Loan-product check · same deal, 3 products live
Conventional
25% down · 7.5% · 30yr
- Down + closing
- —
- Monthly P&I
- —
- Monthly cashflow
- —
- DSCR
- —
- Eligible?
- —
Personal DTI + credit; lowest rate.
DSCR
20% down · 8.5% · 30yr
- Down + closing
- —
- Monthly P&I
- —
- Monthly cashflow
- —
- DSCR
- —
- Eligible?
- —
No personal income docs; deal must DSCR.
Hard money
10% down · 12.0% · 12mo
- Down + closing
- —
- Monthly P&I
- —
- Monthly cashflow
- —
- DSCR
- —
- Eligible?
- —
Short-term bridge; refi at stabilization.
Listing history 3 events
-
2026-05-26$55,000 Active
-
2013-07-18soldstatus $5,800
-
2003-04-24soldstatus $22,500
ⓘ Source: listings_history table (triggers on properties + properties_extension) + one-shot
backfill from property_details.listing_events for pre-trigger history.
Tax reassessment forecast NE · Resets to sale price
- Current annual tax
- $389 · $32/mo
- Projected year-2 tax
- $952 · $79/mo
- Expected delta
- +$563/yr (+$47/mo · 144.8%)
ⓘ Screening estimate from a state-policy table — verify with the county assessor before closing.
Climate risk First Street
- Flood 1/10 Low FEMA zone X (unshaded) · 0% chance over 30 yrs
- Wildfire 1/10 Low
- Heat 3/10 Moderate 7 d/yr ≥103°F today · 16 d/yr by 30 yrs out
- Wind 2/10 Low
- Air quality 2/10 Low 1 unhealthy d/yr today · 1 by 30 yrs out
Nearby sold comps map
Loading sold comps map…
Walkable amenities ~0.75 mi
Loading nearby amenities…
Taxation est. · year 1
- Rental income
- $10,327
- − Mortgage interest
- −$3,081
- − Property taxes
- −$389
- − Insurance
- −$275
- − Repairs & maintenance
- −$826
- − Management
- −$826
- − Depreciation
- −$1,600
- Taxable income
- $3,330
- Est. tax owed @ 24.0%
- −$799
- After-tax cash flow
- $3,234/yr
For passive investors: Depreciation is non-cash, so a rental often shows a tax loss while cash-flowing — sheltering income. Rental losses are passive: they offset passive income freely, and up to $25,000/yr can offset ordinary (W-2) income if you actively participate and your MAGI is under $100k (phasing out to $0 by $150k); unused losses carry forward. On sale, claimed depreciation is recaptured at up to 25%, and gains may owe capital-gains tax (a 1031 exchange can defer both). Figures are a year-1 estimate at your 24.0% rate — not tax advice; consult a CPA.
Schools (NCES district)
- District
- Fillmore Central Public Schools
- NCES district ID
- 3100118
- Math proficiency
- 56% ▼ -4.00%
- Reading proficiency
- 54% ▼ -3.00%
- Median HH income
- $47,623
- Composite
- 46.72/100
- National rank
- #2396
- State rank
- #41 of 111 in NE
Livability — Fairmont
- Score
- 66/100
- State rank
- #313
- US rank
- #11759
Category grades
Schools grade is shown separately in the Schools card above.
Census & demographics
- Census place
- Fairmont, NE
- City population
- 803
- Population (ZIP)
- 803
Population outlook (Fillmore County) Hauer SSP2
- Today (2025)
- 5,729 people
- By 2030
- 5,696 · -0.6%
- By 2040
- 5,561 · -2.9%
- By 2050
- 5,412 · -5.5%
- By 2075
- 5,437 · -5.1%
- By 2100
- 5,373 · -6.2%
Race, ethnicity, and origin ACS 2023
- Neighborhood character
- Predominantly White (98%)
- Race & ethnicity
- White 98% Hispanic / Latino 1% Two or more races 1%
- Common ancestry
- Iranian 4% Scotch-Irish 2% Portuguese 1%
- Foreign-born
- 1%
- Languages at home
- 98% English-only · Spanish 1% Other Indo-European 1%
Political lean MEDSL · Fillmore
- 2024 margin
- Solid R (+54.9) · D 22.0% · R 76.8% · Other 1.2%
- 2008→2024 swing
- -22.6pp toward R · 2008: -32.3pp · 2024: -54.9pp
- All cycles
- 2024: R+54.9 2020: R+52.9 2016: R+51.8 2012: R+41.8 2008: R+32.3
Not yet ingested
- Civics
- —
Market trends
- HPI YoY
- ▲ 8.41%
- Current HPI
- 204.0051
- Rent YoY
- —
- Metro
- —
- State GDP YoY
- ▲ 0.68%
- F500 in state
- 2
Industry mix (Fortune 500 HQ in NE)
| Industry | F500 HQs | Revenue |
|---|---|---|
| Conglomerate | 1 | $371B |
|
||
Price history
+144.4% since first listed3 events — show timeline
- 2026-05-26 Listed $55,000 FSBO.com
- 2013-07-18 Sold (Public Records) $5,800 Public Records
- 2003-04-24 Sold (Public Records) $22,500 Public Records
Property tax history
-0.2%/yrLatest (2025): $389 · +19.7% YoY. Source: county tax records.
Cash-flow waterfall
monthlySold comps — $/sqft
last 12 mo · ≤1 miLoading sold comps…